White Rose Research Online URL for this paper:
http://eprints.whiterose.ac.uk/104224/
Version: Published Version
Article:
Fotios, S. orcid.org/0000-0002-2410-7641, Uttley, J. and Fox, S. (2016) Exploring the
nature of visual fixations on other pedestrians. Lighting Research and Technology. ISSN
1477-1535
https://doi.org/10.1177/1477153516666132
[email protected] https://eprints.whiterose.ac.uk/ Reuse
This article is distributed under the terms of the Creative Commons Attribution-NonCommercial (CC BY-NC) licence. This licence allows you to remix, tweak, and build upon this work non-commercially, and any new works must also acknowledge the authors and be non-commercial. You don’t have to license any derivative works on the same terms. More information and the full terms of the licence here:
https://creativecommons.org/licenses/
Takedown
If you consider content in White Rose Research Online to be in breach of UK law, please notify us by
Exploring the nature of visual fixations
on other pedestrians
S FotiosPhD,J UttleyPhD andS FoxBSc
School of Architecture, University of Sheffield, Sheffield, UK
Received 14 June 2016; Revised 14 July 2016; Accepted 3 August 2016
How we look at other people may affect conclusions drawn about the effect of changes in lighting when this task needs to be done after dark. This paper reports further analysis of the distance and duration of fixation on other pedestrians, updating a previous review by considering a greater number of fixations and by examining the influence on these of other characteristics such as the relative direction of travel. This analysis provides further support for a tendency to fixate others at a distance of 15 m and for a duration of 500 ms.
1. Introduction
Pedestrians tend to visually fixate other pedes-trians1,2and this may be done at least partially to inform the decision as to whether it is safe to approach that person or that they should be avoided.3–6 After dark, in locations where pedestrians are expected, road lighting should aid this task.
Research has been carried out to investi-gate how changes in lighting affect the ability to make judgements about other pedestrians. Some studies have used a stop-distance pro-cedure in which the test participant walks towards a target person and stops at the point when the required task (e.g. identification) can be done.6–12Further studies have sought judgements when targets are presented at one or more fixed distances.13–20 The stop-dis-tance procedure reveals the disstop-dis-tance at which a task could be completed, but does not reveal whether that distance approximates that at which it is desirable for pedestrians after dark. Experiments seeking judgements at fixed distances may exhibit better ecological
validity but only if the distances used in trials include (or bracket) that which approximates pedestrians’ desired distance for evaluating other people.
Caminada and van Bommel6 established the basis of current lighting recommendations for pedestrians and within this they adopted the distance estimates of Hall,21i.e. a distance of 3.7 m (12 feet) as the minimum distance at which an alert subject would be able to take evasive or defensive action if threatened, and 10 m, an ideal facial recognition distance being the transition point between the close and far phases of Hall’s public zone. Fotios
et al.22 reviewed Hall21 and concluded that the evidence was not sufficiently robust and furthermore that Hall had not intended its use for such a purpose. They also found disagree-ment with other estimates of interpersonal distance23 and demonstrated range bias in experiments investigating comfortable inter-personal distances.24,25
Experiments using a stop distance proced-ure (along with some using fixed distances) require that the test participant continuously fixate the target person. This does not repre-sent typical behaviour. Glances toward other people tend to be short because it is often uncomfortable to look at others for long periods26 and because there may be no need Address for correspondence: Steve Fotios, School of
Architecture, The University of Sheffield, The Arts Tower, Western Bank, Sheffield, S10 2TN, UK.
to – information about others such as trust-worthiness can be gained from exposures as short as 50 ms.27,28
As the light level increases (within the range of levels typical of outdoor lighting) then reaction time decreases and visual acuity increases, i.e. objects can be seen more quickly and when they are smaller or further away.29 The accuracy of recognition judgements is affected by distance, becoming more accurate for closer targets.30 Therefore, distance and duration matter to research of lighting for interpersonal judgements because they may affect the lighting conditions found to be optimal for this task. As a first estimate of desirable conditions, Fotios et al.22 drew esti-mates of distance and duration from eye tracking carried out in a natural outdoor setting.31 They found a tendency to fixate upon other people at a distance of 10.3 m and for a duration of 480 ms. When considered alongside other data these estimates were modified to a desire to fixate other people at a distance of 15 m and for a duration of 500 ms. There are two limitations to their analysis of the eye-tracking data: (1) They did not examine all of the available video records, i.e. only two of the four route sections and for the duration estimate this considered only the records for five people; and, (2) They did not record supplementary data such as the group size, gender and relative travel direction of the observed people and hence whether these fac-tors affect the distance and duration of fixation. This paper reports the findings of a more extensive analysis, made possible by further research funding, extending the previous study by inclusion of all sections of the available video records and by extending the range of data recorded. The key questions targeted in this paper are at what distance and for what duration do people tend to look at other pedestrians, is there a tendency to fixate either the head or body and are these affected by characteristics such as the gender and travel direction of other people?
2. Method
Further analysis was carried out of previously reported work in which mobile eye tracking was used to investigate the gaze behaviour of pedes-trians walking outdoors along an urban route of approximately 900 m, in daytime and after dark.1,31The 40 pedestrians all followed a near-identical route, completing it in both directions on two separate occasions, resulting in the collection of 80 eye-tracking videos. A number of these sessions provided relatively poor eye-tracking signal due to loss of the pupil image, largely due to individual eye and pupil charac-teristics and the data being recorded in an outdoor environment with variable weather conditions (see Holmqvist et al.32). Sessions were excluded from further analysis if the proportion of valid data with acceptable point-of-regard location was below 50%. This resulted in the exclusion of 26 of the 80 videos, the remaining 54 being retained for this analysis.
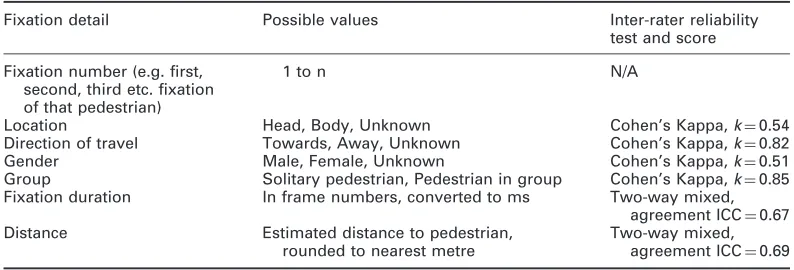
Each video was coded by a primary coder to record details of every fixation to another pedestrian. Fixation of a pedestrian was defined as the gaze cursor being located on or very near to another pedestrian visible in the video, to allow for the18margin of error present in the eye-tracker (as reported in the manufacturer’s documentation), for at least 3 frames, or 120 ms based on the video’s frame rate of 25 Hz. Table 1 lists the details that were recorded about each fixation. Distances were estimated with reference to the known size of other objects in the field of view, such as vehicles, paving slabs and street benches.
Kappa values ranged between 0.51 and 0.85, which suggest ‘Moderate’ up to ‘Almost Perfect’ agreement between coders according to Landis and Koch.34 ICC values were 0.67 and 0.69, suggesting agreement was ‘good’ according to thresholds set out by Cicchetti.35 Based on the agreement classifications, agree-ment between the two coders on location and gender are moderate, fixation duration and distance are good and direction of travel and group are almost perfect. Overall, this suggests there was acceptable agreement between the primary and second coders, and data recorded by the primary coder have been used in all subsequent analysis.
Of the recorded measures, distance to a fixated pedestrian is one of the more subject-ive details estimated.36 While recorded data showed good consistency between different coders, the accuracy to which these reflect the real distance is not revealed. A second valid-ation step was therefore carried out. The actual distances between observer and fixated pedestrian were measured in-situ for 15 situ-ations where positions of observer and fixated pedestrian could be accurately established from the eye-tracking videos and these were compared with estimated distances for those situations by the primary coder. The mean
ratio of actual to estimated distances was 1.31 (s.d.¼0.38), with distances being consistently underestimated (mean estimated distance¼ 10.3 m, mean actual distance¼13.9 m, dis-tances were overestimated in only 2 of the 15 situations). This is consistent with previous findings that egocentric distances are under-estimated in virtual environments.37The mean ratio of actual to estimated distances for the 15 situations used in the validation exercise (1.31) was therefore applied to all estimated distances to account for the expected systematic under-estimation: this increased the mean estimated distances of these 15 situations to 13.5 m, which is within 3% of the mean actual distance of 13.9 m.
3. Results
[image:4.536.70.467.84.219.2]Fifty-four eye-tracking videos were included in the analysis, which covered 21 day sessions and 33 after-dark sessions from 37 partici-pants. Within these videos 2496 other pedes-trians were fixated, some of whom were fixated more than once, resulting in details being recorded for 5955 separate fixations. Four aspects of fixation were analysed: the number of fixations, the duration of fixations,
Table 1 Details recorded about pedestrian fixations and reliability test scores between the two coders
Fixation detail Possible values Inter-rater reliability test and score
Fixation number (e.g. first, second, third etc. fixation of that pedestrian)
1 to n N/A
Location Head, Body, Unknown Cohen’s Kappa,k¼0.54
Direction of travel Towards, Away, Unknown Cohen’s Kappa,k¼0.82
Gender Male, Female, Unknown Cohen’s Kappa,k¼0.51
Group Solitary pedestrian, Pedestrian in group Cohen’s Kappa,k¼0.85 Fixation duration In frame numbers, converted to ms Two-way mixed,
agreement ICC¼0.67 Distance Estimated distance to pedestrian,
rounded to nearest metre
Two-way mixed, agreement ICC¼0.69
the distance of first fixation, and whether fixation was on the head or the body. The fixation details were further analysed by the variables included in Table 1 and the gender of the observer.
Analysis of the data was carried out by calculating the mean number of fixations, mean fixation duration and mean fixation distance as recorded within each video, for each pedestrian for their night and day videos separately. These data were found to be normally distributed as assessed by inspection of normality plots, comparison of mean and median, skewness and kurtosis statistics and statistical tests against normal distribution. Parametric statistical tests have therefore been applied as appropriate.
3.1. How frequently do we fixate other pedestrians?
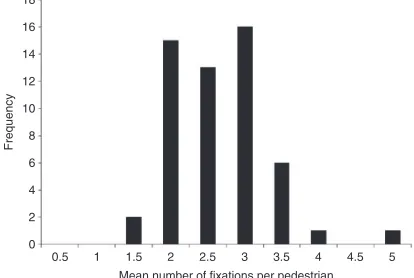
Observers fixated other pedestrians a mean of 2.4 times (s.d.¼0.6); Figure 1 shows the distribution of the mean number of fixations per person. This was significantly influenced by the direction of travel of the fixated pedes-trian, with a repeated-measures analysis of variance (ANOVA) suggesting a significant difference between categories (p50.001). A post-hoc Tukey HSD test suggested those
pedestrians walking away from the observer attracted significantly more fixations (mean¼3.3) compared with those standing still or walking towards the observer (means¼2.1 and 2.0, respectively, p50.001
in both cases). This may be because pedes-trians walking away from the observer are likely to be in the field of view for a longer period of time, giving the opportunity for more fixations, or because walking away means there is no possibility of eye-contact, this giving a more comfortable situation for looking at other people.26,38 It may also be because movement away is less familiar than movement towards and requires a longer time to make recognition-type decisions.39In addition to the higher mean number of fixations on people walking away from the observer, there is also a higher standard deviation: this may be an indication that there is a common motivation for fixating people approaching (considered alongside the lower mean, this might be a common desire to avoid the gaze of others) but a number of possible motivations for fixating people who are stationary or moving away.
The mean number of fixations towards the body (mean¼1.3) tended to be slightly higher than towards the head (mean¼1.1): this difference is close to being significant (p¼0.06). No other significant effects were found (Table 2). Regarding the gender of the fixated person, while these data did not suggest a significant difference in frequency of fixation toward males or females, the standard devi-ation is greater for females than for males. This might indicate a common motivation for looking at males (perhaps since considered to be the gender more likely to present a threat) but a number of possible motivations for fixating on females.
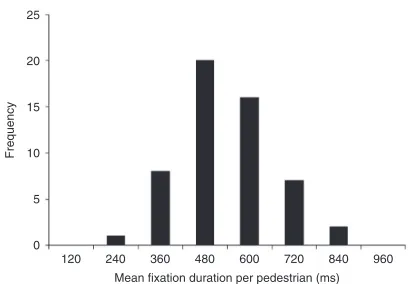
3.2. How long do we fixate other pedestrians? The mean duration of each fixation was 475 ms (s.d.¼124 ms); the distribution of mean fixation durations is shown in Figure 2. There was no significant difference between
Frequency
0.5 1 1.5 2 2.5
Mean number of fixations per pedestrian 3 3.5 4 4.5 5 18
16
14 12
10 8 6
[image:5.536.51.258.445.584.2]4 2 0
the mean duration of the first fixation of a pedestrian (mean¼477 ms) and any subse-quent fixations to that same pedestrian (mean¼492 ms).
Viewers tend to concentrate their fixations, including the very first fixation in a scene, on interesting and informative regions.40 The initial fixation on a target is sufficient to allow categorisation and identification judge-ments41 to allow judgements of trustworthi-ness27 and provides sufficient information to
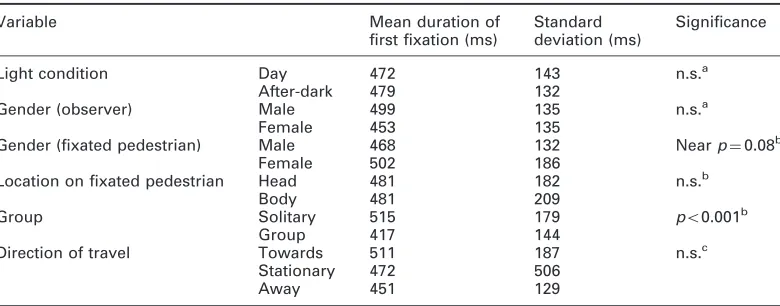
correctly identify the general gist of the scene in front of the observer.42Given this emphasis on data extracted in the first fixation, further analyses of fixation durations (and fixation distance, see below) were therefore based on the first fixation made towards the pedestrian. The mean duration of first fixations to pedes-trians was calculated for each participant and these values used in subsequent analysis. The distribution of these mean values for each participant was also approximately normal and parametric statistical tests have been used. The first fixation tended to be of longer duration when the fixated pedestrian was on their own (mean¼515 ms) compared with in a group (mean¼417 ms,p50.001). The gender of the fixated pedestrian may have had an influence on duration of the first fixation, with a longer time spent fixating females (mean¼502 ms) compared with males (mean¼468 ms), although this difference was not significant (p¼0.08). No other significant effects were found (Table 3).
3.3. How far away do we fixate other pedestrians?
[image:6.536.83.454.84.236.2]Analysis of the distance at which other pedestrians were fixated uses the weighted
Table 2 Mean number and standard deviation of fixations on pedestrians by different variables
Variable Mean number
of fixations
Standard deviation
Significance
Light condition Day 2.6 0.78 n.s.a
After-dark 2.3 0.51
Gender (observer) Male 2.4 0.50 n.s.a
Female 2.4 0.76
Gender (fixated pedestrian) Male 2.5 0.71 n.s.b
Female 2.7 1.30
Location on fixated pedestrian Head 1.1 0.50 p¼0.06b
Body 1.3 0.64
Group Solitary 2.4 0.72 n.s.b
Group 2.5 0.99
Direction of travel Towards 2.0 0.53 p50.001c
Stationary 2.1 1.53
Away 3.3 1.59
aIndependent t-test bDependent t-test
cRepeated-measures ANOVA
Frequency
20
15
10
5
0 25
120 240 360 480 600 720 840 960 Mean fixation duration per pedestrian (ms)
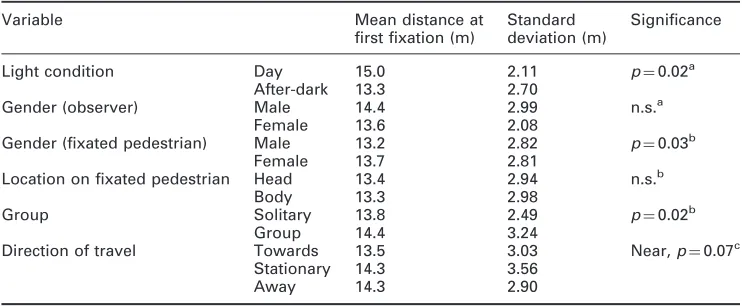
[image:6.536.52.257.296.438.2]distance estimate which accounts for the systematic underestimation of estimates by the primary coder (see Section 2 above). Figure 3 shows the distribution of mean distances at first fixation towards other pedes-trians. The mean distance to pedestrians when first fixated was 14.0 m (s.d.¼2.6 m).
This distance tended to be greater during the daytime (mean¼15.0 m) compared with after-dark (mean¼13.3 m, p¼0.02). This was
found also in the previous analysis (daytime¼ 13.0 m, after dark¼8.9 m). The distance a pedestrian was first fixated was significantly shorter if they were on their own (mean¼ 13.8 m) than if they were part of a group (mean¼14.4 m, p¼0.02). Female pedestrians tended to be fixated at a greater distance (13.7 m) than were males (mean¼13.2 m,
p¼0.03). There was a suggestion that pedes-trians walking towards the observer were fixated at a slightly shorter distance (mean¼ 13.5 m) compared with pedestrians who were stationary or walking away from the observer (respective means¼14.3 m for both), although this difference did not reach significance (repeated-measures ANOVA, p¼0.07). The gender of the observer and whether the first fixation was to the head or body did not have a significant effect on the distance of fixation (Table 4).
[image:7.536.74.464.83.236.2]3.4. Do we fixate on different parts (head vs. body) on different fixations? The probability of a participant looking at the body of another pedestrian rather than the head on the first fixation is 0.51 (a difference also shown in Table 2) and
Table 3 Mean duration and standard deviation of first fixations on pedestrians by different variables
Variable Mean duration of
first fixation (ms)
Standard deviation (ms)
Significance
Light condition Day 472 143 n.s.a
After-dark 479 132
Gender (observer) Male 499 135 n.s.a
Female 453 135
Gender (fixated pedestrian) Male 468 132 Nearp¼0.08b
Female 502 186
Location on fixated pedestrian Head 481 182 n.s.b
Body 481 209
Group Solitary 515 179 p50.001b
Group 417 144
Direction of travel Towards 511 187 n.s.c
Stationary 472 506
Away 451 129
aIndependent t-test bDependent t-test
cRepeated-measures ANOVA
Mean distance at first fixation (m) 35
30
25
20
Frequency 15
10
5
0
[image:7.536.52.258.302.436.2]3 6 9 12 15 18 21
increases slightly to 0.53 for subsequent fixations. This change is not significant (dependent t-test, p¼0.36) and does not suggest a tendency to fixate the head or body at different fixation points.
While these figures suggest similar tendencies to fixate the head or body, an area-weighted analysis would show a greater tendency to fixate the head than the body43as has been found by others.44 This may be because the face contributes more informa-tion than does the body. Hahn et al.30
examined recognition judgements in videos of people walking towards the camera and found that the body contributes to recogni-tion judgements at larger distances but that the face dominates at shorter distances. Burton et al.45 found that recognition was significantly affected by loss of the face in observed images but not by loss of the body or of gait.
4. Comparison with previous analysis
The original analysis22 estimated fixation distance from 1683 discrete fixations on
1128 pedestrians and fixation duration from 177 fixations. The current analysis estimated distance and duration from 5955 fixations towards 2496 pedestrians, the higher numbers being due to an increased number of route sections, and is expected therefore to lead to more precise and accurate estimates of the nature of fixations toward other pedestrians. Table 5 compares estimates of fixation char-acteristics from the two studies.
[image:8.536.83.454.93.246.2]The critical characteristics are the distance and duration of fixations as these parameters affect the ability to extract visual information and, therefore, the conclusions drawn about changes in lighting. The current analysis indi-cated fixations took place at a longer distance (mean¼14.0 m) than the previous analysis (median¼10.3 m). One reason for this is that different methods were used for estimating distance. In the first analysis22 distance was estimated by assuming each person fixated was of an average height (1.7 m). The current approach was to estimate distance by using as a cue the size of objects in the field of view and then weighting these estimates with a correction factor to counter the distance underestimate found in the second validation process.
Table 4 Mean distance and standard deviation of first fixations on pedestrians by different variables
Variable Mean distance at
first fixation (m)
Standard deviation (m)
Significance
Light condition Day 15.0 2.11 p¼0.02a
After-dark 13.3 2.70
Gender (observer) Male 14.4 2.99 n.s.a
Female 13.6 2.08
Gender (fixated pedestrian) Male 13.2 2.82 p¼0.03b
Female 13.7 2.81
Location on fixated pedestrian Head 13.4 2.94 n.s.b
Body 13.3 2.98
Group Solitary 13.8 2.49 p¼0.02b
Group 14.4 3.24
Direction of travel Towards 13.5 3.03 Near,p¼0.07c
Stationary 14.3 3.56
Away 14.3 2.90
aIndependent t-test bDependent t-test
This revised estimate provides further sup-port for the proposal that 15 m is the distance at which it would be appropriate to investigate the effects of lighting on interpersonal judgements. It is a practical distance, being a shorter distance than that (23 m) at which the rate of correct facial identity recognition reduces to 25%,46and falls within the ‘action space’ zone (2–30 m) of Cutting and Vishton.23 It is longer than the distances (4 m and 10 m) adopted by Caminada and van Bommel6 but agrees better with opinion from design guidance texts which propose there should be an ability to have a good look at other people at distances from 12 m to 25 m,47–49and agrees with Townshend’s finding of the preferred comfort distance after dark (15 m).50 For 72% of the eye-tracking sessions analysed here, first fixations were made at a distance of less than 15 m.
The current analysis indicated fixations took place for a nearly identical duration (mean¼475 ms) to that found in the previous analysis (median 480 ms) and that (500 ms) which can be estimated from other work.51 For convenience we suggest this estimate of typical fixation duration is rounded to 500 ms. The duration of fixation was affected
by group size, tending to be of longer duration when fixating a pedestrian on their own compared with in a group.
5. Conclusion
[image:9.536.69.466.84.245.2]The aim of this paper is to identify the typical characteristics of fixations on other pedes-trians and thus to inform the design and interpretation of experiments investigating how changes in lighting affect interpersonal judgements. Fixation characteristics were established through a review of the eye-tracking records of pedestrians walking out-doors in a natural setting in daytime and after dark, extending a previous analysis22 by analysing a much larger set of fixations. For future investigations of interpersonal judge-ments it is concluded that targets should simulate observation at a distance of 15 m and observation periods of 500 ms. The data do not indicate a need to discriminate between fixation on the head or body but that there may be a need to consider characteristics such as whether the fixated person is male or female and whether solo or in a group,
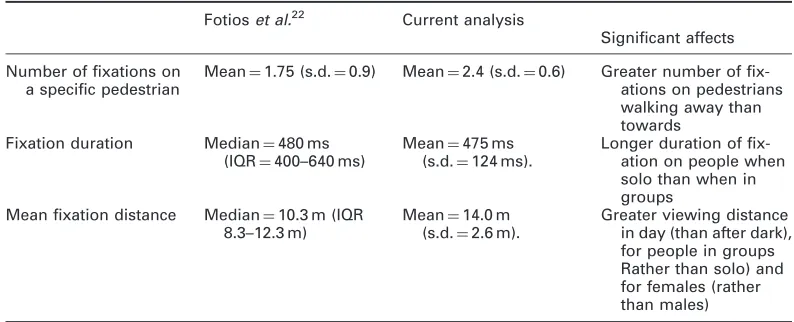
Table 5 Comparison of pedestrian fixation characteristics in previous22and current analyses
Fotioset al.22 Current analysis
Significant affects
Number of fixations on a specific pedestrian
Mean¼1.75 (s.d.¼0.9) Mean¼2.4 (s.d.¼0.6) Greater number of fix-ations on pedestrians walking away than towards
Fixation duration Median¼480 ms (IQR¼400–640 ms)
Mean¼475 ms (s.d.¼124 ms).
Longer duration of fix-ation on people when solo than when in groups
Mean fixation distance Median¼10.3 m (IQR 8.3–12.3 m)
Mean¼14.0 m (s.d.¼2.6 m).
Greater viewing distance in day (than after dark), for people in groups Rather than solo) and for females (rather than males)
Declaration of conflicting interests
The authors declared no potential conflicts of interest with respect to the research, author-ship, and/or publication of this article.
Funding
The authors disclosed receipt of the following financial support for the research, authorship, and/or publication of this article: This work was supported by the Engineering and Physical Sciences Research Council (EPSRC) grant number EP/M02900X/1.
References
1 Fotios S, Uttley J, Yang B. Using eye-tracking to identify pedestrians’ critical visual tasks. Part 2. Fixation on pedestrians.Lighting Research and Technology2015; 47: 149–160.
2 Foulsham T, Walker E, Kingstone A. The where, what and when of gaze allocation in the lab and the natural environment.Vision Research2011; 51: 1920–1931.
3 British Standards Institution BS 5489-1:2013. Code of Practice for the Design of Road Lighting Part 1: Lighting of Roads and Public Amenity Areas. London: BSI, 2012.
4 Willis ML, Palermo R, Burke D. Judging approachability on the face of it: The influence of face and body expressions on the perception of approachability.Emotion2011; 11: 514–523. 5 Simons RH, Hargroves RA, Pollard NE,
Simpson MD.Lighting criteria for residential roads and areas: Proceedings of the 21st Session of the CIE, Venice, 17–25 June 1987, pp. 274– 277.
6 Caminada JF, van Bommel WJM. New lighting criteria for residential areas.Journal of the Illuminating Engineering Society1984; 13: 350–358.
7 Boyce PR, Rea MS. Security lighting: effects of illuminance and light source on the capabilities of guards and intruders.Lighting Research and Technology1990; 22: 57–79.
8 Knight C. Field surveys investigating the effect of lamp spectrum on the perception of safety and comfort at night.Lighting Research and Technology2010; 42: 313–330.
9 Knight C, Van Kemenade J.Wahrnehmung und Wertscha¨tzung der Endkunden in Bezug auf die o¨ffentliche Beleuchtung (Effect of outdoor lighting on perception and appreciation of endusers): Proceedings of Licht 2006, Berne, Switzerland, September 10-13: 2006.
10 Johansson M, Rahm J.Perceived lighting qualities and pedestrian performance: Proceedings of 28th Session of the CIE, Manchester, UK, 28 June to 4 July: 2015: pp. 324–333.
11 Rea MS, Bullough JD, Akashi Y. Several views of metal halide and high pressure sodium lighting for outdoor applications.Lighting Research and Technology2009; 41: 297–314. 12 Yao Q, Sun Y, Lin Y. Research on facial
recognition and color identification under CMH and HPS lamps for road lighting. Leukos2009; 6: 169–178.
13 Alferdinck JWAM, Hogervorst MA, Van Eijk AMJ, Kusmierczyk JT.Mesopic Vision and Public Lighting – A Literature Review and a Face Recognition Experiment.Publication TNO-DV C435. Soesterberg, The Netherlands: TNO, 2010. 14 Dong M, Fotios S, Lin Y. The influence of
observation duration and procedure on lumi-nance required for recognition of pedestrian’ faces.Lighting Research and Technology2015; 47: 693–704.
15 Fotios S, Yang B, Cheal C. Effects of outdoor lighting on judgements of emotion and gaze direction.Lighting Research and Technology 2015; 47: 301–315.
16 Fotios S, Castleton H, Cheal C, Yang B. Investigating the chromatic contribution to recognition of facial expression.Lighting Research and Technology. First published November 24 2015, doi:1477153515616166. 17 Lin Y, Fotios S. Investigating methods for measuring facial recognition under different road lighting conditions.Lighting Research and Technology2015; 47: 221–235.
19 Iwata M, Ayama M, Mori T, Iwasaki H, Kohko S, Inoue Y, Itsuki H, Kyoto N. Appearance of human face and atmosphere of environment under LED street lights using different correlated colour temperature: Proceedings of 28th session of the CIE, Manchester, UK, 28 June – 4 July 2015, 1638– 1646.
20 Rombauts P, Vandewyngaerde H, Maggetto G. Minimum semicylindrical illuminance and modelling in residential area lighting.Lighting Research and Technology 1989; 21: 49–55. 21 Hall E.The Hidden Dimension. New York:
Anchor Books, 1969: , pp. 123–124.
22 Fotios S, Yang B, Uttley J. Observing other pedestrians: Investigating the typical distance and duration of fixation.Lighting Research and Technology 2015; 47: 548–564.
23 Cutting JE, Vishton PM. Perceiving layout and knowing distances: The integration, rela-tive potency, and contextual use of different information about depth. In: Epstein W, Rogers S. (eds)Perception of Space and Motion. London: Academic Press, 1995, pp. 69–117. 24 Adams L, Zuckerman D. The effect of lighting
conditions on personal space requirements. Journal of General Psychology 1991; 118: 335–340.
25 Fujiyama T, Childs C, Boampong D, Tyler N. Investigation of Lighting Levels for Pedestrians – Some Questions About Lighting Levels of Current Lighting Standards. London: Centre for Transport Studies, 2005.
26 Cook M. Gaze and mutual gaze in social encounters. American Scientist1977; 65: 328–333.
27 Todorov A, Pakrashi M, Oosterhof NN. Evaluating faces on trustworthiness after minimal time exposure.Social Cognition2009; 27: 813–833.
28 Willis J, Todorov A. First impressions: Making up your mind after a 100-ms exposure to a face. Psychological Science2006; 17: 592–598.
29 Fotios SA, Cheal C, Boyce PR. Light source spectrum, brightness perception and visual performance in pedestrian environments: A review.Lighting Research and Technology 2005; 37: 271–294.
30 Hahn CA, O’Toole AJ, Phillips PJ. Dissecting the time course of person recognition in natural viewing environments.British Journal of Psychology2016; 107: 117–134.
31 Fotios S, Uttley J, Cheal C, Hara N. Using eye-tracking to identify pedestrians’ critical visual tasks. Part 1. Dual task approach. Lighting Research and Technology2015; 47: 133–148.
32 Holmqvist K, Nystro¨m M, Andersson R, Dewhurst R, Jarodzka H, Van de Weijer J. Eye Tracking: A Comprehensive Guide to Methods and Measures. Oxford: Oxford University Press, 2011.
33 Hallgren KA. Computing inter-rater reliability for observational data: an overview and tutorial.Tutorials in Quantitative Methods for Psychology2012; 8: 23–34.
34 Landis JR, Koch GG. The measurement of observer agreement for categorical data. Biometrics1977; 33: 159–174.
35 Cicchetti DV. Guidelines, criteria, and rules of thumb for evaluating normed and standar-dized assessment instruments in psychology. Psychological Assessment 1994; 6: 284–290. 36 Norman JF, Adkins OC, Pedersen LE. The
visual perception of distance ratios in physical space.Vision Research 2016; 123: 1–7.
37 Waller D, Richardson AR. Correcting distance estimates by interacting with immersive virtual environments: Effects of task and available sensory information.Journal of Experimental Psychology: Applied2008; 14: 61–72.
38 Laidlaw KEW, Foulsham T, Kuhn G, Kingstone A. Potential social interactions are important to social attention.Proceedings of the National Academy of Sciences2011; 108: 5548–5553.
39 Pilz KS, Vuong QC, Bu¨lthoff HH, Thornton IM. Walk this way: Approaching bodies can influ-ence the processing of faces.Cognition2011; 118: 17–31.
40 Henderson JM. Human gaze control during real-world scene perception.Trends in Cognitive Sciences2003; 7: 498–504.
42 Underwood G.Cognitive Processes in Eye Guidance. Oxford: Oxford University Press, 2005. 43 Fletcher-Watson S, Findlay JM, Leekam SR,
Benson V. Rapid detection of person infor-mation in a naturalistic scene.Perception2008; 37: 571–583.
44 Birmingham E, Bischof WF, Kingstone A. Gaze selection in complex social scenes. Visual Cognition2008; 16: 341–355.
45 Burton AM, Wilson S, Cowan M, Bruce V. Face recognition in poor-quality video: Evidence from security surveillance. Psychological Science 1999; 10: 243–248. 46 Loftus GR, Harley EM. Why is it easier to
identify someone close than far away? Psychonomic Bulletin and Review2005; 12: 43–65.
47 Colquhoun I.Design Out Crime: Creating Safe and Sustainable Communities. Oxford:
Architectural Press, 2004.
48 Dravitzki VK, Cleland BS, Walton D, Laing JN.Measuring commuting pedestrians’ con-cerns for personal safety and the influence of lighting on these concerns: Proceedings of the 26th Australasian Transport Research Forum, Wellington, New Zealand, 1–3 October 2003. 49 Luymes DT, Tamminga K. Integrating public
safety and use into planning urban greenways. Landscape and Urban Planning1995; 33: 391–400.
50 Townshend T. The role of public lighting. In: Oc T, Tiesdell SA. (eds)Safer City Centres: Reviving the Public Realm. London: Paul Chapman Publishing Ltd., 1997: , pp. 119–129. 51 Jovancevic-Misic J, Hayhoe M. Adaptive gaze