COU(93) 485final
Brussels, 13 October 1993 .,
:::-·~,
~'
I
l;
' ,,~f
•,·,
,,.
-r' :{
,,
REPORT FROM THE COMMISSION
ANNUAL REPORT ON THE IMPLEUENTKriON OF I~E IMPs - 1991-1992
., _ ...
' '·
J
~ .. ~~
v
~!'
t
...
'.•
~.;
~-f1"
t
~i
I
l
I
I
121
P L A. N
I. SUMMARY
I I. UTILISATION OF FINANCIAL RESOURCES
A.. Take-up of Community appropriations
B. Uti I isation of EIB loans
I II.A.CTIVITY IN 1991 AND 1992
A.
B.
Progress of the programmes
A.1. Progress of the French IMPs A.2. Progress of the ltall,a;n IMPs A.3. Progress of the Greek IMPs
Common activities and studies
p. 1
p. 2
p. 2
p. 8
p. 11
p.11
p. 11
p .12
p .15
p.16
8.1. Analysis of national financi~l procedures p.16 B.2. A.naly~is of national administradve procedures p.17
,f
'--IV. PHYSICAL PROGRESS OF PROGRAMMES
ANNEXES
Approved Community Assistance 86-92 Commitments scheduled at 13.12.91
Commitments and payments made at 31.12.91 Commitments and payments made at 31.12.92 Rates pf implementation and of settlement
I. SUMW.RY
1. This progress report on the Integrated Mediterannean Programmes (IMPs) covers both the years 1991 and 1992. As with previous annual reports, it relates both to the financial implementation of the programmes and to the results achieved on the ground. The period covered was the final stage in the programmes which had all commenced in 1986/88, though under the terms of Regulation (EEC) 2088/85 the Commission may continue to make financial commitments in 1993 and payments may be effected for some period after that.
2. The period 1991-1992 saw largely sucessful implementation in France and Greece with concern about the continuing effects of initial delays in several ltal ian programmes. Steps were taken to target resources on the more successfu I programmes where there was scope for further financial absorption, so as to uti lise the available Community assistance more effectively. As was mentioned in the previous report, Commissioner Millan had written to the Presidents of the regional authorities in all French and ltal ian IMP regions in December 1990 requesting details of expenditure effected until 31 March 1991. This data subsequently became the basis for a review of financial allocations carried out in 1991 and 1992 which saw the definitive allocation of the resources made available by Regulation (EEC) 2088/85.
4. By the end of 1992, the finance made available by the Community had been largely committed. Regulation (EEC) 2088/85 permits outstanding funds to be committed, within Community financial
rules, in 1993. In France and Greece the overwhelming bulk of the funds had been committed at the end of the year and much of that had already been paid to the regional authorities. In Italy most programmes remained with significant amounts to be committed. It is hoped to absorb as much as possible of this outstanding assistance in 1993, consistent with Community financial rules.
5. 1991 and 1992 saw the conclusion of a number of horizontal Initiatives drawing on the experiences of programmes in al 1 three countries. Among these were ana I yses of nat iona I f i nanc i a I and administrative procedures, which are summarised in this report. The IMPs have become a valuable experience for the development of future Community action in regional policy. Lessons learned in these programmes played an important role in the reform of the structural funds in 1989 and wi I I also influence the next generation of regional progammes for the period 1994-99. To draw the fullest lessons from the IMP experience it is important that an ex-post evaluation should now be initiated. It is intended that such an evaluation will be carried out in each country beginning in 1993. The overal I impact of the programmes wi I I thus be judged objectively and the value of the IMPs wil I be
definitively assessed. ~
II. UTILISATION OF FINANCIAL RESOURCES
A. Take-up of Community 1lppropr i at ions
,
--AI location in 1991
i.
ERDF ESF EAGGF FISHERIES EX L551 TOTAL
French IMPs 233.97 122.04 140.46 7.60 295.68 799.73
Greek IMPs 797.96 102.02 281.93 2.57 808.34 1992.82
Italian IMPs 367.42 137.12 281.02 18.15 452.76 1256.46
TOTAL 1399.35 361.18 703.41 28.32 1556.78 4049.01
Final allocation In 1992
2. In the context of the total budgetary resources foreseen In the
regulation, the allocation at the end of 1991 represented 98.8% of the Convnunlty funds available to the IMP-s. The difference between the total of this assistance and the maximum sum of 4.1
billion Ecus referred to In Regulation (EEC)N"2088/85 was
allocated In 1992 to the Greek progranvnes and to four French programmes. With the revision decisions on these programmes the final allocation of Community resources was determined by March 1992, as shown In the following table<1>:
ERDF ESF EAGGF FISHERIES EX'L551 TOTAL
French IMPs 233.97 122.04 140.46 7.60 339.48 843.55
Greek IMPs 810.04 100.16 280.97 1.02 807.80 1999.99
Italian IMPs 367.42 137.12 281.02 18.15 452.75 1256.46
TOTAL 1411.43 359.32 7Q~.45 26.77 1600.03 4100.00
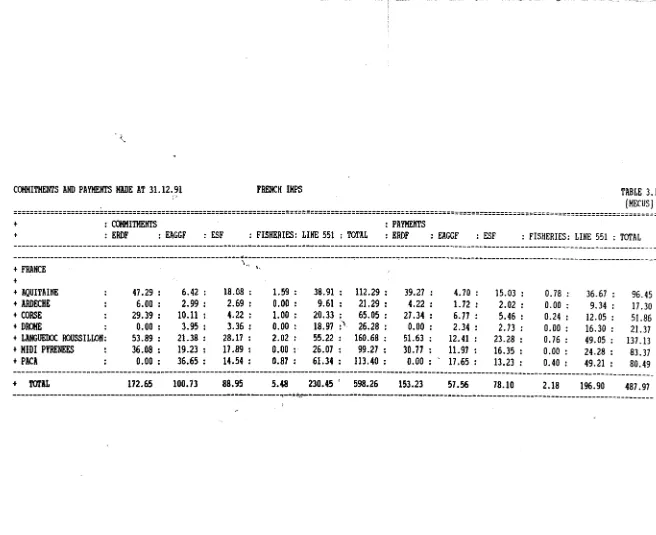
3. As In previous years, the collection of financial data for 1991 and 1992 was facilitated by the availability of a coordinated management ,system based on the recording of financial movements generated by the Implementation of the programmes. A summary of commitments and payments since the programmes began may be found
In the annexed tables 3.1. to 4.3.
At 31 December 1991 the accumulated budgetary assistance envisaged In the financial plans current at that date, In comparison to actual convnltments and payments', was as follows:
Programmed Commitments Payments %
t.fECUS t.cECUS t.cECUS 2/1 3/1 3/2
(1) (2) (3) (4) (5) (6)
French lt.cPs 702.67 598.26 487.97 85 69 82
Greek lt.cPs 1704.42 1630.90 1367.25 96 80 84
Ita 1 ian lt.fPs 776.63 535.52 219.82 69 28 41
TOTAL 3183.72 2764.68 2075.04 87 65 75
The following table shows commitments and payments effected at 31
December 1992 against the final Commu~ity assistance allocated, that is, the accumulated assistance programmed in the financial plans to that date:
Programmed Commitments Payments %
t.fECUS t.cECUS t.fECUS 2/1 3/1 3/2
(1) (2) (3) (4) (5) (6)
•'
French lt.cPs 843,54 752,76 644,45 89 76 86
Greek lt.cPs 2000,00 1941.55 1783.20 97 89 92
1 tal ian lt.cPs 1256,46 759,47 425,46 60 34 56
.
TOTAL 4100,00: 3453.78 2853.11 84 70 83
,
4. At 31 December 1991 the breakdown of take-up by source of Community finance was as follows (detai Is by programme are shown at tables 5.1 to 5.3 in the annexes).
EX L551 EAGGF ERDF ESF FISHERIES TOTAL
Comm i tment s as % of planned expenditure
French lt.4Ps 91 79 84 81 81 . 85
Greek lt.4Ps 100 73 100 94 58 96
Ita I ian lt.4Ps 75 79 58 57 66 69
TOTAL 93 76 89 78 70 87
Payments as % of commitments
French lt.4Ps 85 57 89 88 33 82
Greek lt.4Ps 78 99 86 77 32 84
Ita I ian lt.4Ps 45 34 40 53 f"" 5 . .,., 41
TOTAL 73 67 81 76 19 r-'I 75
. '
--The comparable table for the position at 31 December 1992 is shown below (detai Is by programme at tables 6.1 to 6.3 of the annexes).
EX L551 EAGGF ERDF ESF FISHERIES TOTAL
Commitments as % of planned expenditure
French IMPs 95 76 96 76 77 89
Greek IMPs 100 81 100 95 137 97
I tal ian IMPs 62 66 62 38 58 60
TOTAL 88 74 89- 67 67 84
Payments as % of comml tments
French IMPs 88 70 88 91 56 86
Greek IMPs 88 97 96 74 35 92
I tal ian IMPs 73 37 54 52 3 56
/"'
TOTAL 85 70 87 76 23 83
'
'--:;i
5. Uti I isation since 1985 of the additional budg~t 1 ine specifically dedicated to the IMPs has been as follows:
Budget line 2-801 (formerly 551)- article 11 of Regulation (EEC)N"
2088/85.
AVAILABLE IMPLEMrTAT ION.
(MECUS) (MECUS) %
Commitment appropriations
1985 120
-
"-1986 330 15.5 5
1987 350.8 187.5 54
1988 270.8 ( 1 ) 265.8 98
1989 250 111 . 0 44
1990 340 225.3 66
1991 330 300.1 91
1992 494.7 (2) 308.3 62
Payment appropriations
1·
1985
-
-
-1986 118 7.6 .6
1987 178.1 103.9 58.3
1988 148. 7. (3) 148.6 99,!,9
1989 252 79.7 31.6
1990 299.7 (4) 190.8 63.7
1991 285 ~
281.7 98.8
1992 391 (5) '-- 390.9 100
(1) Including 130 Mecus in the 1988 Budget and 140.8 Mecus carried over from 1987.
(2) Including 465 Mecus in the 1992 Budget and 29.7 Mecus carried over from 1991.
(3} Including 70 Mecus in the 1988 Budget, 11 Mecus transferred from Articles 5SO and 552, and 67.7 Mecus carried over from 1987.
(4) Including 300 Mecus in the 1990 Budget, less 300.000 Ecus transferred to Article 550.
6. The take-up rates of the additional 1 lne in 1991 and 1992 were a considerable improvement on previous years. In relation to the total 1.6 bi I I ion Ecus envisaged In Regulation N" 2088/85,
commitments and payments in 1991 amounted to 18.8% and 17.6%
respectively and at year end accumulated commitments and.payments had reached 69.1% and 50.8% respectively. In 1992 commitments were 19,3% and payments 24,4% of the total with cumulative commitments and payments of 88,4% and 75,2% respectively. However, this fe II short of the 100% commitment I eve I which was planned for the final year of the programmes. At the end of 1992
one French programme (Aquitaine) and 12 in Italy had not yet committed their final tranche of additional I ine funds. Under Community financial rules, unused commitment credits can be carried forward to the following year and in this ciase the unused
186,4 Mecus was made available for commitment in 1993. These
problems were essential IY the legacy of delays in the early stages of the I tal ian programmes >which distorted the subsequent expenditure profile of the IMPs as a whole.
B. Uti I isation of EIB loans
1. Ful 1 utilisation of the 2.5 bill ion Ecus In loans (Article 10(2)
of Regulation CEEC) N" 2088/85) deper:'ds on demand by operators for investments in the programmes which are eligible under the EIB criteria. In close collaboration with the Commission, the EIB wi II continue to do all it can to implement the above-mentioned Regulation.
2. During the years 1991 and 1992 the Improved uptake of EIB loans, observed si~ce 1989, was reinforced in Italy and Greece. In contrast the Bank.~eceived no requests for loans to be directly
included in the-.. French IMP programmes. The· reasons for the 1 im i ted uti 1 i sat ion of loans have a 1 ready been indicated in previous reports: the I imited nature of genuine loan opportunities; the smal I scale and very scattered nature of most
investments; the indebtedness of some regions or their desire to reduce debt; administrative delays; difficulties encountered by 'promoters in meeting the conditions and rules for presentation of
3.
4.
5.
It should, however, be noted that during the year 1991, 31% of EIB financing in the IMP areas corresponded to their objectives without necessarily being Included in those programmes. In 1992 the corresponding figure .was 23%. In fact, the EIB has financed more projects contributing to the general objectives of the IMPs
but which do not necessarly fit the fr.amework of specific
programmes, often for budgetary reasons. Thus, EIB activity in
favour of regional development in regions wholly or partly
eligible under the IMPs (NUTS level Ill) reached 3440,1 mecus in 1992, including 2225 mecus In contributions to the financing of investment proJects in IMP zones strictly defined. Of the latter amount, 815.1 mecus were In line with IMP objectives, without being included in the IMP programmes.
The EIB has taken note of the financing plans. for 1989-1993. The amount not committed or still available during the .first phase
has permitted the EIB to continue its participation through
loans in the financing of the planned. new acti~itLes. The readiness of the EIB to do so is regularly reemphasised to the
Presidents of the Monitoring Committees who keep in close
contract with the EIB to identify po.ssl.b.le. loan requests, particularly in France.
The following table shows EIB interventions by IMP during 1991
and 1992: ~·
,
Estimated Loans Loans Loans loans in (m ECU) (m ECU) (m ECU)
program. 1986 1991 1992
(m Ecu) - 1990
French IMPs
Aqul ta lne 30, 2,2
Midi-Pyrenees 40 15,4
Languedoc-Rouss Ilion 30
PACA 55 135,5
Corsica 10
Dr~me 7,5
Ardeche 7,5
TOTAL 180, 153,1
Greek IMPs
Attica 30 3,9 1,4 105,0
J
Central and
I I
i eastern Greece 30 10,8 6,6 23,3
Information 5 0,1
Technology
"r
Northern Gr,eece 55 i, 10,1 7.1 3,6
Western Greece 50 5,5
Crete 60 36,7 12,0 12,4
Aegean Islands 24 ',7 ,8 6,3
TOTAL 254 ' 74,9 27,1 150,6
Italian IMPs ,:
.
,.
Umbria 40
Tuscany 70 2,8. 9,6 1,9
Liguria 20
Em I I 1 a-Romagna 15 7,1 1, 7 0,6
Marche 90 84,8 78,2 36,6
Northern Adriatic
.
.lagoons 35
Lazio 40 24,7 10.1 5,3
Abruzzo 85 28,5 12,3 40,3
Mollse 30 23,2 7.1 6.1
Apulia 60 15,7 7,9 12.1
Campania 47 15,0 11,7 7,4
Bas I IIcata 35 20,4 11.1 19,6
Calabria 25 6,4 1 • 1 '. 2,1
SicilY 35 6,4 3,2 0,6
Sardinia 80 87,0 26,1 21 ,2
TOTAL 707 322,0 180,1 153,8
Ill ACTIVITY IN 1991 and 1992
A. Progress of the programmes
A.1. Progress of the French IMPs
1. Activity in the French programmes maintained a satisfactory rhythm in 1991 as was shown by the outcome of the examination of programme finances. AI I the French programmes were considered to be progressing sufficiently satisfactorily to Justify an increase in Community credits in conformity with Mr Millan's initiative described in the previous report. The Commission decided on 31 July to allocate 60 Mecus from the additional I ine ex-551 from the non allocated resource,to the French programmes on a collective basis with the conseQuent attribution of this sum to Individual programmes being effected in a series of formal Decisions. Negotiations with the French authorities continued through the rest of the year in the hope of securing agreement on the detailed changes to the programmes bY the end of 1991. in fact only three Decisions were issued in,,December (Corse, Drome and Ardeche). At the beginning of March 1992 t~e Decisions relating to the revisions of the remaining four programmes were
Issued.
2. In the course of 1992 the authorities in several French regions reQuested that unused EAGGF and ESF credits should be mobilised to benefit EROF actions. This' reQuest was made taking into account the successful implemen-tation of the French IMPs and the possibll ity of using these credits to finance more actions as identified by each IMP Monitoring Committee before the end of 1992.
3. In 1992 the French national Cour des Comptes published a report on the financial procedures related to the implementation of the IMPs. Though cr it i ca I on a range of Issues, it shou I d be noted that the report was based on an examination of the IMPs during an earlier period and that many of the shortcomings noted had been previousiY'recognised and improved procedures introduced.
A.2. Progress of the Italian IMPs
1. Like the French programmes, the Italian regions also shared in the final allocation of the remainder of Community credits available under Regulation (EEC)2088/85. Commissioner Millan's letter of December 1990 also requested details from the Italian authorities of expenditure on the IMPs unti 1 31 March 1991. The provision of this data in summer 1991 permitted an examination of the state of progress in the Italian programmes which, as has been described in previous reports, showed a disparity between the Mezzogiorno, where initiation had been delayed, and the Centre-North, where more progress had been achieved. Pr lor to 1991, only two programmes, Toscana and Emilia Romagna, had been subject to second phase decisions.
2. The examination of progress revealed three broad classifications of programmes:
(a) those probably capable of absorbing additional credits and which had made reQuests for such credits. Implementation of the programmes had been in I inerwith plans. Examples were Emi 1 ia-Romagna, Toscana, Umbria, Abruzzo and Molise.
(b) those programmes where the pace of impementat ion had been I ess satisfactory but which could be completed within the timescale,
if there was an acceleration of expenditure. With a steadily maintained acceleration, the absorption of additional credits, on a lesser scale than:in the first case, would be possible.
'
--(c) those programmes which had experienced a considerable slippage (e.g. Lazio, Campania, Liguria, Puglia and Sicilia). For some of these it seemed questionable that their credits would be fully utilised. However a few programmes in this category were showing signs of rapid acceleration and might be recategorised in class
''
,,
I
3. It was eventually decided that only three programmes should be retained in category (c)- Campania, Puglia and Liguria. AI 1 the other programmes were allocated additional credits from the outstanding reserve but the amounts varied, depending on previous experience in implementation and the anticipated capacity for further absorption. In total these 12 programmes received additional credits of 197.75 Mecus. In the cases of Puglia and Liguria credits remained frozen at the levels set in the first phase decisions. Because of the particularly unsatisfactory state of advance in Campania, the credits allocated in the first phase decision were actually reduced, by 1 Mecu of L551 funding and 3.5 Mecus from ERDF. This was the first tIme that Community credits to an operational programme had been reduced on grounds of unsatisfactory implementation. The net effect of all financial adjustments to the Italian programmes was an increase in Community credits of 193.25 Mecus. Togethe~ with additional changes in the planned expenditure by the Ita I ian authorities and the private sector, the global cost of the 15 programmes
increased by 435 Mecus to 3288.6 Mecus.
Additional Community resources allocated to Italian IMPs.
December 1991.
'
,,
Programme L 551 FEOGA FEDER FSE PECHE. TOTAL
•'
Abruzzo 5.20 2.00 10.80 6.00
-
' 24.00Acquaco I tur a 3.00
-
-
1.00 3.40'\\ 7.40Basi 1 icata 8.00
-
13.00 6.00-
-27.00Calabria 7.50
-
.
15.30 4.00-
1.45 25.35Campania - 1.00
-
-
3.50-
-
- 4.50Em i I i a-Rom. 4.00 3.00
-
4.00-
11.00Lazio 6.00 5.00 ,-4.70 2.00
-
17.70Liguria
-
-
-
-
-
-Marche 11.00 5.00 3.00 3.00
-
22.00Mol ise 6.00 2.00 5.50 2.00
-
15.50Pug I ia
-
-
-
-
-
-Sardegna 3.00
-
11.00 15.00 2.00-
9.00Sici I ia - 1.50 '
..
-
0.40 3.60 4.00-
1.20 4.50Toscana 7.00 1.00 3.30 2.00
-
13.30Umbria 12.00 6.00 1.00 2.00
-
21.00TOTAL eo ' 70.20 12.60 71.70 38.00 0.75 193.25
I I
4. The financial adjustments out I ined above were effected in a series of Commission Decisions made on 16 December 1991. In all cases the financial plans for annual expenditure were adjusted to take account of the actual progress to date on the ground. The opportunity was also taken to apply the provisions on financial implementation in Regulation CEEC)N"4253/88 to those IMPs which had not previously benefited from this technical amendment (i.e. all Italian programmes except Toscana and Emilia-Romagna).Thus the Italian financial procedures were brought into line with those for Greece and France.
5. Though a nat iona I support structure for the Ita I ian programmes had commenced its work in Apri I 1990, administrative problems and the clarification of its relations with the regions meant that it was only able fully to pursue it's programme of activities from January 1991. 1 n the course of 1991, among other activities. the
support structure organised seminars on financial engineering, regimes of assistance and evaluation. A further national seminar on evaluation was held in 1992. The support structure was also closely involved in collaboration with the Ministry of Treasury in the improvement of the computerised monitoring system for the programmes, the provision of technical assistance and in the training of operators of th~-system.
', r
A.3. Progress of the Greek IMPs
1. The improved absorption of Community appropriations in Greece is indicated in the statistical annexes. By the end of 1990 a I I the Greek programmes had received their second phase allocations and 1992.82 Mecus had been attributed. Thus only a min lma I amount of s I i ght I y over 7 Mecus remained to be allocated in future modifying decisions.
2. This fine-tuning of the programmes was effected in a series of 6 decisions adopted by the Commission in February 1992 and which increased the allocations to some programmes and reduced those to others. Community assistance was increased for the Attica and Northern Greece programmes. In the case of Attica an additional 37.13 Mecus was awarded, largely consisting of a new ERDF contribution of 32.42 Mecus. 4.36 Mecus from the additional line ex-551 was also awarded with minor adjustments to the ESF and EAGGF contributions. In the Northern Greece programme, the Community contribution was increased by 21.95 Mecus. This Increase was largely accounted for by an .extra 13.14 Mecus in EAGGF assistance and 9.39 Mecus from the add it iona I I i ne ex-551. The programme which underwent the largest reduction in Community assistance was Western Greece and the Peloponese where the level of overall aid was reduced by 36.55 Mecus including 22.84 Mecus in ERDF and 10.22 in additional line ex-551 assistance. Programmes for Crete, Eastern and Central Greece, and the Aegean Islands were also subject to adjustments on a smaller scale which reduced the overal I level of Community assistance.
3. These downward adjustments,should not be regarded in the same I ight as the act ion taken in 1991 in the case of underperforming I tal ian programmes. Uptake of Community assistance in Greece had been exemplary. However, the original regulation had set an upper limit on the extent of this assistance and, in the latter stages of the programmes, decisions, had to.be made about the most effective uti I isation of ald. These decisions were made in the I ight of the achievements of the programmes and the scope for further productive interventions. In some cases ESF commitment appropriations may be slightly different from those appearing
141
4. One significant development in the administration of the Greek IMPs in 1991 was the establishment of a suooort structure similar to those previously existing in France and Italy. The purpose of this agency was to consider on an interregional level issues common to the regional programmes, including the IMPs. The operation would assist the efforts of public and private operators involved in the programmes through the organisation of working groups and meetings for the dissemination of information, the exchange of experience and the finding of common solutions. A series of interventions relevant to specific themes was to be initiated using experts in the field. A Commission decision of 2 May 1991 established the support structure. The Greek structure was involved, not only in the IMPs, but also in the new Greek regional plurifund operational programmes adopted after the reform of the Structural ~unds and especially in the management and evaluation of the programmes.
B. Common activities and studies
In the context of technical assistance a number of studies were completed in 1991-1992.
~"''
8.1. AnalYsis of national financial orocedures
1. In 1990 the Commission reQuested a study of financial procedures in the three countries to analyse the ways in which Community funds reached final beneficiaries. This was partly ·In re;;ponse to complaints raised on occasion in MonItoring Commit tees about de I ays in the process. Expert consultants ·rn each of the three countries were entrusted with this analysis. The study was finalised in the early part of 1991.
2. The analysis of Greek procedures found that the Ministry of Frnance and the Ministry of National Economy were both involved in the financial implementation of the programmes. Community funds were received in the Commission's account at the Centra I Bank and were then transferred direct I y to a special Greek state account for budgetary receipts. At the time of the study direct payments were i ncr.eas i ng I y being made to final beneficiaries by the Bank of Greece on the
3. In France Community ERDF allocations were assigned to the Ministry of the Interior budget as supplementary credits through the "assistance fund" procedure. Thereafter, these were treated as national funds. It was anticipated that in the near future the same procedure would be adopted for EAGGF assistance with Community funds being allocated to the budget of the Ministry of Agriculture, and for ESF assistance in relation to the Ministry of Labour or other competent agencies.
4. In Italy the procedures for disbursement of Community funds had to be viewed against the background of financial relations between central and regional government. The regional authorities have the responsibi 1 ity for programme management and for payments to beneficiaries. However, they also have only I imited authority in decidiryg the allocation of financial resources and 90 % of their budgets is derived from central government. A "rotation fund for Community policies" was established by national law 183/87 with the. objective of transferring Community funds to the regions and other agencies, and ensuring national cofinancement. After a~
initial period when certain problems were experienced, the fund seems at present to be operating as intended.
5. Detailed comparative analysis of these studhes generated several suggestions for improvements in procedures at national and Commission level. This exercise contributed to ongoing work on the wider question of financial procedures in the context of the post 1989 reform of structura 1 funds, which raised the Important issues of transparency and add i t ion a 1 I t y .
8.2. Analysis of national admlnlstratlve procedures
1. Following the analyses carried out on financial procedures, a study was initiated on national administrative procedures, again involving separate exercises conducted at national level in' France, Italy and Greece. The study had a wider scope than the IMPs alone, as it included mult ifund programmes initiated after the reform of structural funds in
2. The analysis of the French procedures noted that the experience of those regions with IMPs had marked their subsequent approach to operational programmes under the reform of the structural funds with a stronger commitment to partnership. Though there are variations in practice, depending on the number of partners involved in a programme, these are essentialy two phases In the selection procedure for IMP assistance in France- a technical preparatory phase and, on the political level, the phase of programmation. In the case of the IMPs these phases involved the partnership of national and regional authorities. Possible improvements to procedures suggested by the national study, particularly with a view to reducing delays in selecting and integrating projects in the programmes, included the clarification of procedures in relation to project operators, the devolution of project administration to the level closest to the operators, and improved training for the administrators involved. The latter should identify potential beneficiaries and initiate studies on the socio-economic impact of the programmes.
3. For the Greek IMPs, the pattern was one of greater centra 1
government responsibi I ity for the administration of the programmes. For i nterveRt ions cof i nanced by ERDF, the Ministry of National Economy (MNE) is the principal operator. In recent years, however, government pol icy has favoured greater private sector involvement in programmes. A law of 1990 encouraged private sector participation in productive investment projects and a presidential decree of Apr i I 1992 permits the delegation of management tasks in Community programmes to intermediary agencies. The responsible ministry for i ntervent i.6ns co-financed by ESF is I ess direct 1 y
4. The Greek study identified a number of problems which remained in the administration of integrated programmes, some deriving from the inadequacy of existing procedures, others from a failure to use them fully. Suggestions for improvements included : greater use of technical assistance funding at a II stages of programme implementation strengthening of public administration structures, centrally and regionally, through improved management training, technical support and information processing better coordination between the three ministries administering Community funding ; and experimental pi lot projects involving the decentralisation of responslbl lities.
5. The administrative procedures for programmes in Italy were characterised by considerable complexity and the involvement of several regional agencies. It was difficult' to generalise about Italian arrangements as procedures differed between IMPs and post 1989 ope rat iona 1 programmes, and between the Mezzogiorno regions and those in the Centre-North. For the IMPs, the regional administrations played a clear leading role. Certain regions invited local public and private agencies to propose interventions and then used these responses as the basis for draft programmes which were transmitted to the national authorities f·or negotiation with the Commission. This process tended to produce a fiir ly rigid programme with clearly identified measures, usually correlated with the plans of operators on the ground. With the programme contract signed, work continued on the technical preparation of the programme. In the case of other IMPs (as with the new operat iona 1 programmes), the
timescales, criteria and selection procedures for private projects were defined by the regional authorities after the adoption of the programmes. Whichever approach was adopted, timescales were often regrettably long both for the preparation of programmes and the application of Community funds. However, new national laws and procedures on Community interventions envisage the shortening of timescales. Other possible improvements to procedures identified in the I tal ian study included : improved information on programmes for the benefit of local administrations and the public ; improved training for officials ; allocation of technical assistance finance to progfamme operators studies to be made of
programm~ procedures as wei I as content and improved
20
-6. Comparison of the three studies revealed certain suggestions for improvements which recurred in each country, such as more information for beneficiaries and the strenghtening of public administration through training and technical assistance. The
benefits of effective monitoring committees and
decentralisation were also common themes. The function of the IMPs as precursors of the reformed operational programmes was also hlghl ighted. The experience of the latter wi I I, in turn, inform the programmat ion of structural interventions for the period 1994-99.
IV PHYSICAL PROGRESS OF PROGRAMMES
PRa;RESS OF IMP PRffiRJ\HHES - SUMMARY OF RESULTS TO END OF 1991
:FRAKCE :GREECE :ITALY
PHYSICAL INDICATORS :AQUITAIH:ARDEC:DROHE:LANGU :MIDIP PACA :ATTI :CRET :CENT :.t«>RD :GOP :IKE :ABRU :EMIL :LIGU :UHBR
..
1 :PRIMARY SECTOR
1.1 :AGRICULTURAL CHANGE
1.1.1
:-nllllber of ha converted :
20 : § : § : X : 9378 : X 0 105 : 363 : 5400 : 4218 : 8000 : 10 : §: § : § : 522 :
0
:to neM production
: 0 : : : : 00 0
1.1.2
:-number of ha improved
: § : § : X : § : 313 : X : X : 9487 : 2340 : 5696 : 6500 : § : 1326 : X : 645 : 2544 :: 0 0 : 0 : 0 : 0
0 0 • 0 0 0
1.1.3
:-nllllber animals treated
:2581910 : X : § : X :319593 :120000 :129619 : X :1046850 :1507966 :1000000 : X : X : X : X :455582 :1. 2 :FORESTRY : : : \:
....
0 : 00 0
1.2.1
:-nllllber of
haplanted
: 425 : 924 :1377 : 6979 : § : 6000 : 3460 : X 0 2184 : 7551 : 1100 : X : 150 :1261 : 386 : 1668 : 00 : 0 0 0 : 0 0 0 0 0 0
1.2.2 :-km
of forest roads
:s
: 103 : 87 : 494 : 305 : 1200 : 8o92 : 4o25 : 416 : 2122 : X : X : X : 75 : 26 : 340 ::laid or improved
: 0 : 0 0 0 : 0 : 0 : 0 : : : 0 :r
0 0
.
.
0.
.
.
'i 0 0 : :
: :
.
.
: :r
.
.
. .
1.2.3
: -nllllber of ha improved
.
.
3539 : 431 : 323 : 8351 : § : 8000 : 549 : 321 : 525 : 13140 : 500 : 25 : 991 :6134 :1535 : 5030 :: 0
.
:.
.
:.
.
: :.
.
1.2.4
:-number of ha protected :
§ : 800 :6875 :42800 : § :105000 : 3971 : 5657 : 6263, : 28535 : 22000 :16620 : 100 :2888 : 169 : 272 ::against fire
1.3 :Ptn:ESSIHG AliD
:MARKE'l'IHG eN
:AGRICULl'URAL PRODUCE
.
.
: : ~.
1.3o1
:-number of firms
: 21 : 31 : 15 : X : 30 : 7 : § : 11: §.
.
1 : 1 : X : 3 : 2 : 9 : §:assisted
1. 3.2
:-number of marketing
: X : § : § : X : § : § : § : § : § : § : § : X : 12 : § : 2 : 23 ::initiatives
-1. 4 : IRRIGATIOK
1.4.1 :-km
of irrigation network:
X : 144 : 36 : X : X : X : X.
.
458 : X : X.
.
X : 375 : § : X : X : §:laid or improved
PRO;RESS OF IMP PRO;RAMMES - SIIMHARY OF RESULTS TO END OF 1991
:FRANCE :GREECE :ITALY
PHYSICAL INDICATORS :AQUITAIH:ARDEC:DROHE:LANGU :MIDIP PACA :ATTI :CRET :CENT :lVRD :GOP :IKE :ABRU :EMIL :LIGU :UMBR
1. 5 :SOCIQ-STRUCTURAL J.
:INITIATIVES : : : : : : ; ; ; : : : : : :
.
1.5.1
:-number of agricultural
..
427~ : 591 : 330 : 622 : 1309 : 7000 : 42 : X.
.
§.
.
627 : 19 : X : 799 : 130 : § : 150 ::undertakings assisted
1. 6 :FISHERIES :
1.6.1
:-number of
fis~ingboats :
'j : § : § : 37 : § : 5 : §.
.
§.
.
§ : 12 : § : § : § : § : § : §:constructed
: : : : :
1.6.2
:-number of aquaculture
: X· : § : § : 7 :· § : 14 : 10 : § : X.
.
§ : 10 : § : § : § : § : §:businesses assisted
.
.
: : :.
:.
'...
1.6.3
:-nllllber of fish
: 30 : § : § : X h: § : 21 : § : §.
.
§ : § : §.
.
§ : § : § : § : §:processing and marketing :
:businesses assisted
: : : : :: : :
.
.
:.
.
.
.
.
.
.
.
: : : : : : : :rv
w
2 :SHEs AND 'I'ECHlfOUXiiCAL
:DEVEIDPHE!ft'
2.1 :ASSISTANCE TO SHEs
:-number of
SHEsassisted :
..
2.1.1 148 : X : X : X : 84 : X _ : '6205 :
~·' - 606 : 1156 : 80 : 750 : 640 : 6 : X : 8 : §
2.2 :RESEARCH CENTRES : : :
.
.
: : : :.
.
: : :2.2.1
:-number of centres
: 9 : § : X : X.
.
5 : 15 : 8 : X : 7 : 5 : 82 : 0 : § : § : § : 2 ::established or assisted
2.2.2
:-area of buildings
: 3710 : § : § : X : 2130 : X : 20000 : X : X : § : § : 0 : § : § : § : XPHYSICAL INDICA'IURS :AQUITAIN:ARDEC:DBOKE:LAHGU :HIDIP PACA :A'l"l'I :CRET :CENT :OORD :GOP :IKE :ABRU :EMIL :LIGU :UMBR
2.3 :FIKAHCIIL ENGINEERING : ; ; i
..
2.3.1
:-number of initiatives
: ·1 : § : § : X : X : 1 : X : 17: 53 : X : § : 11 : X : 1 : 2 : §:laiDiched
: : : : : ; : : :
2.3.2
:-number of businesses
: 40 : 128 : § : X :- X : 20 : X ; 61 : 53 : 26 : 12 ; 6 : X : X : X : 0 ::assisted
.
2.4 :BUSINESS CENTRES ; : : : H
...
:
2.4.1
:-number of offices/
: § : 79 : X : § : §.
.
16 : 14 : X : 5 : §.
.
6 : 6 : 48 : 3 : 6 : 79 ::centres/zones established:
:or assisted
2.5 :NEW TECROOUXIY :
.
.
: : :.
.
:.,
2.5.1
:-number of initiatives
: X : 20 : X : X 13: X : X : 10 : 30 : 26 : 82 : 0 : X : § : § : §:taken
.
.
:. .
. .
: :.
. .
.
:.
.
.
.
.
.
: : : : : (""-'-3 :rouRISM '·'
3.1 :ACCOHHODATION
3.1.1
:-number of new/upgraded :
790 : 306 : 3~0 : X : 4658 : X : 90 : X : 558 : 1028 : X : X : 1890 : X : 32 : 1020 ::beds
: : : :
.
.
: :.
.
:.
.
3.1.2
:-number of hotels, camps,:
177 : 1 : 10 : 81 : 112 : 260 : 9 : 73: 17 : 49 : 14 : X : 55 : 5 : X : 31 :PRO:iRFSS OF IMP PRO:iRAMMES - SUMMARY OF RFSULTS ro END OF 1991
:FRANCE :GREECE :ITALY
PHYSICAL INDICAroRS :AQUITAIN:ARDEC:DROHE:LANGU :HIDIP PACA : AT'l'I :CRET :CENT :OORD :GOP :IHE :ABRU :EMIL :LIGU :UMBR
3. 2 :roURIST
:INFRASTRUCTURE : : : : : : :
.
.
..
3.2.1
:-number of tourist
and : 111 : 9 : 14 : 246 : 12 : 120 : X.
.
77: 3 : 21 : 9 : 16 : 4 : 16 : 9 : §:cultural attractions
:enhanced
:
3.2.2
:-number of tourist
: X.
.
1 : 1 : 3 : 16 : X : ·. § : § : 1 : § : § : § : 1 : 8 : 17::itineraries enhanced
3.2.3
:-number of recreational :
§ : § : 4 : 2 : • 14 : 26 : § : 6 : § : §.
.
1 : § : § : § : 1 : §:water facilities equipped:
3.2.4
:-number of marinas
: § : § : § : '.,0 :..
§.
.
§.
.
1 : 5 : 1 : 2 : 4 : 0 : § : § : § : §:equipped
3.2.5
:-number of sporting
.
.
59 : 4 : 1 : 9 : §.
.
27 : §.
.
1 : 1 : § : 5 : § : 8 : 4 : 7 : §:centres equipped
.
.
: : : : : : : : :.
.
: : : : : : 1'-'v,
4 : INFRASTRUC!URE
4 .1 : 'l'RAHSPQR'l'
4.1.1 :-kill
of
roadconstructed/ :
152 : 20 : X : X : X : 12 : tQ.2 : 648 : 586 : 3006 : 650 : 84 : 43 : § : X : 60.8 ::Improved
: : :. .
. .
., :.
,,_. .. , _:.: --:-·
..
:.:::~- : :
.
: :;
.
4.1.2
:-number of ports
: § : § : §.
..
0 : § : § : 2 : 3 : 6 : 4 : 15 : 19 : § : § : § : §:improved
: :.
.
~~ :4.1.3
:-number of airports
: § : § : §.
.
3 : § : § : § : 2 : § : 1 : 4 : 2 : § : § : §:improved
4.1.4
:-number of-freight
: § : X : X : X.
.
§ : § : § : § : 1 : § : § : § : § : § : § : §:transfer facilities
:established or improved
PRCXIRESS OF IMP PRCXIRAHHES - SUMMARY OF RESULTS TO END OF 1991
:FRANCE :GREECE :ITALY
PHYSICAL INDICATORS i :AQUITAIN:ARDEC:DROHE:LANGU :HIDIP PACA :ATTI :CRE'l' :CENT :OORD :GOP :IHE :ABRU :EMIL :LIGU :UHBR
4.2 :PUBLIC UTILITIES :
..
4.2.1 :-km
of water supply
: X : 16 : 76 : X : X.
.
140 : 54 : 54 : 293 : 52 : 20 : X : 8 : § : 6 : 65.9 ::network laid/improved
: -.,.
.
4.2.2 :-km
of sewerage,network :
§ : § : § : § : X : 50 : §.
.
96: 99 : . 15 : 45 : X : § : § : 3 : §:laid/improved
: : : : : :
.
: : : :.
:-km
of gas supply network:
: § X § § §4.2.3 § : § : § : : : §
.
.
§ : : : § : § : § : § : § : 63 ::constructed
.
'
.
4.2.4 :-km
of electricity cable :
: § : §.
., ~
X 60 : X X 1109 : 1 : 85 : X
§ : X :
.
.
:.
.
: § : § : § : §:installed
5 :TRAINING :;...:..
f
~
5.1 :VOCATIONAL TRAINING : : : : : : : : : : : : : : : : : <>\.
5.1.1
:-nllllher of persons
: 14280 :1222 : X : X : 6854 : 18624 : 11891 : 1582 : 29248 : ,7000 : 15000 : 3216 : 1072 : X : X : 1599 ::trained
:
.
.
: : :.
.
: \"~5.1.2
:-mnber of long tern
: X : 250 : X : X : X : X.
.
X : X : X : X : § : X : § : X : X : §:unemployed trained
: : : : :
.
.
: : : : :..
5.1.3
:-number of training
.
.
X : 45 : X ·: X : 210 : 1369 : 521 : 65 : 600 : 90 : 28 : 130 : 49 : 20 : 19 : 89 ::courses
: : : :
.
.
:.
.
:.
.
5.1.4
:-hours of training
: X : X : X : X : 84000 :180321 : 300 : 1876 : 223478 : X : X :22000 :21560 : X : X : X:
.
.
: : : : : : : :5.1.5
:-number of fims
: X : 10 : X : X : X : X : X : X : X : X : § : X : X : X : X : §:benefitting
-X =
details not available
§ =
not relevant to this
*
*
*
*
*
*
IHP
TOTAL :EXPENDITURE:
COMMUNITY· ASSISTANCE
: TOl'AL : LINE 551 : EIIGGF ERDF
*
"
: NATIONAL : PRIVATE
*
ESF :FISHERIES : PUBLIC : FUNDI~«;*
(1) : FUNDING :
*
*
====================================================================================================================================
.
*
IIQUITIIINE : 564.83 : 163.37 : 55.27 : 16.72 : 68.00 : 20.73 : 2.65 : 200.36 : 201.10*
*
IIRDECRE : 116.00 : 28.41 : 12.63 : 3.73 : 7.90 : 4.15 : 0.00 : 43.07 : 44.53*
*
CORSE : 236.23 : 88.38 : ~2.7. 56 : 17.73 : 33.96 : 8.01 : 1.13 : 89.56 : 58.29*
'·
*
DlOtE : 156.16 : 36.06 : 25.55 : 5.47 : 0.00 : 5.04 : 0.00 : 68.30 : 51.80*
*
Llltii;UEOOC-ROUSSILWN : 694.29 : 211.40 : 74.96 : 24.97 : 77.13 : 33.00 : 1.34 : 308.60 : 174.29*
*
MIDI-PYRENEES
: 584.76 : 153.98 : 50.27 : 30.78 : 46.98 : 25.96 : 0.00 : 218.01 : 212.77*
*
PROVENCE-ALPES-COTED'AZUR
: 748.05 : 161.94 : 93.26 : 41.06 : 0.00 : 25.15 : 2.48 : 338.76 : 247.34*
====================================================================================================================================
'*
roTAL : 3100.32 : 843.54 : 339.50 : 140.46 : 233.'97 : 122.04 : 7.60 : 1266.66 : 990.12*
===============================================================~======================c=;===========================================
(!)Regulation (EEC) 4028/86 ·~<
-;t
[image:30.793.50.649.76.540.2]APPROVED COMMUNITY ASSISTANCE GREEK IMPS 1986/92 TABLE 1.2 (KECUS}
====================================================================================================================================
*
*
*
*
*
*
IMP
1.: TOTAL :EXPENDITURE:
COMMUNITY ASSISTANCE
TOTAL : LINE 551 : EAGGF ERDF
*
*
: NATIONAL : PRIVATE
*
ESF :FISHERIES : PUBLIC : FUNDING*
(1} : FUNDING :
*
*
==========================================~;=====================================~==================================================
*
ATTICA : 442.02 : 265.47 : 213.70 : 2.62 : 32.42 : 16.73 : 0.00 : 150.40 : 26.14*
*
CRETE : 497.55 : 247.12 : 104.11 : 40.68 : 99.00 : 3.33 : 0.00 : 109.15 : 141.27*
*
EASTERN AND CENTRAL GREECE : 574.84 : 335.46 : 90.54 ; 50.04 : 181.07 : 13.80 : 0.00 : 177.31 : 62.08*
*
I«>RTHERN GREECE : 824.23 : 496.65 : 180.21 : 88.67 : 193.01 : 34.76 : 0.00 : 247.18 : 80.40*
*
WESTERN GREECE & PELOPONESE : 562.03 : 339.58 : ?7.26 : 83.90 : 138.82 : 18.71 : 0.89 : 174.12 : 48.33 II*
AEGEAN ISLANDS : 412.17 : 226.97 : 69.2.~ : 15.06 : 139.13 : 3.45 : 0.13 : 117.88 : 67.33*
*
INFORMATION TECHtiOL(X;Y : 136.84 : 88.75 : 52.78 : 0.00 : 26.58 : 9.38 : 0.00 : 43.08 : 5.00*
====================================================================================================================================
*
TOTAL 3449.68: 2000.00: 807.80 : 280.97 : 810.03 : 100.16 : ·t.02 : 1019.12*
430.55*
========================================~===================;========;==============================================================
(l}Requlation (EEC} 4028/86
+>
) .... :.~ -'-- .- 71
i
r-J
[image:31.793.52.652.69.562.2]APPROVED COMMUNITY ASSISTANCE ITALIAN IMPS 1986/92 TABLE 1.3
(KECUS}
==========================1=========================================================================================================
*
: : COHMUHITY ASSISTANCE : :*
*
: rotAL : : :*
*
DIP :EXPENDITURE: : : : : : : NATIONAL : PRIVATE*
*
.
.
: rotAL : LINE 551 : EAGGF : ERDF : ESF :FISHERIES : PUBLIC : FUNDING*
*
: ·.· : : :.
.
.
.
: (1) : FUNDING :*
*
.
.
! ! ! ! !•
'
*
====================================================================================================================================
*
ABRUZZO.
.
177.93 : 79.40 : 16.12 : 15.05 : 36.94 : 11.29 : 0.00 : 77.93 : 20.60*
*
ACQUACOLTURA : 151.54 : 42.98 : 22."98 : 1.50 : 0.00 : 2.85 : 15.65 : 85.60 : 22.95*
*
BASILICATA : 221.21 : 93.49 : 20.04 : 20.55 : 41.07 : 11.83 : 0.00 : 93.91 : 33.81*
*
CALABRIA.
.
297.15 : 119,97 : ~n 37,77 : 12.43 : 55.86 : 13.90 : 0.00 : 113.43 : 63.76*
*
CAHPlNIA : 163.92 : 75.75 : 14.39 : 18.12 : 38.84 : 4.40 : 0.00 : 75.81 : 12.37*
*
EMILIA IK»fAGNA : 265.01 : 80.27 : 38.40 : 30.89 : 0.00 : 10.98 : 0.00 : 87.61 : 97.13*
*
LAZIO : 156.98 : 58.14 : 21.45 : 11.46 : 19.54 : 5.70 : 0.00 : 72.90 : 25.94*
*
LIGURIA : 141.81 : 52.13 : 30.83 : 15.30 : 0.00 : 5.99 : 0.00 : 56.34 : 33.35*
*
MARCH£ : 226.55 : 88.97 : 49.83 : 24.92 : 3.00 : 11.22 : 0.00 : 84.23 : 53.35*
*
tK>LISE.
.
123.84 : 58.56 : 14.35 : 14.79 : ',22.53 : 6.89 : 0.00 : 55.24 : 10.04*
*
PUGLIA : 223.43 : 99.96 : 20.46 : 15.31 : 54.25 : 8.20 : 1. 75 : 99.56 : 23.90*
*
SARDEGNA : 201.46 : 96.32 : 20.48 : 25.52 : 39.54 : 10.78 : 0.00 : 100.57 : 4.57*
*
SICILIA : 238.66 : 112.33 : 35.97 : 18.72 : 47.55 : 9.34 :'o.
75 : 113.94 : 12.39*
*
roscm
: 460.17 : 114.22 : 65.46 : 28.21 : 7.30 : 13.25 : 0.00 : 141.27 : 204.69*
*
UMBRIA : 238.93 : 83.97 : 44.23 : 28.25 : ; 1.00 : 10.50 : 0.00 : 103.01 : 51.95*
===================================================================================================================================*
*
TOTAL 3288.59 : 1256.46 : 452.76 : 281.02 : 367.42 : 137.12 : 18.15 : 1361.35 : 670.80*
===================================================~================================================================================
(!)Regulation (EEC) 4028/86
[image:32.793.51.658.118.446.2]PROGRAMMING - COMHITHENTS SCHEDULED AT 31.12.91 - FRENCH IMPS TABLE 2.1
{HECUS) =============================================~================================= +
+ : ERDF : EAGGF : • ~F :FISHERI~:LINE 551 :rot'AL
---!..---r~---
---+ FRANCE
+
+ AQUITAINE: 58.63 : 14.52 : 19.16 : 2.42 : 38.92 : 133.65 :
+ ARDECHE : 7.12 : 3.73 : 3.73 : 0.00 : 9~30 : 23.87 :
+ CORSE : 31.59 : 15.68 : 6.59 : 1.05 : 20.33 : 75.25 :
t DJOIE : 0.00 : 5.25 : 4.42 : 0.00 : 18.98 : 28.64 :
t LAlliUEOOC: 66.46 : 23.21 : 29.52 : 1.19 : 55.21 : 175.59 :
+ MIDI PYRE: 42.65 : 26.51 : 23.24 : 0.00 : 37.20 : 129.60 :
+ PACA
.
.
0.00 : 38.95 : 22.64 : 2.12 : 7~.36 : 136.06 :
---..;,~~~-~~"~_:"""!""~---+ roT IlL 206.45 127.85 ~ 109.30 ' 6.78 252.30 702,67
[image:33.794.88.660.58.535.2]'
~ ...
PR<X;RAHHING - COOIU'HENTS SCHEDULED A1' 31.12. 91 GREEK IMPS TABLE 2.2
{MECUS)
==============================================~================================
+
+ : ERDF : EAGGF : ESF
.
:FISHERIES:LINE 551 :TOTAL---~~---,,
---+ GREECE
+
+ An'ICA : 0.00 : 2.00 : 14.11 : 0.00 : 172.03 : 188.20 :
+ CRETE : 86.22 : 45.00 : 3.24 : 0.47 : 93.13 : 228.05 :
+ CENTRAL : 152.70 : 45.86 : 10.10 : 0.40 : 76.j7 : 285.44 :
+ NORrHERN : 169.47 : 71.14 : 28.57 ; 0.13 : 143.05 : 412.36 :
+ WEST/PEL : 143.69 : 75.83 : 15.40 : 1.28 : 91.68 : 327.88 :
+ AEGEAN IS: 122.66 : 11.96 : 3.21 : 0.13 : 58.14 : 196.10 :
+ IHF l'ECR : 20.17 : 0.00 : 7.30 : 0.00 : 38.92 : 66.39 :
+ TOTAL 694.91 251.79 82.00 2.t2 673.31 1704.42
(J-.l
[image:34.796.98.537.42.570.2]+
+ : ERDF : EAGGF : ESF :FISHERIES:LIHE 551 :TOl'AL
---+ ITALY
+
+ ABRUZZO : 23.11 : 7.50 :. 6.75 : 0.00 : 8.03 : 45.99 :
+ ACQUACULT: 0.00 : 0.90 : '.
1.71 :
9.41 : 13.82 : 25.84 :+ BASILICAT: 26.80 : 11.00 : 7.10 : 0.00 : 13.60 : 58.50 :
+ CALABRIA : 33.52 : 8.06 : 8.20 : 0.00 : 22.66 : 72.44 :
+ CAMPANIA : 24.35 : 11.37 : 2.76 : 0.00 : 9.02 : 47.49 :
+ EHILIARO: 0.00 : 23.83 : 8.47 : 0.00 : 29.62 : 61.91 :
+ LAZIO : 11.70 : 6.00 : 3.60 : 0.00 : 14.40 : 35.70 :
+ LIGURIA : 0.00 : 11.33 : 4.43 : 0.00 : 22.83 : 38.59 :
t MARCIE : 0.00 : 11.50 : 2.20 : 0.00 : 19.00 : 32.70 ;
t IDLISE
.
.
13.31 : 10.63 : 4.72 : 0.00 : 9.32 : 37.98 :t POOL lA : 32.35 : 14.56 : 6.50 : 0.87 : 12.20 : 66.47 :
t SARDEGNA : 25.68 : 16.54 : 6.53 : 0.00 : lD.60 : 59.34 :
t SICILIA : 28.42 : 18.72 : 5.61 -: .. O._QO J- 21.65 : 74.40 :
t
roocm :
5.49 : 17.82 : 8.69 :; . 0.00 : 39.32 : 71.32 :t HRIA
.
.
0.00 : 19.71 ·: 5.56 : 0.00 : 22.68 : 47.95:---t
rom
225.32 189.45 82.86 10.28 268.73 776.63---(JJ
[image:35.792.124.672.47.503.2]. -,~ ' ....
COOIITHENTS AND PAYMENTS HADE AT 31.12 •. 91 FRENCH IMPS TABLE 3.1
(HECUS)
============================================================================================================================================================
: COOIITHENTS : PAYMENTS
+
+ : ERDF : EAGGF : ESF : FISHERIES: LINE 551 : TOTAL : ERDF : EAGGF : ESF : FISHERIES: LINE 551 : TOTAL
---
---~---+ FRANCE } ... ,,
+
+ AQUITAINE : 47.29 : 6.42 : 18.08 : 1.59 : 38.91 : 112.29 : 39.27 : 4.70 : 15.03 : 0.78 : 36.67 : 96.45
+ ARDECHE : 6.00 : 2.99 : 2.69 : 0.00 : 9.61 : 21.29 : 4.22 : 1. 72 : 2.02 : 0.00 : 9.34 : 17.30
+ CORSE : 29.39 : 10.11 : 4.22 : 1.00 : 20.33 : 65.05 : 27.34 : 6.77 : 5.46 : 0.24 : 12.05 : 51.86
+ D!QfE : 0.00 : 3.95 : 3.36 : 0.00 : 18.97 :'!; 26.28 : 0.00 : 2.34 : 2.73 : 0.00 : 16.30 : 21.37
+ LANGUEOOC ROUSSILWN: 53.89 : 21.38 : 28.17 : 2.02 : 55.22 : 160.68 : 51.63 : 12.41 : 23.28 : 0.76 : 49.05 : 137.13
+ MIDI PYRENEES : 36.08 : 19.23 : 17.89 : 0.00 : 26.07 : 99.27 : 30.77 : 11.97 : 16.35 : 0.00 : 24.28 : 83.37
+ PACA : 0.00 : 36.65 : 14.54 : 0.87 : 61.34 : 113.40 : 0.00 : ' 17.65 : 13.23 : 0.40 : 49.21 : 80.49
---+ TO'J'AL 172.65 100.73 88.95 5.48 230.45 . 598.26 153.23 57.56 78.10 2.18 196.90 487.97
---~--~~~---~---v.l
[image:36.794.76.732.16.551.2]+ : ERDF : EAGGF : ESF : FISHERIES: LINE 551 : TOTAL : ERDF : EAGGF : ESF : FISHERIES: LINE 551 : TOTAL
---~---~---
---+ GREECE
.
+ ~
+ ATTICA : 0.00 : 2.19 : 16.05 : 0.00 : 172.03 : 190.27 : 0.00 : 2.19 : 13.45 : 0.00 : 136.93 : 152.57
+ CRETE : 86.22 : 28.45 : 2.76 : 0.40 : 93.13 : 210.96 : 84.32 : 27.39 : 1.82 : 0.00 : 79.82 : 193.35
+ EASTERN AND CENTRAL : 152.70 : 22.68 : 7.81 : 0.00 : 76.37 : 259.56 : 121.24 : 22.68 : 6.48 : 0.00 : 51.42 : 201.82
+ OORTHERN GREECE : 169.47 : 73.86 : 25.48 : 0.00 : 143.05 : 411.86 : 127.99 : 73.83 : 19.85 : 0.00 : 102.10 : 323.77
+ WESTERN & PELOPONESE: 143.69 : 47.08 : 13.39 : 1.00 : 91.68 : 296.84 : 131.19 : 46.61 : 10.29 : 0.45 : 65.72 : 254.26
+ AEGEAN ISLANDS : 122.66 : 9.60 : 3.11 : 0.00 : 58.14 : 193.51 : 116.96 : 9.60 : 2.04 : 0.00 : 52.68 : 181.28
+ INFORM. TECHHOUXJY : 20.17 : 0.00 : 8.81 : 0.00 : 38.92 : 67.90 : 18.58 : 0.00 : 5.58 : 0.00 : 36.04 : 60.20
---+ TOTAL 694.91 183.86 77.41 1.40 673.32 1630.90 600.28 182.30 59.51 0.45 524.71 1367.25
---~---,--:---;1.
w
[image:37.792.60.749.48.539.2]C<»>HU'HEIITS AIID PAYMENTS HADE
If.
31.12. 91 ITALIAN IMPS TABLE 3.3 (HECUS)============================================================================================================================================================
++
: C<»>Hit'HENTS
: ERDF : EAGGF : ESF
: PAYMENTS
: FISHERIES: LINE 551 : TOTAL : ERDF : EAGGF : ESF : FISHERIES: LINE 551 : TOTAL
---+ ITALIA +
+ ABRUZZO : 20.43 : 6.87 : 2.26 : 0.00 : 8.03 : 37.59 : 11.09 : 2.35 : 0.54 : 0.00 : 4.21 : 18.19 + ACQUlCULTURE : 0.00 : 0.00 : 1.25 : ~ 6.80 : 5.75 : 13.80 : 0.00 : 0.00 : 0.83 : 0.35 : 1.79 : 2.97 + B.SILICATA : 21.91 : 6.42 : 2.99 :
·-·
o~-oo:
13.60 : 44.92 : 5.36 : 1.52 : 1.06 : 0.00 : 3.79 : 11.73 +CALABRIA : 27.96 : 5.44 : 5.18 : 0.00 : 20.29 : 58.87 : 1.97 : 0.00 : 2.05 : 0.00 : 9.50 : 13.52 + CMPANIA : 11.04 : 7.99 : 1.77 : 0.00 : 7.91 : 28.71 : 0.04 : 0.00 : 1.15 : 0.00 : 2.71 : 3.90 + EMILIA ROMAGNA : 0.00 : 21.20 : 5.21 : 0.00 : 29.62 : 56.03 : 0.00 : 8.35 : 4.01 : 0.00 : 11.73 : 24.09 + LAZIO : 6.93 : 3.00 : 1.42 : 0.00 : 14.40 : 25.75 : 5.54 : 0.52 : 0.96 : 0.00 : 7.53 : 14.55+ LIGURIA : 0.00 : 8.41 : 2.88 : 0.00 : 14.54 : 25.83 : 0.00 : 1.33 : 1.03 : 0.00 : 9.97 : 12.33
+ HARCHE : 0.00 : 9.37 : 4.10 : 0.00 : 24.12 : 37.59 : 0.00 : 3.14 : 2.06 : 0.00 : 10.90 : 16.10 + HJLISE : 9.35 : 10.64 : 1.67 : 0.00 : 9.32 : 30.98 : 4.84 : 6.77 : 0.18 : 0.00 : 3.56 : 15.35 + P!XiLIA : 23.16 : 5.71 : 2.76 : 0.00 : 2.19 : 33.82 : 18.53 : 0~45 : 1.19 : 0.00 : 0.64 : 20.81
+ SARDEGNA : 7.24 : 7.68 : 3.54 : 0.00 : 5.14 : 23.60 : 4.12 : 0.90 : 2.43 : 0.00 : 2.92 : 10.37 + SICILIA : 1.59 : 12.17 : 4.07 : 0.00 : 11.47 : 29.30 : 0.63 : 0.00 : 1.49 : 0.00 : 1.58 : 3.70
+ 'l'OSCINA : 0.00 : 27.60 : 4.15 : 0.00 : 2\.48 : 53.23 : 0.00 : 16.58 : 2.55 : 0.00 : 14.43 : 33.56 + UMBRIA : Q.OO : 17.52 : 4.34 : 0.00 : 13.64 : 35.50 : 0.00 : 9.75 : 3.52 : 0.00 : 5.38 : 18.65
---~---t TOTAL 129.61 150.02 47.59 6.80 201.50 535.52 52.12 51.66 25.05 0.35 90.64 219.82
[image:38.792.60.727.110.461.2]COHMITHEHTS AIID PAYMENTS HADE AT 31.12. 92 FRENCH IHPS TABLE 4.1 (MECUS)
==========================~==================================================~==============================================================================
+ : COHMI'l'HEHTS : PAYMENTS
+ : ERDF : EAGGF : ESF : FISHERIES: LINE 551 : TOTAL
.
: ERDF : EAGGF : ESF : FISHERIES: LINE 551 : TOTAL
---~---+ FRANCE ', .,.
+
+ AQUITAIIIE : 58.63 : 6.64 : 18.08 : 1.59 : 38.91 : 123.85 : 50.48 : 5.55 : 15.27 : 0.88 : 36.74 : 108.92
+ ARDECHE : 7.90 : 2.99 : 2.68 : 0.00 : 12.62 : 26.19 : 7.29 : 1.87 : 2.47 : 0.00 : 12.02 : 23.65
+ CORSE : 33.95 : 12.18 : 7.34 : 1.12 : 27.56 : 82.15 : 30.33 : 8.14 : 6.24 : 0.81 : 18.32 : 63.84
+ DROHE : 0.00 : 3.95 : 3.30 : 0.00 : 25.55 : 3~.80 : 0.00 : 3.05 : 3.35 : 0.00 : 24.24 : 30.64
+ LANGUEDOC ROUSSILLON: 77.13 : 22.73 : 29.03 : 2.29 : 74.96 : 206.14 : 68.90 : 16.72 : 25.41 : 0.86 : 70.69 : 182.58
t MIDI PYRENEES : 46.98 : 20.35 : 17.89 : 0.00 : 50.27 : 135.49 : 40.50 : 13.35 : 17.69 : 0.00 : 35.61 : 107.15
+ PACA : 0.00 : 37.47 : 14.54 : 0.87 : 93.26 : 146.14 : 0.00 : 25~57 : 14.45 : 0.74 : 86.91 : 127.67
t TOTAL 224.59 106.31 92.86 5.87 323.13
\?2.
76 197.50 74.25 84.88 3.29 284.53 644.45
---~;----=~--~;y---~~---\..N
[image:39.793.52.733.58.532.2]: C<JOIITKENTS : PAYMENTS
+
+ : ERDF : EAGGF : ESF : FISHERIES: LINE 551 : TOTAL : ERDF : EAGGF : ESF : FISHERIES: LINE 551 : TOTAL
---
---;---+ GREECE I
'n
.,
++ ATTICA : 32.42 : 2.19 : 18.41 : 0.00 : 213.70 : 266.72 : 29.00 : 2.19 : 14.50 : 0.00 : 202.57 : 248.26
+ CRE'l'E : 99.01 : 37.26 : 3.66 : 0.40 : 104.11 : 244.44 : 96.45 : 32.75 : 2.48 : 0.00 : 89.74 : 221.42
+ EASTERN AND CENTRAL : 181.07 : 36.32 : 9.45 : 0.00 : 90.54 : 317.38 : 175.40 : 36.32 : 7.98 : 0.00 : 80.85 : 300.55
+ NORTHERN GREECE : 193.01 : 88.38 : 32.76 : 0.00 : 180.21 : 494.36. : 181.46 : 85.73 : 24.62 : 0.00 : 136.95 : 428.76
+ WESTERN & PEIDPONESE: 138.82 : 53.13 : 16.64 : 1.00 : 97.26 : 306.85 : 138.82 : 52.81 : 12.44 : 0.49 : 93.24 : 297.80
+ AEGEAN ISLANDS : 139.13 : 9.60 : 3.84 : 0.00 : 69.20 : 221.77 : 135.84 : 9.60 : 2.43 : 0.00 : 62.94 : 210.81
+ INFORM. TECHNOLCX;Y : 26.58 : 0.00 : 10.67 : 0.00 : 52.78 : 90.03 : 22.88 : 0.00 ,: 6.56 : 0.00 : 46.16 : 75.60
---~---+ TOTAL 810.04 226.88 95.43 1.40 807.80 1941.55 779.85 219.40 71.01 0.49 712.45 1783.20
---~~---~~-~-~---V'
[image:40.793.43.734.52.495.2]