This is a repository copy of Individual effect of recrystallisation nucleation sites on texture weakening in a magnesium alloy: Part 2- shear bands.
White Rose Research Online URL for this paper: http://eprints.whiterose.ac.uk/125478/
Version: Accepted Version
Article:
Guan, D. orcid.org/0000-0002-3953-2878, Rainforth, W., Gao, J. et al. (2 more authors) (2017) Individual effect of recrystallisation nucleation sites on texture weakening in a magnesium alloy: Part 2- shear bands. Acta Materialia. ISSN 1359-6454
https://doi.org/10.1016/j.actamat.2017.12.019
Article available under the terms of the CC-BY-NC-ND licence (https://creativecommons.org/licenses/by-nc-nd/4.0/).
[email protected] https://eprints.whiterose.ac.uk/ Reuse
This article is distributed under the terms of the Creative Commons Attribution-NonCommercial-NoDerivs (CC BY-NC-ND) licence. This licence only allows you to download this work and share it with others as long as you credit the authors, but you can’t change the article in any way or use it commercially. More
information and the full terms of the licence here: https://creativecommons.org/licenses/
Takedown
If you consider content in White Rose Research Online to be in breach of UK law, please notify us by
Accepted Manuscript
Individual effect of recrystallisation nucleation sites on texture weakening in a magnesium alloy: Part 2- shear bands
Dikai Guan, W. Mark Rainforth, Junheng Gao, Le Ma, Brad Wynne
PII: S1359-6454(17)31024-8 DOI: 10.1016/j.actamat.2017.12.019
Reference: AM 14240
To appear in: Acta Materialia
Received Date: 21 October 2017 Revised Date: 12 December 2017 Accepted Date: 14 December 2017
Please cite this article as: D. Guan, W.M. Rainforth, J. Gao, L. Ma, B. Wynne, Individual effect of recrystallisation nucleation sites on texture weakening in a magnesium alloy: Part 2- shear bands, Acta Materialia (2018), doi: 10.1016/j.actamat.2017.12.019.
M
A
N
U
S
C
R
IP
T
A
C
C
E
P
T
E
D
M
A
N
U
S
C
R
IP
T
A
C
C
E
P
T
E
D
ACCEPTED MANUSCRIPT
1
Individual effect of recrystallisation nucleation sites on texture weakening in
a magnesium alloy: Part 2- shear bands
Dikai Guan*, W. Mark Rainforth*, Junheng Gao, Le Ma, Brad Wynne
Department of Materials Science and Engineering, University of Sheffield, Sheffield S1 3JD, UK
*Corresponding authors: [email protected], [email protected]
Abstract
The entire recrystallisation process of a cold-rolled WE43 Mg alloy containing a high
density of shear bands was tracked using a quasi-in-situ electron backscatter diffraction
method. The results showed the resultant recrystallised texture arose principally from
recrystallisation within shear bands rather than from deformation twins, which made a
negligible contribution to the final texture. Only a weakened basal texture with scattered
weak texture components was observed after annealing at 450 °C and 490 °C. This is in
contrast to the widely reported “Rare Earth” textures, believed to come from shear band
recrystallisation. The texture appeared during the nucleation of recrystallised grains and was
preserved during subsequent grain growth. Simultaneous occurrence of precipitation on grain
and twin boundaries during recrystallisation suppressed any potential preferential grain
growth. When annealed at 545 °C, at which temperature both solute drag and Zener pinning
were eliminated, a non-basal texture was produced after annealing due to orientated grain
growth governed by different grain boundary mobility between basal and off-basal grains.
Keywords: Magnesium alloy; Recrystallisation; Shear bands; Texture evolution; Zener
M
A
N
U
S
C
R
IP
T
A
C
C
E
P
T
E
D
ACCEPTED MANUSCRIPT
2 1. Introduction
A strong basal crystallographic texture is usually produced after cold rolling or
thermomechanical processing in Mg and Mg alloys[1-5]. Subsequent annealing is not
effective in modifying this texture in conventional rare earth free Mg alloys [6, 7]. However,
Mg alloys containing rare earth additions (Mg-RE alloys) commonly exhibit only a weak
basal texture due to the introduction of the “Rare Earth texture” (RE texture) [8], which forms
either during thermomechanical processing or subsequent annealing[1, 8-13]. Frequently
reported RE textures are the <1121>//ED(extrusion direction) produced after extrusion [8], and peak texture intensity reduced and tilted towards the transverse direction (TD) after
rolling and/or subsequent annealing[2, 14-16].
Although RE textures have been widely reported over the past two decades, the
mechanism of RE texture formation remains a matter of much debate. Numerous mechanisms
have been proposed, with the proposed key factors including the choice of preferential
nucleation sites[2, 4, 8, 9, 11, 17-20], increased activity of pyramidal <c+a> slip[5], oriented
grain growth and solute drag or particle pinning along some specific grain boundaries (GBs)
[21-25]. It is challenging to validate all the aforementioned proposed mechanisms.
Nevertheless, a key issue to understanding the RE texture is to understand the location of the
nucleation site(s) and/or subsequent growth of corresponding recrystallised grains that lead to
the formation of a RE texture. In an accompanying paper [20] the individual effect of
recrystallisation sites, in particular double twins, on the weakening of the texture in WE43
alloy were systematically investigated. The results unequivocally demonstrated that
recrystallisation within double twins was the main contribution to the final RE texture. The
RE texture appeared at the nucleation stage and was retained during the subsequent uniform
grain growth. However, the material had been processed to specifically exclude shear
M
A
N
U
S
C
R
IP
T
A
C
C
E
P
T
E
D
ACCEPTED MANUSCRIPT
3
Therefore, the study did not answer the question as to whether shear bands can also form the
RE texture in WE43 alloy when other nucleation sites, including second phase particles and
deformation twins, are excluded?
Shear bands are narrow zones of intensive shear strain providing a wide range of
internal misorientations. A wide spectrum of orientations can be generated during dynamic
and static recrystallisation[1, 4, 8, 10, 15, 21]. It is widely accepted that RE textures can form
from a structure that contains shear bands in Mg-RE alloys, but it is also clear that non-RE
containing Mg alloys cannot produce the RE texture from a structure containing intensive
shear banding [1, 10, 15, 26].
Recently, Stanford et al. [8] reported that recrystallised grains from shear bands tilted
away from the extrusion direction gave RE texture orientations. Mackenzie et al.[15] reported
the deformed basal texture was replaced by a texture component towards the TD during
recrystallisation of a Mg-Zn-Ce alloy. They found many recrystallised grains from shear
bands were non-basal and had a growth advantage compared to basal grains during
recrystallisation. Basu et al. [4, 23] also reported that off-basal grains within shear bands had
high mobility relative to basal grains. This mobility difference could be increased when
solute drag was taken into account. However, Senn and Agnew[27, 28] reported shear bands
in a WE53 alloy nucleated grains with a relatively broad spectrum of orientations. A
weakened basal texture was produced when the annealing temperature was lower than the
precipitation solvus temperature and a random texture was obtained when the annealing
temperature was higher than precipitate solvus temperature. Although Senn and Agnew
acknowledged that texture evolution may be related to nucleation of specific orientations and
preferred grain growth, the mechanism randomising deformed texture was not explicitly
explored[27, 28]. Their work only provided recrystallisation texture at a single point during
M
A
N
U
S
C
R
IP
T
A
C
C
E
P
T
E
D
ACCEPTED MANUSCRIPT
4
growth of the recrystallised grains that originated specifically from shear bands. Moreover,
the contribution to the final texture from recrystallisation in shear bands could not be
differentiated from contributions from other nucleation sites, such as second phase particles,
deformation twins, grain boundaries and subgrain boundaries migration [4, 8, 23, 27, 28]. It is
also still not completely clear whether grain nucleation or grain growth dominates the RE
texture evolution during recrystallisation. If the hypothesis that shear band recrystallisation
generates the RE texture orientations is true, then there is a major question as to why shear
bands in the WE53 alloy, with a relatively large amount of RE additions, did not produce a
typical RE texture[27, 28]. If the hypothesis is false, then the question arises as to why the RE
texture was present in a dilute Mg-RE alloys with shear bands [23, 26]?
To address these essential questions, we tracked the entire recrystallisation process
from the as-cold rolled state to the fully recrystallisation condition in the WE43 alloy by
using a quasi-in-situ EBSD method, as presented in [11]. The mechanical process and heat
treatment were purposely adjusted to maximise the production of shear bands in the samples.
We have shown that shear bands did not produce the RE orientated grains during nucleation
stage. The recrystallised texture was retained during entire recrystallisation process and no
preferable grain growth occurred, which is in contrast to the results of other shear
band-related recrystallisation texture investigations. The growth advantage of off-basal grains in
competition with grains with a basal texture was eliminated by concomitant precipitation.
The interactions between shear bands, precipitation, grain growth and recrystallised texture
are discussed in detail. Therefore, these findings will inform designing new wrought age
hardening Mg alloys and the thermomechanical processes window to improve both strength
and formability.
M
A
N
U
S
C
R
IP
T
A
C
C
E
P
T
E
D
ACCEPTED MANUSCRIPT
5
The WE43 alloy examined is the same as used in our previous work [11, 20, 29]. A
rectangular plate 50 (extrusion direction) × 25 × 6 mm3 was cut from the extruded bar for heat treatment and cold rolling. To restrict significant grain growth after heat treatment, a
short solution treatment was employed. One sample was solution treated for only 10 minutes
at 525 °C (denoted SST10M), followed by cold water quenching. The SST10M sample was
then cold rolled with a reduction of 20% in one pass. The solution treatment dissolved the
majority of particles, but not all. The effect of these residual particles on recrystallised texture
could be ignored due to the limited contribution to the final texture[1, 17]. Nevertheless, to
explicitly eliminate the effect of residual particles and thereby examine the individual effect
of shear bands on recrystallised texture, another sample was produced where all these
intermetallic compounds were dissolved. After solution treatment for 4h, this sample was
further subjected to multiple cold rolling (CR) and heat treatment (CR 20% + 525 °C*20mins
+ CR 20% +525 °C*10mins) to obtain a similar grain size to that in sample SST10M, but
with very limited second phase particles. This sample was denoted as SST4H. The aim of this
multiple process was to dissolve the intermetallic particles and refine the grain size as far as
possible and therefore more grains could be investigated improving the statistical reliability
for the quasi-in-situ EBSD. Finally, the SST4H sample was cold rolled with a reduction of 20%
in one pass prior to EBSD examination.
The quasi-in-situ EBSD sample procedure and scanning experimental details can be
found in [11, 20]. The EBSD scans of the same area in sample SST10M were taken after cold
rolling and after 300s, 600s, 1020s, 2760s, and 9960s annealing at 490 °C. Similarly, the
EBSD scans of sample SST4H were collected after cold rolling and after 285s, 585s, 975s,
1575s, 2775s, and 5175s annealing at 490 °C. In addition, another two recrystallised cold
rolled SST4H (one was annealed at 450 °C for 5400s and the other one was annealed at
M
A
N
U
S
C
R
IP
T
A
C
C
E
P
T
E
D
ACCEPTED MANUSCRIPT
6
temperatures on recrystallised texture. To analyse local misorientation within these
microstructure, kernel average misorientation (KAM) maps of the EBSD data were produced
using a filter size of 5x5.
3. Results
3.1 Microstructure after solid solution treatment and cold rolling
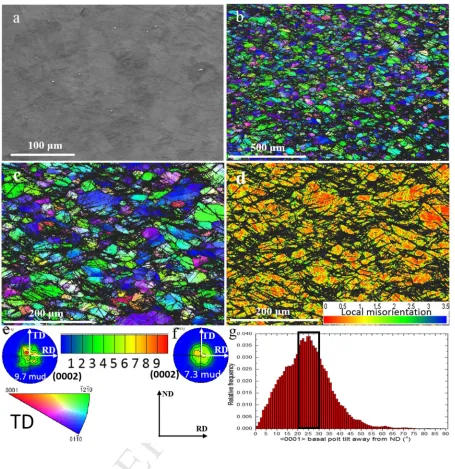
Fig. 1(a) presents a backscattered SEM micrograph of cold-rolled sample SST4H. The
average grain size was calculated to be 35 µm using optical microscopy. Almost all intermetallic compounds formed during casting were dissolved into the Mg matrix except
some sparsely distributed RE enriched particles. Hence, the role of particle stimulated
recrystallisation on texture evolution can be ignored in this study. Fig. S1(a) (Figure S1(a) as
shown in supplementary material) provides backscattered SEM micrograph of the cold-rolled
sample SST10M. A few residual particles were randomly distributed within the sample. Fig.
1(b) gives a large scale EBSD Inverse Pole Figure (IPF) map of the SST4H sample after cold
rolling. Shear bands and deformation twins were the two main deformation microstructures
observed. The same deformation microstructures were observed in cold-rolled SST10M (Fig.
S1(b)). Since most of the sites around the deformation twins were not indexed in the EBSD, it
was difficult to determine the specific twin types. A large sampling area was used to track the
overall texture evolution during annealing. In addition, to determine the individual
contribution to the final recrystallised texture from shear bands and deformation bands, a
smaller sampling area was also selected, as shown in Fig. 1(c). Fig. 1(d) is the corresponding
KAM map of Fig. 1(c). Fig. 1(e) and Fig. 1(f) are (0002) pole figures of Fig. 1(c) and Fig.
1(b), respectively. Although two EBSD maps had different sampling areas, they both had a
similar texture, namely a basal texture with the peak intensity slightly off the basal texture
centre. The large EBSD map had a peak intensity of 7.3 multiples of uniform density (mud)
M
A
N
U
S
C
R
IP
T
A
C
C
E
P
T
E
D
ACCEPTED MANUSCRIPT
7
of the <0001> direction corresponding to each grain orientation in Fig. 1(b) after cold rolling.
It shows a peak at 20-30˚ tilted away from the ND and most texture components are
distributed within 0-45˚, which is consistent with pole figure result presented in Fig. 1(f).
3.2 Grain nucleation and growth from shear bands and deformation twins
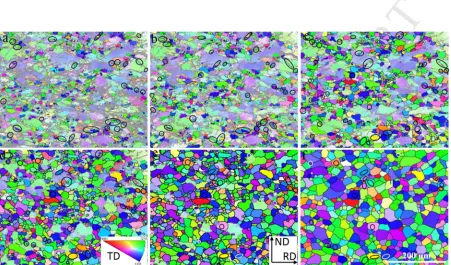
Fig. 2(a-f) presents the entire recrystallisation process from nucleation to full
recrystallisation of the same sampling area in Fig. 1(c), which allows the origin of the
recrystallised grains to be determined as well as following their subsequent growth. After
285s annealing, Fig. 2(a), small recrystallised grains appeared within the shear bands and at
deformation twins. The recrystallised grains originating from deformation twins were marked
by the circles and ovals in Fig. 2. The deformation twin density was lower in sample SST4H
with an average grain size of 35 µm than the sample SST1H studied in our previous work[20]. Figs. 2(b-f) show that many of these recrystallised grains that formed in deformation twins
were subsequently consumed by recrystallised grains generated from shear bands. Because
the density of the twins was low and the number of double twin intersections was particularly
low (Fig. 1c), recrystallised grains from double twins could not grow out of twin boundaries
easily to consume adjacent parent grains. Therefore, it is not surprising that recrystallised
grains from shear bands, which occupied a much higher volume fraction, consumed
constrained recrystallised grains from double twins during recrystallisation. The recrystallised
volume fraction contributed by deformation twins was measured to be only ~5.6% after
nearly full recrystallisation. To further validate the reliability of the results, recrystallised
grains from deformation twins in cold-rolled SST10M were also tracked by quasi-in-situ
EBSD and the final recrystallised volume fraction contributed by deformation twins was
measured to be only ~4%, Fig. S2. Hence, the effect of deformation twins on recrystallised
texture evolution was small and the main contribution to the recrystallised texture came from
M
A
N
U
S
C
R
IP
T
A
C
C
E
P
T
E
D
ACCEPTED MANUSCRIPT
8
The magnification in Fig. 2 is too small to distinguish deformed grain boundary and
subgrain boundary recrystallisation due to boundary migration from shear band
recrystallisation. Therefore, representative high magnification images from samples SST10M
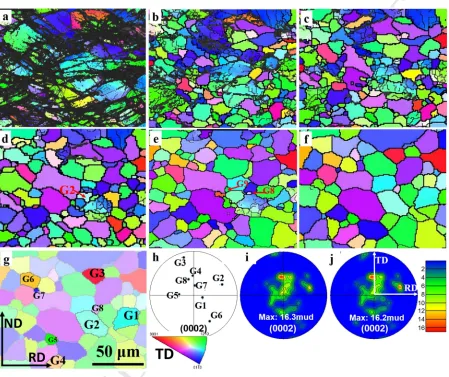
and SST4H are provided in Fig. 3 and Fig. 4, respectively. The small area in Fig. 3(a) from
sample SST10M contains three deformed parent grains (P1, P2 and P3) and intense shear
bands. After annealing for 300s (Fig. 3(b)) and 600s (Fig. 3(c)), all recrystallised grains
nucleated from shear bands expanded into the adjacent P1 and P2 grains. In addition, a
deformed twin in grain P1 was consumed by grain G1 during recrystallisation. After
annealing 1020s and 2760s, small recrystallised grains were gradually consumed by larger
recrystallised grains originating from shear bands, as shown in Fig. 3(e). More specifically,
grains G1-G7 were originally from shear bands within grains P1 and P2, and grains G8-G14
were from shear bands in adjacent areas. Another small area from sample SST4H in Fig. 4
presents the recrystallisation processes including nucleation and growth. Again, shear bands
were preferable nucleation sites and most of the grains consumed deformed parent grains and
small recrystallised grains (Fig. 4(a-f)). However, some recrystallised grains nucleated at high
angle grain boundaries between a recrystallised grain and residual deformed parent grain. As
shown in Fig. 4(g), which uses the same EBSD data of Fig. 4(f), 6 grains (e.g., G1, G2, G4,
G5, G6, G8) in Fig. 4(g) nucleated from grain boundaries instead of within shear bands. Most
of these type of grains appeared in the late stage of the recrystallisation process (e.g., after
annealing 2775s) and some of them were consumed by adjacent recrystallised grains after
further annealing due to small grain size (e.g., a green grain G9 in Fig. 4(e)). Another two
grains marked G3 and G7 in Fig.4 (g) could have come from the grains beneath this 2-D
surface due to 3-D grain growth.
In addition, grains arising from both continuous and discontinuous subgrain growth
M
A
N
U
S
C
R
IP
T
A
C
C
E
P
T
E
D
ACCEPTED MANUSCRIPT
9
30, 31]. However, by carefully comparing the orientations of the recrystallised grains and
deformed parent grains, it was clear that no recrystallised grains had similar orientations to
that of the deformed parent grains. Therefore, if recrystallisation by subgrain growth occurred,
it was minimal and did not contribute to the final texture.
The volume fraction of the 8 grains in Fig. 4(g) that arose from recrystallisation at
high angle grain boundaries was 9.7%. Fig. 4(h) plots corresponding (0002) pole figure of
these 8 grains and indicates these grains were distributed randomly. To find out the influence
of grain boundary recrystallisation on texture evolution, Fig. 4(i) plots (0002) pole figure of
the recrystallised grains that were known to have originated from shear bands
(semi-transparent grains in Fig. 4(g)) and Fig. 4(i) gives (0002) pole figure of all recrystallised
grains in Fig. 4(g). Comparing these two pole figures it is clear that the grain boundary
recrystallisation occurred in the late stage of recrystallisation and did not change the
recrystallised texture distributions or intensity significantly. Another set of quasi-is-situ
EBSD data from sample SST4H was provided in Fig. S3. The volume fraction of grain
boundary recrystallised grains was calculated to be 14.2%. The recrystallised grains G1-G5
(Fig. S3) again had random orientations. Although the texture intensity from only shear band
recrystallisation and from all grains was different, the texture distributions were quite similar.
Based on the aforementioned results, the effect of deformation twins, grain and
subgrain boundary, second phase particles recrystallisation on texture evolution was not
significant. Therefore, the texture evolution in this sample can be largely attributed to shear
band recrystallisation. Another large area EBSD scan (Fig. 1(b)) was used to statistically
investigate the effect of shear bands on texture evolution during the entire recrystallisation
process from nucleation to full recrystallisation. Fig. 5(a-f) give the entire recrystallisation
process from nucleation to complete recrystallisation of the same large scanning EBSD area
M
A
N
U
S
C
R
IP
T
A
C
C
E
P
T
E
D
ACCEPTED MANUSCRIPT
10
heterogeneously distributed within the original shear band directions, which were tilted
±30-50˚ from rolling direction (two sets of representative recrystallised grain bands are marked in
Fig. 5(a)). This again confirmed that recrystallisation was principally nucleated in the shear
bands. After 585s and 975s annealing, the recrystallised grains started to grow and more
recrystallised grains appeared in the shear bands. Subsequently, recrystallised grain growth,
rather than the formation of new recrystallised grains, dominated the recrystallisation process.
Recrystallised grains expanded into adjacent deformed parent grains and consumed smaller
recrystallised grains during grain growth between 1575s and 5175s annealing.
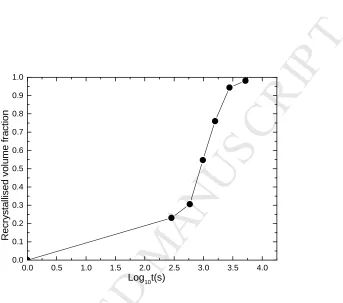
Fig. 6 shows the total recrystallised volume fraction (Vt) of the cold-rolled sample
SST4H as a function of annealing time. After 285s, the recrystallised volume fraction was
23.0%, which was much faster than sample SST1H, reported in [20] and SST24H, reported in
[11]. Subsequently, the recrystallised volume fraction, Vt, increased after 585s 30.6%. The
value of Vt was determined by the recrystallised grains consuming the surrounding
as-deformed matrix and larger recrystallised grains consuming smaller ones, leading to a Vt of
54.7% and 76.0% after annealing 975s and 1575s, respectively. Finally values of Vt of 93.4%
and 98.8% were measured after annealing 2775s and 5175s.
3.3 Texture evolution of all recrystallised grains during annealing
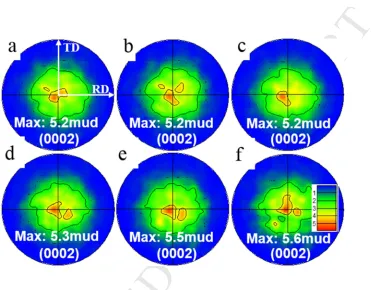
(0002) pole figures, collected from only recrystallised grains (Fig. 5), are given in Fig.
7(a-f). Fig. 7(a) gives a pole figure after 285s annealing at which time substantial nucleation
of recrystallised grains took place. Overall, the pole figure (Fig. 7(a)) shows a weakened
basal texture with a peak intensity of 5.2 mud compared to the deformed texture (Fig. 1(f)) of
7.7. No evidence of a RE texture was observed. Nonetheless, other relative weak texture
components were scattered between RD and TD directions. With further annealing, although
the texture distribution varied slightly (Fig. 7(b-f)), the weakened basal texture and the peak
M
A
N
U
S
C
R
IP
T
A
C
C
E
P
T
E
D
ACCEPTED MANUSCRIPT
11
3.4 Evolution of individual texture components during annealing
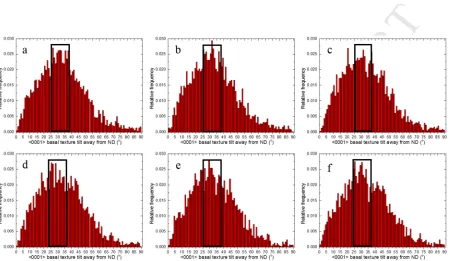
Fig. 8 plots the distribution of <0001> direction corresponding to each grain
orientation. It was obvious that the texture component distribution was well preserved during
the whole recrystallisation process except some spikes (e.g., a spike at 20˚ in Fig. 8(c)),
which was consistent with the (0002) pole figure results (Fig. 7). Compared to the
distribution of the <0001> direction in the cold-rolled sample (Fig. 1(g)), the texture
component distributed in the range of 70-90˚ can be clearly seen and the peak texture
component shifted, being tilted 25-37.5˚ away from the ND after annealing. Moreover, the
peak relative frequency decreased from approximately 0.039 in cold-rolled state to 0.028
after various annealing intervals. This indicated both texture position and intensity were
changed by the recrystallisation.
To determine whether some grains grew favourably during annealing, the
recrystallised grains were divided into four groups as designated in our previous paper [20].
These four groups were 0-20˚ (TCA), 20-45˚(TCB), 45-70˚(TCC) and 70-90˚(TCD) tilted
away from the ND.
Figs. S4-S7 presents a sequence of EBSD IPF subset maps of TCA, TCB, TCC and
TCD grains from SST4H (Fig. 5). The insets in Figs. S4-S7 are corresponding (0002) pole
figures. For grains with TCA orientations, grains were orientated relatively homogeneously
within the region of 0-20˚ tilted away from the ND and the peak texture intensity fluctuated
around 23 mud (Fig. S4). For grains with TCB orientations, grains were uniformly distributed
between TD and RD directions with peak texture intensity around 6.5 from 285s to 1575s.
With further annealing, some texture components between RD and TD were slightly
intensified (Fig. S5(e-f)). Fig. S6 shows grains with the TCC orientation. These grains had a
M
A
N
U
S
C
R
IP
T
A
C
C
E
P
T
E
D
ACCEPTED MANUSCRIPT
12
intensity was gradually transferred from lower to upper hemisphere, but the number of grains
within this texture component was not high.
During the past decade, oriented grain growth of recrystallised grains in shear bands
has been reported arising from solute drag or Zener pinning [4, 21, 23], which is believed to
be the main mechanisms driving the formation of the RE texture. To investigate this, Fig. 9
plots the mean grain size of recrystallised grains of each texture component. The average
grain size of each texture component was nearly all the same from nucleation to full
recrystallisation. This indicated there was no orientated grain growth occurred during
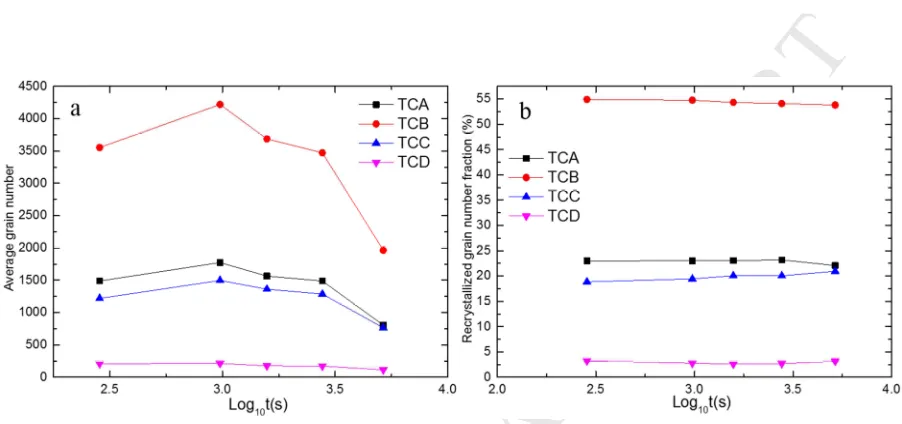
annealing. Fig. 8(a) plots the recrystallised grain number collected from each texture
component. TCB exhibited the most grains throughout the entire recrystallisation process,
followed by TCA, TCC and TCD. The grain number peaked after 975s annealing when the
nucleation sites were saturated and decreased thereafter (Figs. 5-7). The grain number
fraction of recrystallised grains of an individual texture component based on the total
recrystallised grain number after each annealing interval is given in Fig. 10(b). The
recrystallised grain number fraction of each texture component was not changed significantly
over the entire annealing process. Thus, mutual grain consumption during the grain
impinging stage was equal across all orientations.
Fig. 11 plots the volume fraction of each texture component based on total
recrystallised area, excluding the residual un-recrystallised area. Although there were
substantial differences in the recrystallised volume fractions from each component, the
volume fraction of each texture component was well maintained during recrystallised grain
growth, which is consistent with the results presented in Fig. 10(b). This resulted from the
uniform grain growth during recrystallisation (Fig. 9). Since the average grain size of each
texture component was very close, it was not surprising to find the data from Fig. 10(b) and
M
A
N
U
S
C
R
IP
T
A
C
C
E
P
T
E
D
ACCEPTED MANUSCRIPT
13
was a result of recrystallised grains having this orientation formed at the nucleation stage (Fig.
10) which was unchanged by subsequent uniform grain growth (Fig. 9).
3.5 Precipitation during recrystallisation
As mentioned in previous studies [20, 29], recrystallisation was accompanied by a
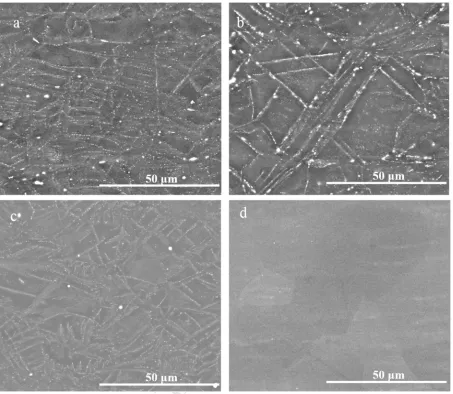
concomitant precipitation and re-dissolution process in this alloy. Fig. 12 provides a series of
backscattered SEM micrographs to show the evolution of precipitation. After 285s annealing
at 490 °C, fine precipitates started to appear, especially along grain boundaries and twin
boundaries (Fig. 1(a)). After 585s annealing, precipitate coarsening also took place (Fig.
12(b)). Fig. 12(c) shows that these precipitates could still be observed along the prior
boundaries after annealing 975s, but the size of these precipitates was reduced due to
dissolution during recrystallisation. After annealing 5175s, the precipitates completely
re-dissolved into the matrix (Fig. 12(d)). The entire precipitation and re-dissolution process was
illustrated in detail elsewhere recently by using in-situ TEM[29].
3.6 Recrystallised textures after annealing at various temperatures
To find out the effect of annealing temperature on recrystallised texture, samples
annealed at 400 °C, 450 °C, 490 °C and 545 °C were investigated and compared (three
temperatures were below and one temperature was above solvus temperature of 525 °C).
After annealing at 400 °C for 5400s, significant precipitation occurred but was associated
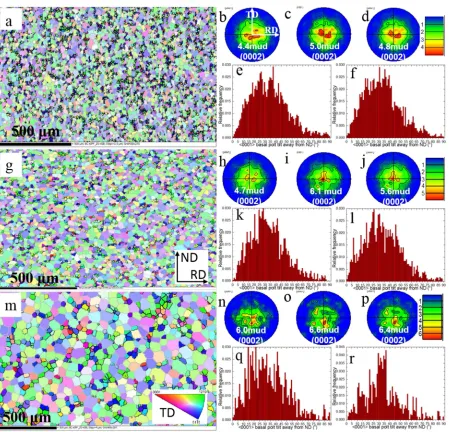
with negligible recrystallisation (which was not presented here). Figs. 13(a,g,m) provide
EBSD IPF maps of samples after annealing 5400s at 450 °C, 5875s at 490 °C and 840s at
545 °C. The recrystallised grains in these three maps were divided into two groups. The grain
size of highlighted small grains was below average grain size while the grain size of the
semi-transparent larger grains was above the average grain size. The mean grain sizes were
M
A
N
U
S
C
R
IP
T
A
C
C
E
P
T
E
D
ACCEPTED MANUSCRIPT
14
average and the whole data set after annealing at 450 °C for 5400s. Although the texture
shape was different between smaller and larger grains, both can be defined as a weakened
basal texture with scattered relative weak off-basal texture components. The texture
component distribution with respect to the <0001> basal poles tilting away from the ND were
very similar when small grains (Fig. 13(e)) were compared to larger grains (Fig. 13(f)). Both
pole figures and texture component distributions results indicated that there was no preferable
grain growth of some specific orientations. Otherwise, the texture component distributions
would be significantly different in Fig. 13(e) and Fig. 13(f).
After annealing at 490 °C for 5875s (Fig. 13(g)), similar results were obtained as
described in sample after annealing at 450 °C. A weakened basal texture with scattered
relative weak off-basal texture components was found in Fig. 13(h) and Fig. 13(i). There was
no noteworthy difference regarding texture component distributions between small and larger
grain areas, Fig. 13(k) and Fig. 13(l). In other words, texture component evolution followed
the same trend with various grain sizes and no orientated growth took place.
However, when the sample was annealed at 545 °C, above precipitate solvus
temperature, for only 840s, the recrystallised texture from small grains were quite different
from the larger grains. Fig. 13(n) shows a (0002) pole figure of the smaller grains which
exhibited a diffuse basal texture. Fig. 13(o) presents the recrystallised texture contributed by
the larger grains tilted towards the TD direction. The texture component had a high frequency
of basal poles tilted away from the ND below 20˚ in smaller grains (Fig. 13(q)). In contrast,
the peak frequencies ranged around 30-45˚ in larger grains (Fig. 13(r)). Hence, orientated
growth occurred after annealing at 545 °C: grains with off-basal orientations had a growth
advantage compared to grains with basal orientations. Equally, the recrystallised texture from
all recrystallised grains after annealing at 545 °C tilted towards the TD with weak scattered
M
A
N
U
S
C
R
IP
T
A
C
C
E
P
T
E
D
ACCEPTED MANUSCRIPT
15
recrystallised grains texture when the sample was annealed at 450 °C (Fig. 13(d)) and 490 °C
(Fig. 13(j)).
4. Discussion
4.1 Effect of concurrent precipitation during early recrystallisation process
The grain boundaries were not found to be active nucleation sites in the early stage of
recrystallisation process, especially during nucleation stage. The detailed mechanism of the
retardation of recrystallisation along prior grain boundaries has been demonstrated recently
and so will not be described in detail here [20]. Briefly, concomitant precipitation on the
grain boundaries during annealing exerted strong Zener pinning that inhibited grain boundary
movement and hence recrystallisation through the prevention of strain induced boundary
movement (SIBM) [32]. Precipitates can clearly be seen distributed along grain and
deformation twin boundaries (Fig. 12(a-c)). This is an important point as recrystallisation
arising from SIBM results in a basal texture and therefore it is key to generate weaker, more
uniform, textures that the grain boundaries are pinned. Clearly, precipitation on grain
boundaries is beneficial to the formation of a weakened basal texture.
Although the stored energy in shear bands was much higher than at prior grain
boundaries, the effect of Zener pinning on shear band recrystallisation needs to be estimated
as it cannot be accurately calculated during the early stages of annealing. The driving force
(Pd) from shear bands, Zener pinning force from concurrent precipitation (Pz) and retarding
pressure due to boundary curvature (Pc) were approximately calculated[31]. Image J was used
to calculate the local volume fraction of second phase particles and average radius. All the
parameters are listed in Table S1.
= (1)
= (2)
M
A
N
U
S
C
R
IP
T
A
C
C
E
P
T
E
D
ACCEPTED MANUSCRIPT
16
where α is a constant of ~0.5, typical average dislocation density ρ was estimated to be 1015m-2, G of Mg is 12.7GPa, b is 0.32nm[33], γ is high grain boundary energy of ~0.4J/m2[34], Fv is local volume fraction of second phase particles, r is the average radius of these particles and R is the average size of recrystallised grains. Dislocation density was not
uniformly distributed due to the heterogeneously deformed microstructure. It can be expected
that dislocation density in shear bands should be much higher than average due to large
orientation gradient within shear bands compare to adjacent deformed grains. However, to
simplify this calculation, the estimated average dislocation density of 1015 m-2 was used to evaluate the as-deformed shear band recrystallisation behaviour during the early stage of
annealing. Furthermore, solute drag was not considered because the sample was annealed at a
high temperature close to the solvus temperature and the concurrent precipitation would have
reduced the extent of segregated solute.
Although the stored energy was used in calculation was certainly an underestimate,
table S1 shows that Pd was at least two times of Pz+Pc after annealing 285s, 585s and 975s.
Therefore, this suggests that the recrystallised grain growth was only slowed but not
stagnated by concurrent precipitation in the early stage of recrystallisation. In addition, at the
onset of recrystallisation (e.g., only after annealing 10s), the high stored energy in the shear
bands and the small volume fraction of precipitates would mean that the precipitation would
not have inhibited recrystallisation within the shear bands.
4.2 Mechanism of recrystallised grain growth and texture evolution during annealing
The typical RE texture formed in Mg-RE alloys with shear bands[4, 8, 15, 23, 26] was
not produced in this work, where the material was processed to contain intensive shear bands.
This was true both during nucleation or subsequent growth of the recrystallised grains (Fig.
7). A weakened basal texture with relative weak scattered texture components between RD
M
A
N
U
S
C
R
IP
T
A
C
C
E
P
T
E
D
ACCEPTED MANUSCRIPT
17
texture was retained during the entire subsequent grain growth and the peak texture intensity
strengthened only slightly in the later stage of grain growth. The question, therefore, is how
this weakened basal texture appeared and was preserved throughout the entire
recrystallisation process.
4.2.1 Formation of recrystallised texture at nucleation
Prior grain and subgrain boundaries, deformation twins, shear bands and second phase
particles were considered as the main nucleation sites for recrystallisation in Mg alloys [1,
10]. In this study, the effect of nucleation of recrystallisation at deformation twins and initial
second phase particles does not need to be considered due to low volume fraction, which
made their contribution to the final texture negligible (Fig. 1(a), Fig. 2 and Fig. S2). The
majority of recrystallisation occurred at shear bands (Figs. 2-5, Figs. S2-3). Concurrent
precipitation occurred during recrystallisation and the size of some particles after coarsening
was larger than 1 μm. Deformation zones formed at large particles are prerequisites for
particle stimulated nucleation (PSN) of recrystallisation. However, in the current work there
were no deformation zones associated with these particles and so PSN was not considered to
occur in this case. Grain boundaries were not active nucleation sites at the early stage of
recrystallisation and no clear evidence of recrystallisation by subgrain boundary migration
was found during the entire recrystallisation process (Figs. 3-4 and Fig. S3). Therefore,
recrystallisation at the shear bands were the main source of recrystallised texture at
nucleation stage. A wide spectrum of orientations can be generated during recrystallisation in
shear bands due to the existence of a wide range of internal misorientations. In Mg alloys,
previous work showed the recrystallised grains nucleated within shear bands had randomised
orientations [4, 8, 15, 21, 23]. After 285s annealing at 490 °C, the nucleation of recrystallised
grains within shear bands did not produce a specific texture component (e.g., RE texture), but
M
A
N
U
S
C
R
IP
T
A
C
C
E
P
T
E
D
ACCEPTED MANUSCRIPT
18
components. This was a result of a wide range of local misorientation within shear bands
nucleating randomly orientated recrystallised grains, in agreement with published results [4, 8,
15, 21, 23].
4.2.2 Mechanism of grain growth and texture evolution controlled by simultaneous
precipitation and re-dissolution
The final recrystallised texture either depends on the nucleation of oriented grains or
the subsequent favourable growth of specific orientations or both [1, 10, 28]. Orientated grain
growth has been observed in other Mg-RE alloys that contained shear bands [4, 8, 15, 23, 26].
In the current work, no preferential grain growth was observed, such that the texture formed
at the nucleation stage was stable and growth rates were equivalent for all orientations
throughout subsequent grain growth.
Most research work related to shear band recrystallisation suggested solute drag
played a critical role in texture evolution [4, 8, 15, 23]. Solute drag caused by segregation
along recrystallised grain boundaries increased the grain boundary mobility difference
between the slow basal and the quicker off-basal grains. Therefore, off-basal grains had a
growth advantage over basal grains when they consumed deformed grains.
However as shown in Fig. 7, there was no evidence of a RE texture throughout
annealing. The main difference between the current study and other research where a RE
texture was observed, was the simultaneous precipitation and re-dissolution on grain and twin
boundaries of second phase particles that we found during recrystallisation, Fig. 12. The
difference could be attributed to a higher amount of RE additions (7 wt.%) in the current
alloy compared to ~1 wt% in the alloy studied by [4, 8, 15, 23, 35]. These precipitates (Fig.
12(a-c)) exerted Zener pinning to suppress grain growth. Precipitation is known to have a
significant effect on texture evolution. For example, Basu et al. observed a strong basal
M
A
N
U
S
C
R
IP
T
A
C
C
E
P
T
E
D
ACCEPTED MANUSCRIPT
19
hindered any orientated growth resulting in the basal texture[4, 23]. In addition, pre-existing
string-like second phase particles or intergranular precipitation stimulated by significant
segregation along grain boundaries reduced the effective role of RE solute and the growth of
grains with specific orientations [1, 35, 36]. In the current work, and the accompanying
paper[20], it was the concurrent precipitation of second phase particles during
recrystallisation that restricted any potential preferential grain growth and allowed for
uniform grain growth among all texture components (Figs. 9-11). Although grain boundary
recrystallisation occurred during the late stage of recrystallisation (Fig. 3 and Fig. S3) when
the precipitates started to re-dissolve into matrix, recrystallised grains from grain boundaries
was only a small fraction (approximately 10%) and these grains had random orientations, and
so did not change the dominant role of shear band recrystallisation on texture evolution.
These are the main reasons why the recrystallised texture morphology at the nucleation stage
was well maintained during the entire recrystallisation process and was not turned into an RE
texture which has been widely reported in Mg-RE alloys with significant shear band
recrystallisation [4, 8, 15, 23].
Grain boundary recrystallisation was found to be at the high angle grain boundary
between a recrystallised grain and a residual deformed grain, instead of from original
deformed grain boundary between two deformed parent grains. One reason for the limited
recrystallisation from the original grain boundaries was that they were pinned by concurrent
precipitation at the early part of recrystallisation and subsequently most of them were
consumed by adjacent recrystallised grains by shear band recrystallisation.
4.2.3 Effect of annealing temperature on texture evolution
The annealing temperature (below/above the particle solvus temperature) had a
significant effect on the recrystallisation texture (Fig. 13) with the mechanism being a
M
A
N
U
S
C
R
IP
T
A
C
C
E
P
T
E
D
ACCEPTED MANUSCRIPT
20
temperature have also previously been reported in a WE53 alloy, but there was no detailed
analysis of the mechanism [27, 28]. A schematic presented in [20] has been slightly modified
based on the recrystallised temperatures used in this work (Fig. 14). Points A and B shown in
Fig. 14 are precipitation and recrystallisation interaction points. When the annealing
temperature is lower than TB, considerable precipitation would occur before recrystallisation
and thereby inhibit recrystallisation. When the annealing temperature is between TB and TA,
recrystallisation and precipitation occur simultaneously. When the annealing temperature is
higher than TA, full recrystallisation occurs before precipitation [31, 37]. The solvus
temperature of the WE43 alloy used in this work was 525 °C. When the sample was annealed
at 400 °C, only precipitation occurred, with no recrystallisation. Simultaneous precipitation
and recrystallisation took place at annealing temperatures of 450 °C and 490 °C. Only
recrystallisation occurred when the sample was annealed at 545 °C. Combining these results
in the schematic, it was clear that 400 °C was below point B, while 450 °C and 490 °C were
between points A and B, and 545 °C was above point A. Although solute drag can retard
dynamic recrystallisation, it cannot inhibit static recrystallisation at high temperatures [22].
Therefore, it was the Zener pinning from the precipitation that retarded the static
recrystallisation at 400 °C. When the annealing temperature was increased to 450 °C and
490 °C, recrystallisation occurred in the shear bands, but the grain boundaries were pinned,
resulting in a random texture (Figs. 13(a-l)). When the sample was annealed above the solvus
temperature at 545 °C, neither segregation nor precipitation occurred. Therefore, the grain
growth at this temperature was a result of the intrinsic character of grain boundaries: the grain
boundary mobility of off-basal grains was faster than basal grains when they consume
deformed grains[4, 23, 38], as shown in Figs. 13(m-r). Most off-basal grains were larger than
M
A
N
U
S
C
R
IP
T
A
C
C
E
P
T
E
D
ACCEPTED MANUSCRIPT
21
This difference resulted in a non-basal texture after full recrystallisation annealing at 545 °C
(Fig. 13(p)).
Intense shear bands have often been observed in non-RE alloys[15, 26], but most of
them still exhibited a basal texture after recrystallisation. In these alloys, solute drag and
Zener pinning could be excluded as contributing to texture. Non-RE elements such as Al and
Zn with small atom size and high diffusion rate do not segregate strongly to grain boundaries
compared to RE elements such as Gd and Y with large atom size and low diffusion rate [22,
24]. Moreover, Robson et al. [22] reported different RE elements resulted in different
recrystallised textures. In a Mg-Y alloy, strong segregation to grain boundaries and weakened
texture was observed after recrystallisation. In a Mg-Nd alloy, no solute segregation, or
weakened texture was detected after recrystallisation due to low solubility of Nd in Mg and
insoluble particles formed with impurities. Basu et al. [25] also compared the different
recrystallisation texture evolution responses of Mg-Gd and Mg-Dy alloys at various
annealing temperatures. Gd exhibited a considerably larger tendency to segregate in
comparison with Dy due to different segregation energies. On the other hand, non-basal
texture or RE texture was not formed during recrystallisation when strong solute drag was
present along grain boundaries[21]. For example, a basal texture has been observed in a
Mg-Ca alloy where strong segregation of Mg-Ca was found. Moreover, it is still not clear whether
solute segregation occurs globally or only along specific types of grain boundaries (e.g., high
angle grain boundaries). Therefore, it is not clear whether the extent of solute drag depends
on the boundary type.
As shown in Fig. 13, WE43 alloy annealed at 545 °C, where we have shown there
was limited solute drag or particle pinning effect, exhibited a non-basal texture formed from
M
A
N
U
S
C
R
IP
T
A
C
C
E
P
T
E
D
ACCEPTED MANUSCRIPT
22
of shear bands, as with double twins discussed in [20], need to be taken into account when
determining how much they contributed to the full recrystallised texture.
In pure Mg and non-RE alloys, shear bands are found to be heterogeneously
distributed in a few coarse bands [5, 15]. The recrystallisation process involves competitive
growth from the different nucleation sites. The most common nucleation site is at prior grain
boundaries, provided their mobility is not reduced by solute drag or precipitate pinning.
Recrystallised grains originating from shear bands do not usually grow beyond the shear band
in which they originated, and therefore, their contribution to the final texture depends on the
volume fraction of shear bands. However, recrystallised grains produced by SIBM consume
the deformed matrix more quickly thereby limiting the contribution to texture from the
recrystallised shear bands. As an example, Fig. S8 provides grain growth analysis by using
quasi-in-situ EBSD in a cold-rolled AZ31 Mg alloy. Regions within deformation bands
recrystallised and grew quickly after annealing at 350 ˚C for 270s compared to the grain
boundary. However, after annealing 1290s, grains within deformation bands lost their growth
advantage and were restricted by deformation band boundaries. The grains with green and
orange colouration nucleated at grain boundaries showed a much faster grain and spread
quickly and freely to consume parent grains. Therefore, the contribution of grain boundary
recrystallisation to recrystallised texture would be magnified, while the contribution from
deformation bands would be reduced with increasing annealing time. This effect would be
more significant with smaller grain size because of high volume fraction of prior grain
boundaries.
In contrast to RE free Mg alloys, a high density of shear bands is usually generated in
Mg-RE alloys, which tend to be much more uniformly distributed than in RE free alloys. This
inevitably means that recrystallisation within the shear bands will contribute much more to
M
A
N
U
S
C
R
IP
T
A
C
C
E
P
T
E
D
ACCEPTED MANUSCRIPT
23
of shear bands meant that recrystallised grains from shear bands were able to grow into the
deformed matrix. These combined effects improved the competitiveness of shear band
recrystallisation over SIBM recrystallisation. The non-basal orientations produced by shear
band recrystallisation dominated subsequent grain growth, which resulted in the formation of
non-basal texture.
5. Conclusions
The recrystallisation process from nucleation to full recrystallisation was investigated
using quasi-in-situ EBSD. The individual effect of shear bands on texture evolution was
systematically investigated, and key conclusions were drawn:
(1) Shear bands were the preferential nucleation sites and shear band recrystallisation
was the main source of the observed recrystallised texture. Recrystallisation from
deformation twins occupied a negligible amount of the final recrystallised area.
This was due to the low density of deformation twins and intersections between
these deformation twins.
(2) The texture observed from recrystallisation in the shear bands was relatively
random, with a weakened basal component, and not a typical RE texture. This
texture evolved as a result of a wide range of local misorientation of grains within
shear bands.
(3) Precipitation and recrystallisation occurred simultaneously during annealing at
450 and 490 °C. These precipitates pinned the grain boundaries and retarded
recrystallisation along grain boundaries, thereby reducing the source of a basal
M
A
N
U
S
C
R
IP
T
A
C
C
E
P
T
E
D
ACCEPTED MANUSCRIPT
24
(4) The weakened basal texture with scattered weak texture components emerged
during nucleation and was preserved during grain growth, so that no orientated
grain growth was observed.
(5) When the sample was annealed at 545 °C, at which temperature solute drag and
Zener pinning would have been negligible, a non-basal texture was obtained after
full recrystallisation. Orientated grain growth was observed, which was governed
by the grain boundary mobility.
(6) The density and distribution of shear bands had a strong influence on the final
texture at temperatures where there was no pinning of grain boundaries by solute
drag and Zener pinning. This explains why non-RE alloys that contain shear bands
usually produce basal texture after recrystallisation.
(7) A large amount of RE additions is beneficial for age hardening in Mg-RE alloys,
but could result in a detrimental effect in reducing the formation of a RE texture
that is commonly observed in dilute Mg-RE alloys due to concurrent precipitation
restricting preferable grain growth during recrystallisation.
Acknowledgements
This work was funded by the EPSRC DARE Project, EP/L025213/1.
References
[1] A. Imandoust, C.D. Barrett, T. Al-Samman, K.A. Inal, H. El Kadiri, A review on the effect of rare-earth elements on texture evolution during processing of magnesium alloys, J. Mater. Sci. (2016) 1-29.
[2] T. Al-Samman, X. Li, Sheet texture modification in magnesium-based alloys by selective rare earth alloying, Mater. Sci. Eng. A 528 (2011) 3809-3822.
[3] J. Hirsch, T. Al-Samman, Superior light metals by texture engineering: Optimized aluminum and magnesium alloys for automotive applications, Acta Mater. 61 (2013) 818-843.
[4] I. Basu, T. Al-Samman, G. Gottstein, Shear band-related recrystallization and grain growth in two rolled magnesium-rare earth alloys, Mater. Sci. Eng. A 579 (2013) 50-56.
M
A
N
U
S
C
R
IP
T
A
C
C
E
P
T
E
D
ACCEPTED MANUSCRIPT
25[7] M.A. Steiner, J.J. Bhattacharyya, S.R. Agnew, The origin and enhancement of texture during heat treatment of rolled AZ31B magnesium alloys, Acta Mater. 95 (2015) 443-455.
[8] N. Stanford, M.R. Barnett, The origin of “rare earth” texture development in extruded Mg-based alloys and its effect on tensile ductility, Mater. Sci. Eng. A 496 (2008) 399-408.
[9] E.A. Ball, P.B. Prangnell, Tensile-compressive yield asymmetries in high strength wrought magnesium alloys, Scripta Metallurgica et Materialia 31 (1994) 111-116.
[10] D. Griffiths, Explaining texture weakening and improved formability in magnesium rare earth alloys, Mater. Sci. Technol. 31 (2015) 10-24.
[11] D. Guan, W.M. Rainforth, L. Ma, B. Wynne, J. Gao, Twin recrystallization mechanisms and exceptional contribution to texture evolution during annealing in a magnesium alloy, Acta Mater. 126 (2017) 132-144.
[12] N. Stanford, D. Atwell, A. Beer, C. Davies, M.R. Barnett, Effect of microalloying with rare-earth elements on the texture of extruded magnesium-based alloys, Scr. Mater. 59 (2008) 772-775.
[13] M. Sanjari, A. Farzadfar, A.S.H. Kabir, H. Utsunomiya, I.-H. Jung, R. Petrov, L. Kestens, S. Yue, Promotion of texture weakening in magnesium by alloying and thermomechanical processing: (I) alloying, J. Mater. Sci. 49 (2014) 1408-1425.
[14] J. Bohlen, M.R. Nürnberg, J.W. Senn, D. Letzig, S.R. Agnew, The texture and anisotropy of magnesium–zinc–rare earth alloy sheets, Acta Mater. 55 (2007) 2101-2112.
[15] L.W.F. Mackenzie, M.O. Pekguleryuz, The recrystallization and texture of magnesium–zinc– cerium alloys, Scr. Mater. 59 (2008) 665-668.
[16] X. Huang, K. Suzuki, Y. Chino, Static recrystallization behavior of hot-rolled Mg-Zn-Ce magnesium alloy sheet, J. Alloys Compd. 724 (2017) 981-990.
[17] J.D. Robson, D.T. Henry, B. Davis, Particle effects on recrystallization in magnesium– manganese alloys: Particle-stimulated nucleation, Acta Mater. 57 (2009) 2739-2747.
[18] I. Basu, T. Al-Samman, Twin recrystallization mechanisms in magnesium-rare earth alloys, Acta Mater. 96 (2015) 111-132.
[19] P. Hidalgo-Manrique, S.B. Yi, J. Bohlen, D. Letzig, M.T. Pérez-Prado, Effect of Nd Additions on Extrusion Texture Development and on Slip Activity in a Mg-Mn Alloy, Metall. Mater. Trans. A 44 (2013) 4819-4829.
[20] D. Guan, W.M. Rainforth, J. Gao, J. Sharp, B. Wynne, L. Ma, Individual effect of
recrystallisation nucleation sites on texture weakening in a magnesium alloy: Part 1- double twins, Acta Mater. 135 (2017) 14-24.
[21] Z.R. Zeng, Y.M. Zhu, S.W. Xu, M.Z. Bian, C.H.J. Davies, N. Birbilis, J.F. Nie, Texture
evolution during static recrystallization of cold-rolled magnesium alloys, Acta Mater. 105 (2016) 479-494.
[22] J. Robson, Effect of Rare-Earth Additions on the Texture of Wrought Magnesium Alloys: The Role of Grain Boundary Segregation, Metall. Mater. Trans. A 45 (2014) 3205-3212.
[23] I. Basu, T. Al-Samman, Triggering rare earth texture modification in magnesium alloys by addition of zinc and zirconium, Acta Mater. 67 (2014) 116-133.
[24] J.D. Robson, S.J. Haigh, B. Davis, D. Griffiths, Grain Boundary Segregation of Rare-Earth Elements in Magnesium Alloys, Metall. Mater. Trans. A 47 (2016) 522-530.
[25] I. Basu, K.G. Pradeep, C. Mießen, L.A. Barrales-Mora, T. Al-Samman, The role of atomic scale segregation in designing highly ductile magnesium alloys, Acta Mater. 116 (2016) 77-94.
[26] M.R. Barnett, M.D. Nave, C.J. Bettles, Deformation microstructures and textures of some cold rolled Mg alloys, Mater. Sci. Eng. A 386 (2004) 205-211.
[27] J.W. Senn, S.R. Agnew, Texture randomization of magnesium alloys containing rare earth elements, in: M.O. Pekguleryuz, N.R. Neelameggham, R.S. Beals, E.A. Nyberg (Eds.) Magnesium Technology 2008, 2008, pp. 153-158.
[28] J.W. Senn, S.R. Agnew, Texture Randomization during Thermomechancial Processing of a Magnesium-Yttrium-Neodymium Alloy, in: L.W.F. Mackenzie (Ed.) Proceedings of Magnesium Technology in the Global Age, 2006, pp. 115-130.
M
A
N
U
S
C
R
IP
T
A
C
C
E
P
T
E
D
ACCEPTED MANUSCRIPT
26
[30] K.Y. Zhu, D. Chaubet, B. Bacroix, F. Brisset, A study of recovery and primary recrystallization mechanisms in a Zr–2Hf alloy, Acta Mater. 53 (2005) 5131-5140.
[31] F.J. Humphreys, M. Hatherly, Recrystallization and Related Annealing Phenomena, Elsevier Science, 2004.
[32] P.A. Beck, P.R. Sperry, Strain Induced Grain Boundary Migration in High Purity Aluminum, J. Appl. Phys. 21 (1950) 150-152.
[33] J.D. Robson, C. Paa-Rai, The interaction of grain refinement and ageing in magnesium–zinc– zirconium (ZK) alloys, Acta Mater. 95 (2015) 10-19.
[34] H. Somekawa, T. Mukai, Effect of grain boundary structures on grain boundary sliding in magnesium, Mater. Lett. 76 (2012) 32-35.
[35] J. Bohlen, S. Yi, D. Letzig, K.U. Kainer, Effect of rare earth elements on the microstructure and texture development in magnesium–manganese alloys during extrusion, Mater. Sci. Eng. A 527 (2010) 7092-7098.
[36] N. Stanford, D. Atwell, M.R. Barnett, The effect of Gd on the recrystallisation, texture and deformation behaviour of magnesium-based alloys, Acta Mater. 58 (2010) 6773-6783.
M
A
N
U
S
C
R
IP
T
A
C
C
E
P
T
E
D
ACCEPTED MANUSCRIPT
[image:30.595.72.527.83.552.2]M
A
N
U
S
C
R
IP
T
A
C
C
E
P
T
E
D
ACCEPTED MANUSCRIPT
[image:31.595.74.525.179.444.2]M
A
N
U
S
C
R
IP
T
A
C
C
E
P
T
E
D
ACCEPTED MANUSCRIPT
M
A
N
U
S
C
R
IP
T
A
C
C
E
P
T
E
D
ACCEPTED MANUSCRIPT
[image:33.595.76.525.179.556.2]M
A
N
U
S
C
R
IP
T
A
C
C
E
P
T
E
D
ACCEPTED MANUSCRIPT
Figure 5 EBSD IPF subset maps only showing recrystallized grains mainly around shear bands at annealing intervals of (a) 285s, (b) 585s, (c) 975s, (d) 1575s, (e) 2775s and (f) 5175s.
M
A
N
U
S
C
R
IP
T
A
C
C
E
P
T
E
D
ACCEPTED MANUSCRIPT
0.0 0.5 1.0 1.5 2.0 2.5 3.0 3.5 4.0 0.0 0.1 0.2 0.3 0.4 0.5 0.6 0.7 0.8 0.9 1.0 R e c ry s ta lli s e d v o lu m e f ra c ti o n
Log10t(s)
Figure 6 Recrystallized volume fraction as function of annealing time of cold-rolled sample
[image:35.595.152.495.161.464.2]M
A
N
U
S
C
R
IP
T
A
C
C
E
P
T
E
D
ACCEPTED MANUSCRIPT
[image:36.595.125.496.171.461.2]M
A
N
U
S
C
R
IP
T
A
C
C
E
P
T
E
D
ACCEPTED MANUSCRIPT
[image:37.595.75.525.174.435.2]M
A
N
U
S
C
R
IP
T
A
C
C
E
P
T
E
D
ACCEPTED MANUSCRIPT
2.5 3.0 3.5 4.0 5
10 15 20
A
v
e
ra
g
e
g
ra
in
s
iz
e
(
µ
m
) TCA
TCB TCC TCD
Log10t(s)
[image:38.595.157.495.170.438.2]M
A
N
U
S
C
R
IP
T
A
C
C
E
P
T
E
D
ACCEPTED MANUSCRIPT
[image:39.595.72.523.171.383.2]M
A
N
U
S
C
R
IP
T
A
C
C
E
P
T
E
D
ACCEPTED MANUSCRIPT
2.0 2.5 3.0 3.5 4.0 0 5 10 15 20 25 30 35 40 45 50 55 60 R e c ry s ta lli z e d v o lu m e f ra c ti o n ( % ) TCA TCB TCC TCD
Log10t(s)