264 causes of death, 1980–2016: a systematic analysis for
the Global Burden of Disease Study 2016
GBD 2016 Causes of Death Collaborators*
Summary
Background Monitoring levels and trends in premature mortality is crucial to understanding how societies can address prominent sources of early death. The Global Burden of Disease 2016 Study (GBD 2016) provides a comprehensive assessment of cause-specific mortality for 264 causes in 195 locations from 1980 to 2016. This assessment includes evaluation of the expected epidemiological transition with changes in development and where local patterns deviate from these trends.
Methods We estimated cause-specific deaths and years of life lost (YLLs) by age, sex, geography, and year. YLLs were calculated from the sum of each death multiplied by the standard life expectancy at each age.We used the GBD cause of death database composed of: vital registration (VR) data corrected for under-registration and garbage coding; national and subnational verbal autopsy (VA) studies corrected for garbage coding; and other sources including surveys and surveillance systems for specific causes such as maternal mortality. To facilitate assessment of quality, we reported on the fraction of deaths assigned to GBD Level 1 or Level 2 causes that cannot be underlying causes of death (major garbage codes) by location and year. Based on completeness, garbage coding, cause list detail, and time periods covered, we provided an overall data quality rating for each location with scores ranging from 0 stars (worst) to 5 stars (best). We used robust statistical methods including the Cause of Death Ensemble model (CODEm) to generate estimates for each location, year, age, and sex. We assessed observed and expected levels and trends of cause-specific deaths in relation to the Socio-demographic Index (SDI), a summary indicator derived from measures of average income per capita, educational attainment, and total fertility, with locations grouped into quintiles by SDI. Relative to GBD 2015, we expanded the GBD cause hierarchy by 18 causes of death for GBD 2016.
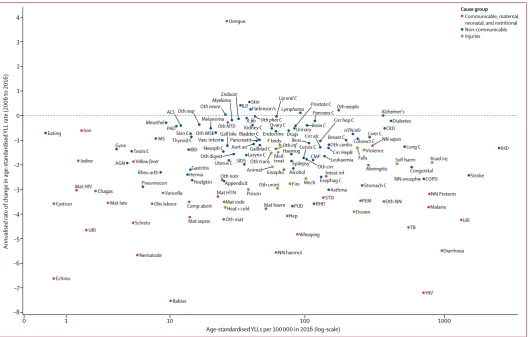
Findings The quality of available data varied by location. Data quality in 25 countries rated in the highest category (5 stars), while 48, 30, 21, and 44 countries were rated at each of the succeeding data quality levels. Vital registration or verbal autopsy data were not available in 27 countries, resulting in the assignment of a zero value for data quality. Deaths from non-communicable diseases (NCDs) represented 72·3% (95% uncertainty interval [UI]71·2–73·2) of deaths in 2016 with 19·3% (18·5–20·4) of deaths in that year occurring from communicable, maternal, neonatal, and nutritional (CMNN) diseases and a further 8·43% (8·00–8·67)from injuries. Although age-standardised rates of death from NCDs decreased globally between 2006 and 2016, total numbers of these deaths increased; both numbers and age-standardised rates of death from CMNN causes decreased in the decade 2006–16—age-standardised rates of deaths from injuries decreased but total numbers varied little. In 2016, the three leading global causes of death in children under-5 were lower respiratory infections, neonatal preterm birth complications, and neonatal encephalopathy due to birth asphyxia and trauma, combined resulting in 1·80 million deaths (95% UI 1·59 million to 1·89 million). Between 1990 and 2016, a profound shift toward deaths at older ages occurred with a 178% (95% UI176–181) increase in deaths in ages 90–94 years and a 210% (208–212) increase in deaths older than age 95 years. The ten leading causes by rates of age-standardised YLL significantly decreased from 2006 to 2016 (median annualised rate of change was a decrease of 2·89%); the median annualised rate of change for all other causes was lower (a decrease of 1·59%) during the same interval. Globally, the five leading causes of total YLLs in 2016 were cardiovascular diseases; diarrhoea, lower respiratory infections, and other common infectious diseases; neoplasms; neonatal disorders; and HIV/AIDS and tuberculosis. At a finer level of disaggregation within cause groupings, the ten leading causes of total YLLs in 2016 were ischaemic heart disease, cerebrovascular disease, lower respiratory infections, diarrhoeal diseases, road injuries, malaria, neonatal preterm birth complications, HIV/AIDS, chronic obstructive pulmonary disease, and neonatal encephalopathy due to birth asphyxia and trauma. Ischaemic heart disease was the leading cause of total YLLs in 113 countries for men and 97 countries for women. Comparisons of observed levels of YLLs by countries, relative to the level of YLLs expected on the basis of SDI alone, highlighted distinct regional patterns including the greater than expected level of YLLs from malaria and from HIV/AIDS across sub-Saharan Africa; diabetes mellitus, especially in Oceania; interpersonal violence, notably within Latin America and the Caribbean; and cardiomyopathy and myocarditis, particularly in eastern and central Europe. The level of YLLs from ischaemic heart disease was less than expected in 117 of 195 locations. Other leading causes of YLLs for which YLLs were notably lower than expected included neonatal preterm birth complications in many locations in
Lancet 2017; 390: 1151–210
*Collaborators listed at the end of the Article
Correspondence to: Prof Christopher J L Murray, Institute for Health Metrics and Evaluation, Seattle, WA 98121, USA
Introduction
Tracking age-sex-specific death rates by cause is an essential component of health surveillance. Recent health challenges such as the emergence of Zika and Ebola viruses, or the ongoing challenges of interpersonal violence, conflict, drug deaths, and natural disasters, affect
health-system decision making.1,2 Rapid progress to
reduce mortality is possible for some causes, as evidenced by previously documented declines in central Europe for cardiovascular disease death rates or decreasing mortality from malaria in eastern sub-Saharan Africa.3 Trends in
cause-specific mortality can inform decision makers about
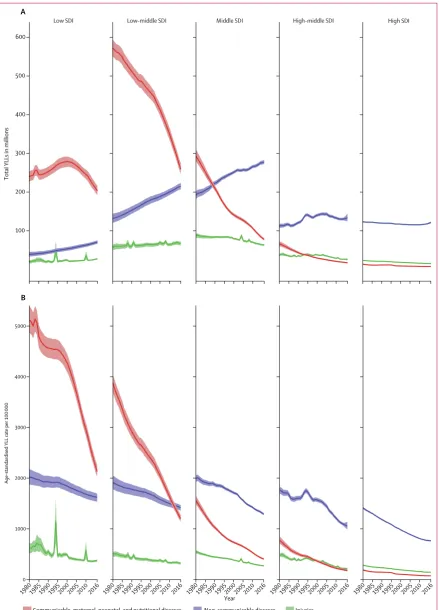
SDI. A global shift towards deaths at older ages suggests success in reducing many causes of early death. YLLs have increased globally for causes such as diabetes mellitus or some neoplasms, and in some locations for causes such as drug use disorders, and conflict and terrorism. Increasing levels of YLLs might reflect outcomes from conditions that required high levels of care but for which effective treatments remain elusive, potentially increasing costs to health systems.
Funding Bill & Melinda Gates Foundation.
Copyright © The Author(s). Published by Elsevier Ltd. This is an Open Access article under the CC BY 4.0 license.
Research in context Evidence before this study
This paper builds on the Global Burden of Disease Study 2015 (GBD 2015). GBD 2015 provided estimates on 249 causes of death for 195 countries and territories, including subnational assessments for 11 countries from 1980 to 2015. GBD 2015 also provided analyses of causes of death in relation to the
Socio-demographic Index (SDI)—a measure of per capita income, education, and total fertility. In addition, periodically updated estimates of causes of death are produced by WHO for a broad list of causes for all age groups, for cancers by the International Agency for Research on Cancer, and for child causes by the Maternal and Child Epidemiology Estimation group. Many groups also publish periodically on specific causes for a subset of locations. The GBD study remains the only peer-reviewed, comprehensive, and annual assessment of mortality by age, sex, cause, and location for a long time series that complies with the GATHER guidelines.
Added value of this study
GBD 2016 both provides estimates for 2016 and updates the entire time series from 1980 produced for GBD 2015. This update advances the measurement of deaths and years of life lost (YLLs) in several ways. First, greater data availability or policy interest supported several causes being removed from broader residual categories and separately assessed in the GBD cause hierarchy, including multidrug and extensively drug-resistant tuberculosis, alcoholic cardiomyopathy, urogenital congenital anomalies, and self-harm by firearm. Second, the terminal age group in all previous GBD analyses was 80 years and older; this age group has been separated into 80–84 years, 85–89 years, 90–94 years, and age 95 years and older. Third, we added 169 country-years of vital registration (VR) data at the national level and 24 verbal autopsy studies. Fourth, the verbal autopsy (VA) data collected through the Sample Registration System for the period 2004–13 were shared by the Government of India with the Indian Council of Medical
Research for inclusion in the GBD analysis; these data included detailed International Classification of Diseases codes for deaths in each state, stratified by urban and rural residence. Fifth, we included data and expanded estimation to the level of local government areas for England and provinces in Indonesia. Sixth, we analysed and report on the fraction of deaths captured by VR systems that are assigned to major garbage codes. Seventh, we created a star rating system for the overall quality of cause of death data for each location in each year; this system represents VR completeness, percentage of deaths coded to causes that cannot be true underlying causes of death (garbage codes), detail of the cause list and age groups, and time periods covered. Eighth, we modelled antiretroviral therapy (ART) coverage for each location-year by CD4 count at initiation, age, and sex based on household survey data; this was a revision to the UNAIDS model assumption of ART coverage being highest among populations most in need. Ninth, important model improvements were implemented for malaria, tuberculosis, HIV/AIDS, and cancers. Tenth, we provide more exploration of the patterns of changing YLLs for SDI quintiles as assessed in 2016. Last, we explore the relation between rates of change and levels of age-standardised YLL rates.
Implications of all the available evidence
For the online repository see https://github.com/ihmeuw/ ihme-modeling See Onlinefor appendix 1
For the data visualisations see https://vizhub.healthdata.org/ gbd-compare
challenges. The broader health agenda of the Sustainable Development Goals (SDGs) requires expanded tracking of a number of non-communicable diseases (NCDs) and injuries. Support for this expanded agenda in a world of complex health changes requires comprehensive, comparable, and timely estimates of causes of death by cause and by age, sex, location, and year.
Several episodic efforts to estimate global and national mortality from specific diseases exist, as well as more limited efforts to estimate mortality from a comprehensive set of causes.4–17 The latest assessment from the Maternal
and Child Epidemiology Estimation (MCEE) group reports estimates for 15 cause groups of child death for 194 countries for the period 2000–15,18 while the Global
Health Estimates (GHE) programme through WHO recently published estimates for 176 causes of death for 183 countries from 2000 to 2015.19 The Global Burden of
Disease (GBD) study, however, provides the only annual, comprehensive assessment of a detailed set of underlying causes disaggregated by age, sex, location, and year, enhancing opportunities to make comparisons across time and between locations.
The primary objective of this study was to estimate mortality for 264 causes by sex for 23 age groups in 195 countries or territories from 1980 to 2016. This GBD cycle incorporates seven notable updates or changes: (1) new data sources released since GBD 2015; (2) data sources from earlier years that were published in the past year; (3) further disaggregation of national or subnational units for selected locations; (4) further disaggregation of residual causes into individual causes, particularly those of policy interest; (5) improved data-processing methods such as the redistribution of deaths assigned to International Classification of Diseases (ICD) codes that cannot be underlying causes of death (garbage codes); (6) model improvements for synthesising different sources of data and filling in data gaps; and (7) novel ways to visualise, summarise, or analyse results, such as by development status. These advances stem from both published critiques and recommendations from the extensive GBD network of 2518 collaborators from 133 countries and three territories. As with each annual cycle of GBD, the entire time series was re-estimated to ensure that all comparisons are made using a consistent dataset and methods; these results, therefore, supersede all previously published GBD cause of death estimates.
Methods
OverviewThe GBD study provides a highly standardised approach to dealing with the multiple measurement challenges in cause of death assessment, including variable complete-ness of vital registration (VR) data, levels and trends in the fraction of deaths assigned to garbage codes, the use of
provided in the methods appendix (appendix 1 p 288). Statistical code used in estimation is available through an online repository; analyses were done using Python version 2.7.12 and 2.7.3, Stata version 13.1, and R version 3.2.2. As in GBD 2015, we follow the Guidelines for Accurate and Transparent Health Estimates Reporting (GATHER) for the development and documentation of GBD 2016 (appendix 1 p 292).
Geographical units and time periods
The GBD geographical hierarchy includes 195 countries and territories grouped within 21 regions and seven GBD super-regions (appendix 1 p 460). For the GBD 2016 estimation, new subnational assessments were developed for Indonesia by province and for England by local government area. In this publication, we present subnational estimates for all countries with a population greater than 200 million in 2016: Brazil, China, India, Indonesia, and the USA. The likelihood of substantial geographical heterogeneity in these large populations is high, requiring disaggregated assessments to be policy relevant. Due to space limitations, we only provide these subnational estimates in maps; detailed subnational assessments will be provided in separate publications.
Cause-specific estimation for GBD 2016 covers the years 1980 to 2016. For a subset of analyses in this paper, we focus on the past decade, from 2006 to 2016, to address more current policy priorities. GBD 2016 results for all years and by location can be explored further with dynamic data visualisations.
GBD cause list
For GBD, each death is attributed to a single underlying cause—the cause that initiated the series of events leading to death—in accordance with ICD principles. This categorical attribution of causes of death differs from the counterfactual approach, which calculates how many deaths would not have occurred in the absence of disease. GBD also differs from approaches involving excess mortality in people with disease monitored through cohort or other studies. Deaths in such studies might be assigned as the underlying cause, be causally related to the disease, or include deaths with confounding diagnoses.3
self-further to Level 4 causes (eg, four sub-causes within chronic kidney disease).
For GBD 2016, we disaggregated some Level 3 causes to expand the cause hierarchy used for GBD 2015 by 18 causes of death. GBD cause list expansion was motivated by two main factors: inclusion of causes that result in substantial burden and inclusion of causes that are of high policy relevance. New causes for GBD 2016 included Zika virus disease, congenital musculoskeletal anomalies, urogenital congenital anomalies, and digestive congenital anomalies. Other leukaemia was added as a Level 4 subcause to leukaemia rather than being estimated in the Level 3 residual category of other neoplasms. The Level 3 cause of collective violence and legal intervention was separated into “executions and police conflict” and “conflict and terrorism”. Disaggregation of existing Level 3 causes resulted in the addition of 11 detailed causes at Level 4 of the cause hierarchy: drug-susceptible tubercu-losis, multidrug-resistant tubercutubercu-losis, and extensively drug-resistant tuberculosis; drug-susceptible HIV– tuberculosis, multidrug-resistant HIV–tuberculosis, and extensively drug-resistant HIV–tuberculosis; alcoholic cardiomyopathy, myocarditis, and other cardiomyopathy; and self-harm by firearm, and self-harm by other means. Within each level of the hierarchy the number of collectively exhaustive and mutually exclusive causes for which the GBD study estimates fatal outcomes is three at Level 1, 21 at Level 2, 145 at Level 3, and 212 at Level 4. For GBD 2016, separate estimates were developed for a total of 264 unique causes and cause aggregates.
Sources of cause of death data
The GBD study combines multiple data types to assemble a comprehensive cause of death database. Sources of data included VR and VA data; cancer registries; surveillance data for maternal mortality, injuries, and child death; census and survey data for maternal mortality and injuries; and police records for interpersonal violence and transport injuries. Since GBD 2015, 24 new VA studies and 169 new country-years of VR data at the national level have been added. Six new surveillance country-years, 106 new census or survey country-years, and 528 new cancer-registry country-years were also added. An important development has been the release of the Sample Registration System (SRS) VA data by the Government of India for use in GBD. This includes cause of death data for 455 460 deaths covered by SRS from 2004–06, 2007–09, and 2010–13 across all Indian states and union territories. For this analysis, we established 2005, 2008, and 2012 as midpoint years for these three periods. The SRS in India is operated by the Office of the Registrar General of India working under the Ministry of Home Affairs, Government of India. Using the 2001 census, 7597 geographical units, 4433 (58·4%) of which were rural, were sampled for the
picture of causes of death in India, particularly in rural areas. For a subset of causes, we used the India Medical Certification of Cause of Death (MCCD) data source or Survey of Causes of Death (SCD) data rather than SRS. The decision to use MCCD and SCD data in addition to SRS was limited to causes for which we had clear evidence of time trends not reflected by using the three SRS midpoint years alone (eg, maternal mortality). The Office of the Registrar General of India is not involved with the production of the GBD modelled estimates, and as a result their estimates might differ from those presented here. Methods for standardisation or correction of data sources are described in detail in appendix 1 (p 14).
Socio-demographic Index (SDI) and epidemiological transition analysis
The SDI was developed for GBD 2015 to provide an interpretable synthesis of overall development, measured by the geometric mean of scores on relative scales of lag-dependent income per capita (LDI), average educational attainment in the population aged older than 15 years, and total fertility rates (TFR).3 For GBD 2016, the SDI
was slightly revised; the correlation of the GBD 2015 and GBD 2016 versions of SDI is 0·977 (p<0·0001)—see Wang and colleagues21 for details on the changes. We
estimated the relationship between SDI and each age-sex-cause death rate using Gaussian process regression (appendix 1 p 282). These relationships were used to estimate deaths and YLLs expected on the basis of SDI alone for each age-sex-location-year.
Cause of death data standardisation and processing
Crucial steps in the standardisation of cause of death data include dealing with the small fraction of deaths that are not assigned an age or sex; deaths assigned to broad age groups not 5-year age groups; and various revisions of the ICD and national variants of the ICD. Details on the standardised protocols for these cases are provided in appendix 1 (p 9). A key step to the GBD cause of death database development is identifying and redistributing deaths assigned to ICD codes that cannot be underlying causes of death (eg, senility or low back pain); are intermediate causes of death rather than the underlying cause (eg, sepsis and heart failure); or lack specificity in coding (eg, unspecified cancer or unspecified cardiovascular disease). These so-called garbage codes are redistributed using the GBD method established by Naghavi and colleagues22 and explained in greater detail
Algeria American Samoa Antigua Argentina Armenia Australia Austria Azerbaijan The Bahamas Bahrain Barbados Belarus Belgium Belize Bermuda Bolivia Bosnia Brazil Brunei Bulgaria Canada Cape Verde Chile China Colombia Costa Rica Croatia Cuba Cyprus Czech Republic Denmark Dominica Dominican Republic Ecuador Egypt El Salvador Estonia Fiji Finland France Georgia Germany Ghana Greece Greenland Grenada Guam Guatemala Guyana Haiti Honduras Hungary Iceland India Iran Iraq Ireland Israel Italy Jamaica Japan Jordan Kazakhstan Kiribati Kuwait Kyrgyzstan Latvia Libya Lithuania Luxembourg
44 44
21 20 18 16 15 19 14 21 17 26 25 13 16 16 21 24 33 39 38 37 34 29 29 28 30 31 28 38 20 28 22 20 21 25 23 22 20 30 29 21 21 22 28 29 26 24 24 28 30 31 31 30 30 30 30 31 32 33 33 32 34 33 33 32 33 33 33 34 33 33 33 33 34 34 34 34 35 34 34 32
13 14 14 13 14 51 15 14 13 14 17 20 16 15 13 13 12 12 12 13 14 9 9 10 10 10 9 9 9 8
7 7 7 7 7 7 7 7 7 7 8 7 8 8 8 9 8 9 9 9 9 8 9 9 9 9 9 10 9 9 10 10 10 9 10
10 11 11 18 10 10 9 9 10 10 10 11 12 12 12 12 11 12 12 13 13 13 9 8 8 9 9 10 9 11 11 11 11 11 11
14 14 14 13 13 14 15 15 14 13 12 17 15 15 15 15 16 16 9 9 10 14 43
25 25 22 26 20 36 34 36 42 34 32 10 13 13 24 16 15 16 13 14 14 13 14 13 14 13
23 38 36 39 40 38 42 39 41 40 42 45 48 46 42 39 36
26 28 28 27 28 28 27 26 27 28 28 30 28 30 30 29 24 25 25 28 31 30 21 18 23 19 19 19 20 20
16 16 14 13 13 14 15 22 25 25 25 24 24 23 21 20 20 20 17 17 17 18 17 17 20 21 18
23 22 22 23 23 25 23 22 24 25 24 24 21 19 19 19 16 18 16 17 17 17 17 18 17 17 17 17 17 18 20 20 20 20 20 34 24 35 42 34 29 25 36 41 40 38 41 35 41 29 23 23 28 23 22 23 22 21 20 22 18 13 13 11 12 12 12 12 18 11 13 31 9 15 18 17 15 18 21 23 21 7 7 9 12 11 13 8 11 13 14 16 15 14 16 16 15 12 11 10 13
73 71 70 67
37 37 32 31 32 31 31 31 28
35 35 34 35 36 35 34 34 34 33 32 32 33 33 32 31 28 27 28 28 27 26 26 25 24 22 20 19 19 19 18 18 18 18 17 18 25 17 14 18 17 17 17 17 17 17 17 18 18 23 21 15 12 15 16 20 21 20 21 19 19 19 21 22 21 20 20 20 20 21 23 25 28 28 28 29 29 28 29 30 27 28 28 28 32 34 35 30 32 11 11 12 12 11 12 10 10 11 11 12 12 12 12 12 12 12 13 12 12 11 10 11 11 10 11 11 10 10 10 10 10 10
42 31 29
27 26 26 24 26 25 25 25 25 24 24 24 24 21 21 20 16 15 15 13 11 10 9 9 9 9 10 10 10 11 10 10 11 11 22 20 17 13 15 15 16 14 14 16 26 24 5 5 9 8 14 12 12 12 11 10 8 7 24 25 23 21 21 21 21 20 20 20 19 19 18 16 16 17 17 17 12 11 10 10 10 10 10 11 11 11 11 11 11 12 11 10 23 24 20 19 18 18 18 17 18 18 22 21 19 19 20 20 20 11 10 9 8 9 10 8 9 9 10 10 11 10 9 9 9 10 9
19 18 18 17 16 15 15 17 19 19 20 19 20 18 17 16 16 17 16 14 14 13 14 13 12 10 10 9 8 8 15 15 15 15 15 15 14 16 14 14 15 15 16 17 17 18 18 11 11 12 12 11 10 10 10 10 9 9 9 9 9 9 8 9 9
65 64 30 28 25 23 23 24 24 20 23 18 18
10 11 11 11 11 11 12 12 13 15 17 20 18 16 15 15 16 16 17 16 15 14 15 16 16 15 15 12 13 14 19 19 20 20 20 21 22 22 23 24 25 26 27 27 16 16 20 16 15 13 15 15 17 17 17 15 16 17 17 17 16 17 15 16 16 34 30 31 33 30 42 39 40 34 39 38 43 40 40 44 41 45 44 41 37 34 36 37 34 31 14 15 19 21 20 19 16 23 17 29 45 43 40 37 34 33 31 31 34 35 33 35 35 35 36 31 29 27 27 25 25 23 24 21 18 19 17 15 17 17 21 29 28 28 29 29 29 29 29 28 29 29 28 28 28 33 33 28 33 33 34 33 33 35 33 30 29 27 26 28 25 26 26 25 23 21
53 49 50 51 55 58 57 57 58 57 58 58 59 59 58 54 52 56 52
27 31 40 39 35 33 34 34 32 30 32 32 29 28 29 30 31 29 28 29 31 32 31 33 31 33 36
10 10 10 9 9 9 10 12 13 15 15 6 7 7 7 7 8 7 8 8 8 8 9 9 10 7 6 6 7 8 8 8
43 53 43 42 41 39 39 37 36 35 30 30
19 20 20 20 20 20 21 9 10 9 9 9 9 8 8 8 5 5 4 4 4 4 4 4 5 5 5 5 5 5 5 5 5 4 5
25 25 25 25 24 23 23 23 22 22 22 22 22 22 22 23 22 22 21 21 21 21 21 22 20 21 20 21 21 21 22 22 23 23
10 12 11 12 12 9 9 8 9 10 10 10 11 14 13 14 12 11 23 36 41 42 48 71 53 48 51 41
23 23 23 23 22 22 23 22 22 21 21 18 17 17 17 17 17 17 16 16 17 17 17 17 16 16 16 17 17 17 17 16 16 16 16
32 33
22 22 21 20 19 19 23 30 30 29 30 30 29 29 28 28 28 28 30 30 29 27 29 28 28 28 28 23 29 23 25 26 27 26 26 13 14 15 12 10 12 10 11 13 11 10 16 13 13 12 12 20 19 20
30 45 39 45 41 46 44 39 38 39 35 26 23 28 27 23 25 23 28 21 18 15 16 15 21 19
7 8 10 8 9 8 10 9 9 9 8 9 7 7 7 8 10 9 11
20 27 25 28 28 29 30 29 32 33 34 31 30 30 29 29 30 29 30 28 28 29 29 29 29 28 25 24 23 22 22 22 36 23 25 26 25 24 26 25 26 31 28 30 26 13 18 16 13 15 13 15 16 16 19 18 17 19
55 54 41 45 53
54 49 59 74 37 35 41 35 12 12 11 11 9 9
9 9 10 11 11 11 11 11 10 11 11 11 10 10 10 10 9 9 9 10 9 9 9 8 7 8 7 7 7 7 7 6 7 6 6 6
16 10 8 9 9 8 10 10 7 7 8 6 7 6 6 8 7 6 7 6 7 8 7 8 7 7 9 9 9 9 9 9 10 11 10 12 11
25 29 32 31 28 24 31 37 35 35 36 35 35 37 36 37 37 38 38 37 36 35 36 38 39 34 40 42 41 35 34 45
46 47 44 50 53 49 50 73 70 65 58 58 57 1 1 22 19 17 15 15 14 15 17 15 20 20 21
42
10 10 10 10 9 9 9 9 9 9 9 9 9 8 9 9 9 9 9 10 9 10 10 10 10 9 13 8 8 8 8 8 8 8
21 20 20 19 21 19 19 18 20 18 19 19 21 17 17 18 17 19 18 19 19 18 18 18 20 20 20 20 20 20 19 21 22 22 22 12 12 12 12 12 13 13 12 12 12 12 12 12 12 12 13 13 13 13 13 13 13 12 12 12 12 11 11 12 12 12
36 36 32 29 30 29 30 28 27 29 33 31 23 29 32 23 17 20 14 13 14 11
17 18 18 18 19 19 19 19 20 20 21 21 21 21 18 12 13 13 13 14 14 14 14 15 15 16 16 16 17 18 19 19 20 21 21 20 17 17 16 17 18 19
21 20 20 18 18 18 17 17 11 12 11 11 11 11 11 11 15 13 14 14 14 19 19 20 20 24 29 33 34 16 15 12 40 37 34 36 31 34 34 32 43 44 41
18 18 21 20 19 18 21 20 22 21 28 25 25 22 24 22 21 20 19 17 16 18 17 19 15 14 15 17 22 17
19 18 17 15 16 15 16 19 20 20 22 24 24 23 21 21 20 11 9 8 8 8 8 7 7 7 6 7 7 7 7 7 8
10 11 10 9 9 9 9 9 9 10 12 13 14 16 16 17 10 9 8 8 9 10 11 11 12 12 13 11 12 11 11 10 8 6 6 95 98 96
12 11 9 8 8 8 8 8 10 11 10 8 6 6 5 6 8 9 7 7 7 7 7 7 8 7 7 7 7 6 6 6 6
Figure 1: Percent of garbage coded deaths in GBD levels 1 and 2 for all ages by country and year, 1980–2016
Cells are colour-coded by percent of data redistributed in a given country-year from garbage coding to a likely underlying cause of death. Blank white cells indicate lack of vital registration. Major Madagascar
Malaysia Maldives Mali Malta Mauritius Mexico Moldova Mongolia Montenegro Morocco Mozambique Northern Mariana Islands Netherlands New Zealand Nicaragua Nigeria Norway Oman Papua New Guinea Palestine Panama Paraguay Peru Philippines Poland Portugal Puerto Rico Qatar Romania Russia South Africa South Korea São Tomé Príncipe Saudi Arabia Serbia Seychelles Singapore Slovakia Slovenia Spain Sri Lanka St Lucia
Saint Vincent & The Grenadines Suriname
Sweden Switzerland Syria
Taiwan (Province of China) Tajikistan
Thailand Tonga
Trinidad and Tobago Tunisia
Turkey Turkmenistan United Arab Emirates UK
USA Ukraine Uruguay Uzbekistan Venezuela Virgin Islands Zimbabwe
45 41 45 45 46 47 45 47 49 49 49 48
47 46 39 31 30 34 36 35 36 37 36 35 34 33
65 58 56 60 57 83 55 52 47 40
49 56
20 22 19 20 19 21 28 27 21 13 13 13 12 11 13 10 10 10 11 13 11 9 11 11 8 9 9 9 7 7 9 10 13 9 8 37 31 27 28 26 25 26 22 22 23 24 21 23 25 25 25 29 28 22 22 20 17 17 17 17 16 16 14 15 15 15 15 16 15 13 26 25 23 22 22 21 21 20 19 18 17 17 17 17 16 16 16 15 14 13 12 13 12 12 12 12 12 13 12 12 12 12 12 12 11 11
13 13 11 11 11 12 12 19 18 20 21 20 16 11 8 8 7 6 4 4 3 3 3 3 4 3 4 4 3 3 2 3 3
21 96 96 96 96 94 6
30 33 31 32 29 27 30
55 55 53 54 56 51 21
25 34 26 14 25 24 22 25 18 17 24 19 25 25 23
12 12 14 15 15 14 14 13 14 15 15 15 15 17 17 17 16 16 16 17 18 18 18 18 17 17 17 17 17 17 17 16 17 17 17 17
5 5 5 5 5 5 5 5 5 5 6 6 5 6 5 5 5 5 3 3 4 4 4 4 4 4 4 4 4 4 4 4 4 4 5
22 23 21 22 22 22 23 23 17 15 14 15 13 12 11 11 11 12 13 13 11 11 9 10 9 92
22 21 22 22 22 22 11 11 11 11 12 12 12 13 13 13 12 12 13 13 14 14 14 15 15 16 16 17 17 17 17 17 18 19 18 16 16 16 45 59
18
46 36 37 37 40 43 42 33 33 33 35 31 29 29 29 27 26 27 25 26 26 25 24 23 26 25 30 29 18 16 15 15 13 15 16 15 16 14 14 15 17 17 16 17 16 36 35 37 39 40 39 35 36 36 34 34 32 26 28 26 32 31 33 32 30 32 32 28 27 24 26 25 24 23 21 22 21 21 23 23 24 26 50 53 49 49 51 52 46 50 42 41 43 40 36 31 33 32 30 30 61 64 24 25 27 26 25 25 25 24 21 27 26 25 24 21 24 20 21 22 23 24 28 25 26 26 25 22 22 22 20 20 15 18 20 21 15 15 15 15 15 15 18 38 37 37 39 39 40 40 40 40 40 40 40 40 40 40 39 39 28 26 26 26 26 26 26 26 27 28 29 29 27 29 30 31 29 29 30 30 23 23 24 24 25 24 24 24 24 25 25 25 26 26 26 26 26 24 21 22 25 24 26 23 23 22 22 21 22 21 18 25 23 27 26 26 26 25 27 29 29 29 29 30 30 17 17 17 17 17 17 17 17 16 17 16 16 16 17 16 16 16 15 15
86 86 30 100 35 100 100 36 33 32 35 40 34 38 39 42 37 39
23 23 24 24 24 24 22 22 22 22 22 23 23 17 16 17 17 16 16 15 15 15 15 15 14 14 14 14 14 14 15 15 15 15 16 16 19 18 18 22 22 17 15 15 15 10 12 13 14 15 16 16 16 16 15 15 15 13 12 12 12 12 11 11 11 11 12 12 13 13 15
40 39 35 35 34 34 33 32 32 33 33 33 33 33 33 33 32 32 33 31 32 32 29 27 28 24 22 23 24 25 26 25 25 21 19 15 16 17 19 19 18 19 19 19 19 18 18 31
45 46 45 48 49 50 48 48 52 53 54 54 55 57
21 21 22 21 21 20 22 17 17 18 17 17 17 20 19 20 22 22
29 29 34 35 30 24 24 24 25 25 25 23 23 27 24 22 24 23 23
13 13 11 11 12 10 11 10 16 12 10 6 5 5 5 5 5 4 5 5 5 5 5 5 8 7 7 7 7 8 8 8 3 2 2 2 19 18 17 19 19 19 19 17 15 16 16 15 15 17 24 19 10 10 11 7 8 8 8 9 10 10 15 14 9 8 9 10 11 11 8 10 10 11 12 12 12 12 15 14 13 12 12 12 12 12 13 14 14 24 23 24 24 22 23 22 21 21 21 21 20 20 20 19 19 19 17 17 17 17 17 17 17 17 17 17 17 18 16 15 15 15 15 15 48 48 55 48 50 50 49 54 53 53 56 56 52 53 50 48 45 45 44 40 39 39 37 36 39 37 33 35 35
42 38 31 38 34 34 41 34 31 29 30 30 31 31 27 29 33 24 20 24 25 21 29 27 29 16 21 16 16 17 15 32 28 46 38 32 41 37 22 27 24 21 22 15 18 15 18 15 17 12 12 21 28 22 19 20 16 12 17 46 42 34 33 31 31 29 33 32 31 31 32 29 31 29 28 28 24 21 20 20 22 23 17 17 19 17 18 19 21 21 23 12 13 13 14 14 14 14 11 12 11 12 12 12 13 13 13 13 13 14 14 14 14 14 14 14 14 14 15 15 15 17 16 16 15 15 16 31 31 31 31 31 31 31 31 31 32 32 32 32 32 32 16 16 16 15 16 16 16 16 16 16 15 14 14 13 14 14 14 15 14
71 78 80 52 46 45 47 46 40 32 40 36 32 34 25 40
61 61 62 62 62 62 60 60 62 60 60 55 57 15 17 17 18 17 16 15 15 15 17 17 23 26 26 24 21 21 20 23 31 28 30 32 33 36 34 36 34 32 32 33 34
62 62 63 64 64 65 66 64 60 60 60 59 60 59 62 62 60 58 52 48 53 54 54 54 54 54 52 49 47 44 41 46
21 19 18 18 18 19 18 17 18 17 19 18 19 18 19 19 20 20 20 10 10 10 9 9 10 10 11 12 12 12 11
26 35
54 56 55 55 54 56 56 56 54 56 56 57 57 55 57 54 53 55 56 63 60 62 61 62 20 20 20 22 15 12 13 13 13 15 15 17 20 17 18 17 20 20 21 25 28 17 15 16 15 15 17 19 20 20 20 20 22 21 24 24
51 49
6 7 7 6 6 6 6 6 6 6 6 6 6 7 8 8 8 9 9 9 9 9 9 9 9 9 9 9 9 9 9 8 8 8 8 8
10 10 10 11 11 12 13 12 12 11 10 11 11 11 11 11 11 12 12 12 12 12 12 12 13 13 13 13 13 13 13 13 13 13 13 14 14 12 12 14 16 18 22 23 23 21 19 19 19 18 17 16 16 16 17 18 18 13 13 12 12 11 11 10 10 10 24 23 23 25 26 25 25 25 25 24 24 21 26 25 26 26 20 21 22 20 20 21 22 22 21 22 23 23 24 24 26 24 24 16 16 14 15 15 16 15 15 16 16 17 17 17 19 20 20 20 19 20 23 24 12 11 9 10 10 10 11 13 28 28 28 20 30 30 27 26 26 18 18 19 18 13 13 13 12 11 10 11 11 11 10 11 11 11 12 11 11 11 11
23 10 10 11 10 11 10 11 12 11 11 10 12 12 9 11 13 14 14 18
25 39 20
0 10 20 30 40 50
example, the garbage code “cancer, unspecified” contains sufficient detail to be redistributed across all cancers (at Level 3 of the cause hierarchy). We distinguish four levels of garbage codes based on the levels of the GBD cause hierarchy across which they are redistributed. Major garbage codes are those that are redistributed across causes that span Levels 1 and 2 of the GBD cause hierarchy such as heart failure or sepsis. Figure 1 shows the proportion of major garbage codes in VR data by location-year. The fraction of deaths assigned to major garbage codes varies widely, even across high SDI countries. Because of the potential for bias, data sources with location-years with more than 50% of deaths assigned to major garbage codes were excluded from the GBD
Data completeness assessment
We assessed VR completeness by location-year as part of the GBD 2016 all-cause mortality analysis.21 Due to the
potential for selection bias in incomplete VR, we excluded VR sources that were less than 50% complete in any given location. We also characterised sources as nonrepresentative if they were estimated to be 50–70% com -plete. We used completeness estimates to inform variance of our statistical models, with lower completeness resulting in higher variance. Ultimately, all included sources were adjusted to 100% completeness by multiplying the cause fraction for a given location-age-sex-year by the estimated all-cause mortality for that location-age-sex-year. Appendix 1
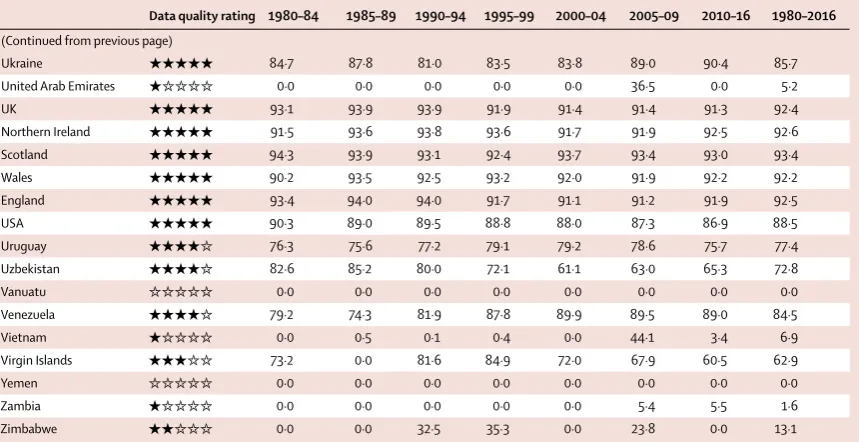
Data quality rating 1980–84 1985–89 1990–94 1995–99 2000–04 2005–09 2010–16 1980–2016
Afghanistan ✭✩✩✩✩ 0·0 0·0 0·0 0·0 4·6 33·5 0·0 5·4
Albania ✭✭✭✩✩ 0·0 65·9 67·0 71·3 65·8 56·8 45·0 53·1
Algeria ✭✩✩✩✩ 0·0 0·0 0·0 0·0 0·0 16·8 0·0 2·4
American Samoa ✭✭✭✩✩ 0·0 0·0 0·0 78·6 81·0 83·7 71·0 44·9
Andorra ✩✩✩✩✩ 0·0 0·0 0·0 0·0 0·0 0·0 0·0 0·0
Angola ✭✩✩✩✩ 0·0 0·0 0·0 0·0 0·0 0·0 4·3 0·6
Antigua and Barbuda ✭✭✭✭✩ 51·8 71·4 72·3 80·0 79·8 79·2 73·6 72·6
Argentina ✭✭✭✭✩ 76·5 69·8 68·5 67·6 66·7 65·6 67·8 68·9
Armenia ✭✭✭✭✩ 69·9 76·4 82·1 81·8 87·4 90·8 91·9 82·9
Australia ✭✭✭✭✭ 93·1 93·1 92·4 92·4 91·3 90·5 90·3 91·9
Austria ✭✭✭✭✭ 89·5 90·6 89·3 88·6 91·9 90·8 89·2 90·0
Azerbaijan ✭✭✭✩✩ 71·7 74·0 79·7 74·3 73·2 42·9 0·0 59·4
The Bahamas ✭✭✭✭✩ 74·6 79·7 63·8 78·0 80·2 79·8 77·6 76·3
Bahrain ✭✭✭✩✩ 0·0 76·5 0·0 62·2 55·0 51·8 63·8 44·2
Bangladesh ✭✭✩✩✩ 2·8 4·4 23·6 4·1 10·2 6·3 38·6 12·9
Barbados ✭✭✭✭✩ 72·6 73·6 72·5 70·7 75·8 82·1 81·4 75·5
Belarus ✭✭✭✭✩ 81·4 86·6 77·1 79·9 83·0 82·7 82·6 81·9
Belgium ✭✭✭✭✩ 77·0 77·2 81·1 84·1 83·1 83·0 80·2 80·8
Belize ✭✭✭✭✩ 54·0 56·9 46·8 76·9 71·6 80·7 84·7 67·4
Benin ✭✩✩✩✩ 0·0 0·6 0·0 0·0 0·0 0·0 0·0 0·1
Bermuda ✭✭✭✭✭ 89·0 86·5 84·7 90·9 89·4 86·4 90·5 88·2
Bhutan ✩✩✩✩✩ 0·0 0·0 0·0 0·0 0·0 0·0 0·0 0·0
Bolivia ✭✩✩✩✩ 0·0 0·0 0·0 0·0 12·4 0·0 0·0 1·8
Bosnia and Herzegovina ✭✭✩✩✩ 0·0 64·4 64·5 0·0 0·0 0·0 68·8 28·3
Botswana ✩✩✩✩✩ 0·0 0·0 0·0 0·0 0·0 0·0 0·0 0·0
Brazil ✭✭✭✭✩ 58·3 62·4 65·0 69·8 75·0 80·4 82·7 70·5
Brunei ✭✭✭✩✩ 0·0 0·0 0·0 85·4 82·9 81·9 81·8 47·4
Bulgaria ✭✭✭✭✩ 80·4 80·7 79·7 76·0 71·8 73·5 70·3 76·1
Burkina Faso ✭✩✩✩✩ 0·2 0·0 0·0 4·6 5·6 4·6 0·3 2·2
Burundi ✭✩✩✩✩ 0·0 0·0 2·3 0·0 0·0 0·0 0·0 0·3
Cambodia ✭✩✩✩✩ 0·0 0·0 0·0 0·0 1·6 3·5 0·0 0·7
Cameroon ✩✩✩✩✩ 0·0 0·0 0·0 0·0 0·0 0·0 0·0 0·0
Canada ✭✭✭✭✭ 88·6 89·8 88·3 88·2 89·6 90·1 90·1 89·3
Cape Verde ✭✭✩✩✩ 58·3 0·0 0·1 0·0 0·0 0·0 69·7 18·3
Central African Republic ✩✩✩✩✩ 0·0 0·0 0·0 0·0 0·0 0·0 0·0 0·0
(Continued from previous page)
Chad ✩✩✩✩✩ 0·0 0·0 0·0 0·0 0·0 0·0 0·0 0·0
Chile ✭✭✭✭✩ 75·5 75·1 76·6 84·8 90·9 90·3 90·0 83·3
China ✭✭✭✩✩ 0·0 0·0 71·7 70·5 73·0 72·6 69·3 51·0
Colombia ✭✭✭✭✩ 71·7 73·3 75·3 84·5 86·0 86·3 87·8 80·7
Comoros ✩✩✩✩✩ 0·0 0·0 0·0 0·0 0·0 0·0 0·0 0·0
Congo (Brazzaville) ✩✩✩✩✩ 0·0 0·0 0·0 0·0 0·0 0·0 0·0 0·0
Costa Rica ✭✭✭✭✭ 79·8 81·8 80·2 91·2 91·8 89·8 90·8 86·5
Côte d’Ivoire ✭✩✩✩✩ 0·0 1·0 1·0 0·0 0·0 0·2 0·2 0·4
Croatia ✭✭✭✭✩ 0·0 82·7 83·7 80·7 84·1 86·5 87·9 72·2
Cuba ✭✭✭✭✭ 84·6 84·6 83·2 88·3 90·1 91·0 91·5 87·6
Cyprus ✭✭✩✩✩ 0·0 0·0 0·0 28·7 58·3 66·7 66·5 31·5
Czech Republic ✭✭✭✭✩ 0·0 90·3 89·4 84·8 85·1 84·8 87·8 74·6
Democratic Republic
of the Congo ✭✩✩✩✩ 0·0 2·3 2·9 0·0 0·0 0·0 0·0 0·7
Denmark ✭✭✭✭✩ 80·6 78·8 84·0 86·7 85·3 84·1 84·6 83·5
Djibouti ✩✩✩✩✩ 0·0 0·0 0·0 0·0 0·0 0·0 0·0 0·0
Dominica ✭✭✭✭✩ 70·4 61·5 62·1 62·9 69·5 85·3 83·6 70·7
Dominican Republic ✭✭✭✩✩ 56·3 56·3 45·8 54·0 58·9 58·2 67·2 56·7
Ecuador ✭✭✭✭✩ 71·6 68·1 67·7 63·7 61·6 66·4 68·2 66·8
Egypt ✭✭✭✩✩ 33·3 46·9 43·7 0·0 42·9 40·6 48·4 36·5
El Salvador ✭✭✭✩✩ 72·8 0·0 57·8 63·4 65·6 66·6 64·0 55·7
Equatorial Guinea ✩✩✩✩✩ 0·0 0·0 0·0 0·0 0·0 0·0 0·0 0·0
Eritrea ✩✩✩✩✩ 0·0 0·0 0·0 0·0 0·0 0·0 0·0 0·0
Estonia ✭✭✭✭✭ 89·0 90·9 93·7 93·0 92·0 93·8 93·8 92·3
Ethiopia ✭✭✩✩✩ 0·0 1·1 2·3 0·6 4·8 46·6 45·5 14·4
Federated States of
Micronesia ✩✩✩✩✩ 0·0 0·0 0·0 0·0 0·0 0·0 0·0 0·0
Fiji ✭✭✩✩✩ 0·0 0·0 0·0 33·2 56·6 58·8 63·4 30·3
Finland ✭✭✭✭✭ 81·1 90·5 91·6 95·7 95·7 94·5 95·6 92·1
France ✭✭✭✭✩ 76·2 78·0 78·1 78·7 79·1 79·4 77·9 78·2
Gabon ✩✩✩✩✩ 0·0 0·0 0·0 0·0 0·0 0·0 0·0 0·0
Georgia ✭✭✭✭✩ 85·9 83·2 78·0 74·2 77·6 51·2 58·7 72·7
Germany ✭✭✭✭✩ 77·5 78·2 83·1 83·9 83·2 83·6 84·0 81·9
Ghana ✭✩✩✩✩ 0·0 0·1 1·6 0·9 8·6 20·8 0·5 4·6
Greece ✭✭✭✭✩ 79·7 81·1 71·3 71·9 72·2 76·5 74·1 75·3
Greenland ✭✭✭✩✩ 0·0 0·0 0·0 90·2 89·7 89·7 87·8 51·1
Grenada ✭✭✭✭✩ 69·9 61·4 62·0 60·7 77·3 76·3 83·8 70·2
Guam ✭✭✭✩✩ 0·0 0·0 89·0 85·9 77·1 71·8 66·1 55·7
Guatemala ✭✭✭✭✩ 79·2 70·5 71·5 70·8 67·9 70·7 73·4 72·0
Guinea ✭✩✩✩✩ 0·0 0·0 0·0 3·3 0·0 0·0 0·0 0·5
Guinea-Bissau ✭✩✩✩✩ 0·0 0·0 0·1 1·1 0·0 0·0 0·0 0·2
Guyana ✭✭✭✭✩ 51·5 71·7 64·0 66·2 79·0 77·7 73·5 69·1
Haiti ✭✩✩✩✩ 19·3 1·4 1·1 10·6 4·6 0·0 0·0 5·3
Honduras ✭✭✩✩✩ 31·7 36·9 35·6 0·4 0·0 12·4 13·9 18·7
Hungary ✭✭✭✭✭ 90·6 89·3 89·9 90·8 92·6 93·3 93·6 91·4
Iceland ✭✭✭✭✭ 91·3 92·8 94·0 94·1 93·5 92·8 91·4 92·8
India ✭✭✩✩✩ 3·6 3·5 3·7 4·9 5·2 52·8 49·1 17·5
Indonesia ✭✭✩✩✩ 0·1 0·0 1·3 0·4 0·1 42·8 56·7 14·5
Iran ✭✭✭✩✩ 13·3 13·0 0·0 31·3 91·5 60·7 71·7 40·2
Iraq ✭✩✩✩✩ 0·0 0·0 0·0 0·0 0·0 32·2 0·0 4·6
Ireland ✭✭✭✭✭ 90·1 91·1 91·5 90·7 90·6 92·5 92·4 91·3
(Continued from previous page)
Israel ✭✭✭✭✩ 80·9 81·7 82·8 83·3 81·8 80·2 79·0 81·4
Italy ✭✭✭✭✭ 88·5 87·8 87·7 87·3 88·2 88·7 87·7 88·0
Jamaica ✭✭✭✩✩ 64·6 66·1 55·8 0·0 68·4 77·2 75·7 58·3
Japan ✭✭✭✭✩ 82·5 80·8 80·5 87·6 84·9 84·3 81·2 83·1
Jordan ✭✭✩✩✩ 0·0 0·0 0·0 1·0 68·2 76·3 64·2 30·0
Kazakhstan ✭✭✭✭✩ 76·3 81·5 89·5 89·0 82·2 77·8 86·1 83·2
Kenya ✭✩✩✩✩ 0·0 2·8 0·0 0·5 5·1 5·4 0·8 2·1
Kiribati ✭✭✩✩✩ 0·0 0·0 43·7 69·1 34·4 0·0 0·0 21·0
Kuwait ✭✭✭✭✩ 81·5 82·0 75·6 78·1 83·4 85·0 83·5 81·3
Kyrgyzstan ✭✭✭✭✩ 71·0 76·4 71·0 73·0 85·9 87·7 90·9 79·4
Laos ✭✩✩✩✩ 0·0 1·3 0·0 0·0 0·0 0·0 0·0 0·2
Latvia ✭✭✭✭✭ 90·6 91·4 87·9 92·0 91·1 89·2 93·8 90·8
Lebanon ✭✩✩✩✩ 0·0 2·2 0·0 0·0 0·0 0·0 0·0 0·3
Lesotho ✩✩✩✩✩ 0·0 0·0 0·0 0·0 0·0 0·0 0·0 0·0
Liberia ✭✩✩✩✩ 2·2 2·3 3·6 0·0 0·0 0·0 0·0 1·2
Libya ✭✩✩✩✩ 0·0 0·0 0·0 0·0 0·0 3·6 0·0 0·5
Lithuania ✭✭✭✭✭ 87·6 92·2 91·7 94·7 92·6 93·1 94·4 92·3
Luxembourg ✭✭✭✭✩ 86·4 86·7 85·3 84·9 82·2 78·2 82·0 83·7
Macedonia ✭✭✭✩✩ 0·0 0·0 80·1 81·5 81·6 78·9 74·6 56·7
Madagascar ✭✩✩✩✩ 2·7 3·3 2·3 2·2 0·0 0·0 0·0 1·5
Malawi ✭✩✩✩✩ 0·0 2·8 0·0 0·6 2·2 3·8 0·4 1·4
Malaysia ✭✭✩✩✩ 19·3 0·0 0·0 32·0 36·5 40·8 0·0 18·4
Maldives ✭✭✩✩✩ 0·0 0·0 0·0 0·0 44·1 48·4 60·2 21·8
Mali ✭✩✩✩✩ 4·3 0·0 0·1 0·0 0·0 0·0 0·0 0·6
Malta ✭✭✭✭✭ 81·0 84·5 88·4 90·0 89·0 93·0 90·9 88·1
Marshall Islands ✩✩✩✩✩ 0·0 0·0 0·0 0·0 0·0 0·0 0·0 0·0
Mauritania ✩✩✩✩✩ 0·0 0·0 0·0 0·0 0·0 0·0 0·0 0·0
Mauritius ✭✭✭✭✩ 73·8 78·5 78·7 78·2 83·0 84·7 85·3 80·3
Mexico ✭✭✭✭✩ 65·2 71·9 72·7 76·7 79·4 81·7 88·1 76·5
Moldova ✭✭✭✭✭ 83·9 87·1 77·2 84·8 90·0 89·6 90·3 86·1
Mongolia ✭✭✩✩✩ 0·0 0·0 62·9 0·0 3·3 4·6 81·4 21·8
Montenegro ✭✭✩✩✩ 0·0 0·0 0·0 0·0 70·6 72·9 0·0 20·5
Morocco ✭✩✩✩✩ 0·0 17·0 0·0 0·0 0·0 37·9 14·3 9·9
Mozambique ✭✩✩✩✩ 0·0 0·0 0·0 0·1 7·0 56·6 0·0 9·1
Myanmar ✭✩✩✩✩ 0·0 0·0 0·0 0·0 0·0 2·8 0·0 0·4
Namibia ✩✩✩✩✩ 0·0 0·0 0·0 0·0 0·0 0·0 0·0 0·0
Nepal ✭✩✩✩✩ 2·9 2·7 0·0 0·6 0·6 8·9 0·0 2·2
Netherlands ✭✭✭✭✩ 88·2 85·8 84·9 84·0 82·3 83·3 83·3 84·5
New Zealand ✭✭✭✭✭ 95·2 95·0 94·7 96·7 96·4 96·3 95·7 95·7
Nicaragua ✭✭✭✩✩ 0·0 55·8 59·4 66·1 71·7 78·7 84·9 59·5
Niger ✭✩✩✩✩ 0·0 0·0 0·0 0·0 0·0 35·9 0·0 5·1
Nigeria ✭✩✩✩✩ 0·0 0·0 4·0 0·0 0·0 0·1 3·8 1·1
North Korea ✩✩✩✩✩ 0·0 0·0 0·0 0·0 0·0 0·0 0·0 0·0
Northern Mariana Islands ✭✭✭✩✩ 0·0 0·0 0·0 75·3 75·3 72·3 55·2 39·7
Norway ✭✭✭✭✭ 78·6 89·2 88·4 88·3 86·4 84·2 83·0 85·4
Oman ✭✭✩✩✩ 0·0 0·0 0·0 0·0 0·0 71·0 33·0 14·9
Pakistan ✭✩✩✩✩ 0·0 2·9 1·4 0·0 0·8 11·5 0·0 2·4
Palestine ✭✭✩✩✩ 0·0 0·0 0·0 29·0 29·1 28·2 29·7 16·6
Panama ✭✭✭✭✩ 69·2 71·6 0·0 79·0 82·2 84·1 84·1 67·2
Papua New Guinea ✭✩✩✩✩ 8·2 3·4 0·0 0·0 0·0 0·0 0·0 1·7
(Continued from previous page)
Paraguay ✭✭✭✩✩ 55·1 51·4 59·0 62·6 60·0 62·6 65·7 59·5
Peru ✭✭✭✩✩ 58·9 34·4 36·5 48·2 60·3 60·2 60·4 51·3
Philippines ✭✭✭✭✩ 71·7 73·8 65·8 65·9 72·6 72·4 71·8 70·6
Poland ✭✭✭✭✩ 62·5 60·3 60·4 71·6 74·2 73·6 71·9 67·8
Portugal ✭✭✭✭✩ 76·8 77·1 76·1 74·2 78·8 77·5 79·8 77·2
Puerto Rico ✭✭✭✭✩ 77·1 74·6 79·9 83·4 84·0 84·0 84·7 81·1
Qatar ✭✭✩✩✩ 8·4 10·0 0·0 51·6 48·2 56·2 44·0 31·2
Romania ✭✭✭✭✩ 77·4 78·5 83·3 84·8 85·5 86·2 85·5 83·0
Russia ✭✭✭✭✭ 81·6 88·4 87·8 84·6 87·6 88·9 88·4 86·8
Rwanda ✭✩✩✩✩ 0·0 0·0 0·0 0·0 0·0 2·5 0·0 0·4
Saint Lucia ✭✭✭✭✩ 69·3 66·2 70·6 72·5 79·2 78·4 85·2 74·5
Saint Vincent and the
Grenadines ✭✭✭✭✩ 71·6 61·1 58·6 79·0 81·0 83·0 87·5 74·5
Samoa ✩✩✩✩✩ 0·0 0·0 0·0 0·0 0·0 0·0 0·0 0·0
Saõ Tomé and Príncipe ✭✩✩✩✩ 0·0 69·0 0·0 0·0 0·0 0·0 0·0 9·9
Saudi Arabia ✭✭✩✩✩ 0·0 0·0 0·0 26·3 31·7 34·6 34·5 18·2
Senegal ✭✩✩✩✩ 2·0 2·4 2·6 2·5 0·0 0·0 0·0 1·4
Serbia ✭✭✭✩✩ 0·0 0·0 0·0 73·1 75·1 79·7 77·9 43·7
Seychelles ✭✭✭✩✩ 69·9 63·6 0·0 0·0 75·9 77·0 78·1 52·1
Sierra Leone ✭✩✩✩✩ 0·0 0·0 3·8 0·0 0·0 0·0 0·0 0·5
Singapore ✭✭✭✭✭ 89·1 89·6 95·0 95·3 95·1 92·5 97·8 93·5
Slovakia ✭✭✭✩✩ 0·0 0·0 82·4 82·7 85·2 90·3 92·9 61·9
Slovenia ✭✭✭✭✩ 0·0 89·4 91·1 88·8 88·3 87·4 87·3 76·0
Solomon Islands ✩✩✩✩✩ 0·0 0·0 0·0 0·0 0·0 0·0 0·0 0·0
Somalia ✩✩✩✩✩ 0·0 0·0 0·0 0·0 0·0 0·0 0·0 0·0
South Africa ✭✭✩✩✩ 0·0 0·0 0·8 45·2 51·9 52·6 57·0 29·6
South Korea ✭✭✭✩✩ 0·0 57·8 74·6 75·3 84·6 81·5 80·9 65·0
South Sudan ✩✩✩✩✩ 0·0 0·0 0·0 0·0 0·0 0·0 0·0 0·0
Spain ✭✭✭✭✩ 76·7 78·9 80·1 83·3 83·2 84·0 85·4 81·7
Sri Lanka ✭✭✭✩✩ 51·8 50·9 46·5 55·5 63·6 67·4 65·5 57·3
Sudan ✩✩✩✩✩ 0·0 0·0 0·0 0·0 0·0 0·0 0·0 0·0
Suriname ✭✭✭✩✩ 59·7 62·1 58·6 58·5 66·0 64·9 65·1 62·1
Swaziland ✭✩✩✩✩ 0·0 0·0 0·0 0·0 0·0 0·0 0·0 0·0
Sweden ✭✭✭✭✭ 87·6 88·4 88·0 87·0 85·9 85·4 84·8 86·7
Switzerland ✭✭✭✭✩ 69·3 69·2 68·3 84·6 84·4 86·6 86·1 78·4
Syria ✭✭✭✩✩ 29·2 15·8 0·0 54·5 59·2 70·0 59·6 41·2
Taiwan (province of
China) ✭✭✭✩✩ 0·0 0·0 37·2 37·3 39·4 83·9 84·5 40·3
Tajikistan ✭✭✭✩✩ 67·1 61·0 68·8 53·7 46·4 47·7 0·0 49·2
Tanzania ✭✩✩✩✩ 0·0 3·1 1·9 1·8 4·9 2·6 0·0 2·1
Thailand ✭✭✭✩✩ 28·4 27·1 33·9 47·7 47·7 52·0 57·5 42·1
The Gambia ✭✩✩✩✩ 3·2 2·6 2·5 1·1 0·9 1·3 0·0 1·7
Timor-Leste ✩✩✩✩✩ 0·0 0·0 0·0 0·0 0·0 0·0 0·0 0·0
Togo ✩✩✩✩✩ 0·0 0·0 0·0 0·0 0·0 0·0 0·0 0·0
Tonga ✭✩✩✩✩ 0·0 0·0 0·0 0·0 53·6 0·0 0·0 7·7
Trinidad and Tobago ✭✭✭✭✭ 79·2 80·3 81·4 89·6 90·5 89·6 89·0 85·7
Tunisia ✭✩✩✩✩ 0·0 0·0 0·0 0·0 0·0 28·8 24·7 7·6
Turkey ✭✭✭✩✩ 16·9 20·7 22·1 24·9 37·4 72·8 84·4 39·9
Turkmenistan ✭✭✭✭✩ 83·9 86·0 79·7 74·1 65·5 66·8 70·6 75·2
Uganda ✭✩✩✩✩ 0·0 0·0 0·0 0·0 0·0 2·7 0·0 0·4
(p 291) shows VA and VR availability and completeness by country from 1980 to 2016.
For GBD 2016, we developed a rating system that applies a level of 0 to 5 stars to describe the quality of data available for each country over the full time series from 1980 to 2016. These ratings were not used to directly adjust estimates; instead they provide context for interpreting the overall reliability of cause of death estimation for a location. Ratings were based on the fraction of deaths “well certified” in each location and time period; the latter was defined by six 5-year intervals and a terminal interval of seven years from 2000 to 2016. To qualify as well certified for each interval, we multiplied three measures: (1) completeness of death registration; (2) fraction of deaths not assigned to major garbage codes; and (3) fraction of deaths assigned to detailed GBD causes. Subnational VA data were multiplied by 0·10 because they might differ substantially from national results if they were available. VA data were further adjusted by 0·64, or the published chance-corrected concordance for physician-certified VA compared with medical certification of death.23 The percent of data well
certified by location is provided in table 1; additional details on the selection of adjustment factors are in appendix 1 (p 31). By location and time interval, we assigned the following stars using bins that were arbitrarily selected but meant to capture a range of quality from highest to lowest: 5 stars if percent of data well certified equaled or
for 35% to less than 65%; 2 stars for 10% to less than 35%; 1 star for greater than 0% to less than 10%; and 0 stars for 0%. More detail on the calculations is provided in appendix 1 (p 31).
Cause of death estimation
In GBD, the vast majority of cause of death estimates are modelled using the Cause of Death Ensemble model (CODEm). Due to their unique epidemiology or known biases, a subset of causes of death are modelled using alternative estimation strategies: negative binomial models for relatively rare causes, incidence and case fatality models, subcause proportion models, and prevalence-based models. The estimation of HIV/AIDS also requires a different modelling approach;21 and in
previous publications.3,21,24 Due to lags in reporting,
estimates for the most recent years rely more on the modelling process. Additional details on CODEm and all alternative estimation strategies are provided below and in appendix 1 (p 33 and p 35).
Major methodological changes from GBD 2015 were made for several models in GBD 2016: the distribution of antiretroviral therapies (ART) in countries with high HIV/AIDS prevalence were modelled based on an empirical pattern derived from household studies rather than on the assumption that ART was allocated to those individuals most in need; tuberculosis was modelled for
(Continued from previous page)
Ukraine ✭✭✭✭✭ 84·7 87·8 81·0 83·5 83·8 89·0 90·4 85·7
United Arab Emirates ✭✩✩✩✩ 0·0 0·0 0·0 0·0 0·0 36·5 0·0 5·2
UK ✭✭✭✭✭ 93·1 93·9 93·9 91·9 91·4 91·4 91·3 92·4
Northern Ireland ✭✭✭✭✭ 91·5 93·6 93·8 93·6 91·7 91·9 92·5 92·6
Scotland ✭✭✭✭✭ 94·3 93·9 93·1 92·4 93·7 93·4 93·0 93·4
Wales ✭✭✭✭✭ 90·2 93·5 92·5 93·2 92·0 91·9 92·2 92·2
England ✭✭✭✭✭ 93·4 94·0 94·0 91·7 91·1 91·2 91·9 92·5
USA ✭✭✭✭✭ 90·3 89·0 89·5 88·8 88·0 87·3 86·9 88·5
Uruguay ✭✭✭✭✩ 76·3 75·6 77·2 79·1 79·2 78·6 75·7 77·4
Uzbekistan ✭✭✭✭✩ 82·6 85·2 80·0 72·1 61·1 63·0 65·3 72·8
Vanuatu ✩✩✩✩✩ 0·0 0·0 0·0 0·0 0·0 0·0 0·0 0·0
Venezuela ✭✭✭✭✩ 79·2 74·3 81·9 87·8 89·9 89·5 89·0 84·5
Vietnam ✭✩✩✩✩ 0·0 0·5 0·1 0·4 0·0 44·1 3·4 6·9
Virgin Islands ✭✭✭✩✩ 73·2 0·0 81·6 84·9 72·0 67·9 60·5 62·9
Yemen ✩✩✩✩✩ 0·0 0·0 0·0 0·0 0·0 0·0 0·0 0·0
Zambia ✭✩✩✩✩ 0·0 0·0 0·0 0·0 0·0 5·4 5·5 1·6
Zimbabwe ✭✭✩✩✩ 0·0 0·0 32·5 35·3 0·0 23·8 0·0 13·1
Maximum values of percent well certified within each 5-year interval, as well as a data quality rating from 0 to 5 stars and the percent well certified over the entire time series (1980–2016) are shown for each country. “Percent well certified” is calculated as described in appendix 1 (p 31). Values of 0 indicate no vital registration or verbal autopsy data with sufficient detail for the 5-year interval. Countries are given 0 to 5 stars depending on the percent well certified for the full time series (1980–2016).Classification is as follows: 85–100%, 5 stars; 65–84%, 4 stars; 35–64%, 3 stars; 10–34%, 2 stars; >0–9%, 1 star; 0%, 0 stars. Instances in the table that show 1 star despite all zeros in percent well certified are a result of very small values that round to 0 at one decimal place.
Table 1: Data quality rating from 0 to 5 stars, maximum percent well certified per 5-year interval and percent well certified across time series by country, 1980–2016
[image:11.595.45.475.131.352.2]estimated using a pixel-level geospatial model, while malaria outside of Africa was estimated using a new suite of spatiotemporal covariates in CODEm; and cancer mortality-to-incidence data inclusion and modelling were revised to better capture the likely effects of worse access to treatment in lower-SDI settings.
CODEm
CODEm, used for 177 causes of death for GBD 2016, is the GBD cause of death estimation approach in which a large number of model specifications are systematically tested in terms of functional forms and permutations of relevant covariates which are subsequently used to predict true levels for each cause of death.25,26 CODEm uses multiple
iterations of cross-validation tests to evaluate the out-of-sample predictive validity of model variants that met predetermined requirements for direction and significance of regression coefficients. These models were then combined into a weighted ensemble model, with models performing best on out-of-sample prediction error of both levels and trends weighted highest. Additional details of the methods used to develop these ensemble models are provided in appendix 1 (p 33). Independent CODEm models were run for each cause of death by sex, and separately for countries with and without extensive complete VR data. All data were included in models for countries without extensive VR coverage to enhance predictive validity; data from countries without extensive VR coverage were excluded from models for countries with this coverage to avoid inflation of uncertainty.
Negative binomial models
We used negative binomial models for nine causes of death (other intestinal infectious diseases; upper res-piratory infections; diphtheria; varicella and herpes zoster; schistosomiasis; cysticercosis; cystic echino-coccosis; ascariasis; and iodine deficiency) for which death counts are typically very low, or might frequently have zero counts in high-SDI countries.
Incidence and case fatality models
For causes in locations with insufficient data from VR or VA data, we used incidence and case fatality models— also known as natural history models—separately estimating incidence and case fatality rates and then combining them to produce estimates of cause-specific mortality. We used incidence and case fatality models for 14 causes: measles; visceral leishmaniasis; African trypanosomiasis; yellow fever; syphilis (congenital); typhoid fever; paratyphoid fever; whooping cough; Zika virus disease; and acute hepatitis A, B, C, and E. We also used an incidence and case fatality model for malaria incidence in sub-Saharan Africa as produced by the Malaria Atlas Project and age-sex-specific case fatality
cancer, cirrhosis, and chronic kidney disease—data other than VR data provide considerable additional detail (eg, end-stage renal disease registries), or data are reported in too few places to be modelled directly in the CODEm framework. In these cases, we first estimated the parent cause using CODEm and then estimated subcauses by each age-sex-location-year using the Bayesian meta-regression tool DisMod-MR 2.1, developed for the GBD studies.21,26,28
Prevalence-based models
An increased likelihood of reporting Alzheimer’s disease and other dementias, Parkinson’s disease, and atrial fibrillation and flutter as underlying causes of death on death certificates has resulted in an apparent large increase in death rates associated with these diseases. The absence of a parallel increase of the same magnitude in reported rates of age-specific prevalence of these diseases supports the view that these changes are reporting artefacts rather than true changes in epidemiology. Because the redistribution algorithms used to build the cause of death database for previous iterations of GBD did not seem to adequately capture this trend in death certification over time for these causes, estimates for these three causes for GBD 2016 were derived from prevalence surveys and from estimates of excess mortality based on deaths certified in countries with the greatest proportion of deaths allocated to the correct underlying cause of death in recent years. The derivation of cause-specific mortality rates from prevalence and excess mortality models was completed in DisMod-MR 2.1.
CoDCorrect algorithm for combining estimates
After generating underlying cause of death estimates and accompanying uncertainty, we combined these models into estimates that are consistent with the levels of all-cause mortality estimated for each age-sex-year-location group using a cause of death correction procedure (CoDCorrect). Using 1000 draws from the posterior distribution of each cause and 1000 draws from the posterior distribution of the estimation of all-cause mortality, we used CoDCorrect to rescale the sum of cause-specific estimates to equal the draws from the all-cause distribution (appendix 1 p 280). We introduced a change in the CoDCorrect algorithm to take into account that deaths from Alzheimer’s disease and Parkinson’s diseases are more likely miscoded to lower respiratory infections, protein-energy malnutrition, other nutritional deficiencies, cerebrovascular disease, interstitial nephritis and urinary tract infections, decubitus ulcer, and pul-monary aspiration and foreign body in airway than other causes (see appendix 1 p 279 for details).29–31
VR data for locations assigned a 4-star or 5-star data quality rating over the period from 1980 to 2016. For locations with a 3-star rating or lower (122 of 195 locations), we used the Uppsala Conflict Data Program for military operations and terrorism;14 the Centre for
Research on the Epidemiology of Disasters’ International Emergency Disasters Database for natural disasters, transport accidents, fires, exposure to mechanical forces (eg, building collapses, explosions), and famine;32 and the
Global Infectious Diseases and Epidemiology Network for cholera and meningococcal meningitis. The latter two infectious diseases were included as fatal discontinuities for GBD 2016 because CODEm smooths year-to-year irregularities in deaths from these causes and thus risks underestimating their effects. There is frequently a lag in reporting and data publishing for the most recent years, so we used supplementary data sources, including news reports, when gaps existed for known fatal discontinuities. Detail on the data and analytic approaches used for fatal discontinuities is available in appendix 1 (p 39).
YLL computation
As for GBD 2015, we calculated the years of life lost (YLLs)—a measure of premature mortality—from the sum of each death multiplied by the standard life expectancy at each age. For GBD 2016, the standard life expectancy at birth was 86·6 years, derived from the lowest observed risk of death for each 5-year age group; to avoid problems associated with small numbers, we restricted this to all populations greater than 5 million individuals in 2016. Age-standardised mortality rates and YLL rates were computed using the world standard population developed for the GBD study,3 which is a
time-invariant standard. Details of these calculations are available in appendix 1 (p 281).
Uncertainty analysis
Point estimates for each quantity of interest were derived from the mean of the draws, while 95% uncertainty intervals (UIs) were derived from the 2·5th and 97·5th percentiles. Uncertainty in the estimation is attributable to sample size variability within data sources, different availability of data by age, sex, year, or location, and cause-specific model cause-specifications. We determined UIs for components of cause-specific estimation based on 1000 draws from the posterior distribution of cause-specific mortality by age, sex, and location for each year included in the GBD 2016 analysis. In this way, uncertainty could be quantified and propagated into the final quantities of interest. Limits on computational resources mean we do not propagate uncertainty in the covariates used by cause of death models. We remain unable to incorporate uncertainty from garbage code redistribution algorithms into our final estimates. When
rate increased (or decreased) in at least 95% of the draws. Future methodological improvements that allowed the incorporation of more sources of uncertainty could result in currently marginally significant results no longer being significant within our definition.
Role of the funding source
The funder of the study had no role in the study design, data collection, data analysis, data interpretation, or the writing of the report. All authors had full access to the data in the study and had final responsibility for the decision to submit for publication.
Results
Data quality rating
We applied a rating system scored with stars to describe the quality of data available by locations over the full time series from 1980 through 2016. Using this rating system, 25 countries were assigned 5 stars, 48 countries had 4 stars, 30 countries had 3 stars, 21 countries had 2 stars, and 44 countries were assigned 1 star (figure 2). While most countries with a 5-star time series rating were high-SDI countries, some high-high-SDI countries were rated at 4 stars, such as France, Poland, and Puerto Rico. Some high-middle-SDI countries such as Argentina, Brazil, and Israel also received data quality ratings of 4 stars. A rating of 0 stars was assigned to 27 countries where no VA or VR data were available over the period from 1980 to2016.
Global causes of death
Cause-specific mortality estimates in each year of the GBD estimation period 1980–2016 by age and sex are available through an online results tool and through the previously mentioned data visualisation tool. Global estimates of total deaths and YLLs and age-standardised death and YLL rates by cause across all levels of the GBD cause hierarchy for the years 2006 and 2016, as well as the percentage change in mortality over that time period, are shown in table 2. Globally, CMNN causes resulted in 19·3% (95% UI 18·5–20·4) of the total deaths in 2016 (10·6 million [10·1 million to 11·1 million]). NCDs accounted for 72·3% (95% UI71·2–73·2) of global deaths in 2016, or 39·5 million deaths (38·8 million to 40·3 million), and injuries caused 8·43% (8·00–8·67) of global deaths that year, or 4·61 million deaths (4·36 million to 4·77 million). Both the total number of deaths and age-standardised rates from CMNN causes decreased from 2006 to 2016; total CMNN deaths decreased by 23·9% (95% UI 21·6–26·1), while age-standardised death rates decreased by 32·3% (30·3–34·2). While total NCD deaths increased from 2006 to 2016, rising 16·1% (95% UI 14·2–18·0)—an additional 5·47 million deaths— the global age-standardised NCD death rate decreased 12·1% (10·6–13·4), to 614·1 deaths (603·0–625·3) per 100 000 in 2016. Total deaths due to injuries varied
For the online results tool see http://ghdx.healthdata.org/gbd-2016
(95% UI 4·35 million to 4·71 million) to 4·61 million deaths (4·36 million to 4·77 million); at the same time, age-standardised injury death rates decreased by 14·4% (12·0–16·5) to 64·4 deaths (60·7–66·6) per 100 000 in 2016.
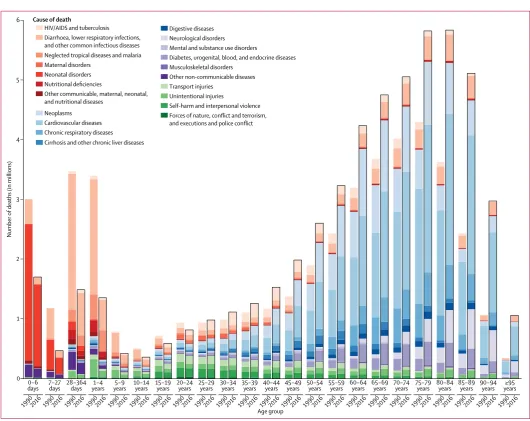
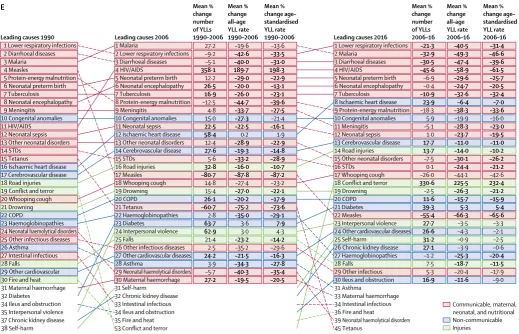
Figure 3 shows the number of deaths in 1990 and 2016 by GBD age group for the 21 GBD Level 2 causes. Total deaths declined in the age group intervals of 0–6 days, 7–27 days, 28–364 days, 1–4 years, 5–9 years, 10–14 years, 15–19 years, and 20–24 years, and increased by more than 60% in age groups 80–84 years, 85–89 years, 90–94 years, and 95 years and older. Shifts at age 90 and older were the most substantial, with a 17·8% (95 UI 176–181) increase in the number of deaths in the 90–94 age group and 210% (208–212) in age 95 years and older, illustrating a profound shift toward deaths at older ages since 1990. Between 1990 and 2016, the global number of deaths from cardiovascular diseases for people aged older than 70 years increased by 53·7% (95% UI 49·3–57·8) to 11·1 million deaths (10·9 million to 11·4 million). Notably, deaths from neoplasms also increased for older ages, rising 86·3% (95% UI 81·0–90·5) to 3·93 million deaths (3·85 million
of deaths for those aged older than age 70 years that increased by more than 90% were neurological disorders; diabetes, urogenital, blood, and endocrine diseases; un-intentional injuries; other non-communicable diseases; musculoskeletal disorders; and mental and substance use disorders.
Communicable, maternal, neonatal, and nutritional diseases
[image:14.595.31.558.129.442.2]Generally, communicable diseases decreased as a leading source of death, and much of this decrease was driven by reductions in large contributors to global mortality, including HIV/AIDS, malaria, tuberculosis, and diarrhoeal diseases (table 2). Overall, HIV/AIDS deaths decreased by 45·8% (95% UI 43·7–47·7) from 1·91 million deaths (1·81–2·00) in 2006 to 1·03 million deaths (987 000 to 1·08 million) in 2016. This decrease in absolute mortality level was accompanied by a large decrease in the global age-standardised HIV/AIDS death rate, which dropped 52·8% (95% UI 51·0–54·4) from 29·0 deaths (27·6–30·3) per 100 000 in 2006 to 13·7 deaths (13·1–14·3)
Figure 2: Classification of national time series of vital registration and verbal autopsy data, 1980–2016, on the basis of the fraction of deaths well certified and assigned to a detailed GBD cause Only vital registration data and verbal autopsy data were considered for this metric, and a country with no data in this form received 0 stars. Verbal autopsy data were down-weighted as a whole, to represent lower accuracy in cause of death ascertainment, and studies which were not nationally representative were significantly down-weighted for the star rating. Stars were assigned in proportion to completeness, percentage of deaths assigned to major garbage codes, time series availability, age and sex coverage, and geographical coverage. GBD=Global Burden of Disease. ATG=Antigua and Barbuda. FSM=Federated States of Micronesia. LCA=Saint Lucia. TLS=Timor-Leste. TTO=Trinidad and Tobago. VCT=Saint Vincent and the Grenadines.
Persian Gulf
Caribbean LCA
Dominica ATG
TTO Grenada VCT
TLS Maldives Barbados
Seychelles Mauritius Comoros
West Africa Eastern Mediterranean
Malta
Singapore Balkan Peninsula Tonga
Samoa FSM
Fiji Solomon Isl Marshall Isl
Vanuatu Kiribati
(0 stars)
★ (1 star)
★★ (2 stars)
★★★ (3 stars)
★★★★ (4 stars)
★★★★★ (5 stars)
To download the data in this table, please visit the Global Health Data Exchange (GHDx)
2016 Percent change
2006–16 2016 Percent change 2006–16 2016 Percent change 2006–16 2016 Percent change 2006–16
All causes 54 698·6
(54 028·7 to 55 514·9)
4·1
(2·8 to 5·6)* (822·7 to 832·7 845·0)
–16·8 (–17·9 to –15·7)*
1 585 865·0 (1 559 573·0 to 1 613 799·5)
–11·8 (–13·4 to –10·2)*
22 562·3 (22 192·0 to 22 966·1)
–23·0 (–24·4 to –21·6)* Communicable, maternal,
neonatal, and nutritional disorders
10 558·0 (10 097·7 to 11 143·4)
–23·9 (–26·1 to –21·6)*
154·1 (147·1 to 163·1)
–32·3 (–34·2 to –30·3)*
566 351·5 (544 844·2 to 589 177·0)
–31·1
(–33·5 to –28·7)* (7714·9 8021·0 to 8343·2)
–35·1 (–37·3 to –32·8)*
HIV/AIDS and
tuberculosis (2172·8 to 2246·8 2314·5)
–34·7*
(–36·5 to –32·9) (30·0 to 31·9)31·0 (–46·3 to –44·8 –43·3)*
94 262·2 (91 006·5 to 97 422·8)
–38·0 (–39·4 to –36·3)*
1263·3 (1220·8 to 1304·4)
–45·8 (–47·1 to –44·4)*
Tuberculosis 1213·1
(1161·5 to 1265·4)
–20·9
(–24·5 to –17·9)* (16·5 to 18·1)17·3 (–39·2 to –36·1 –33·8)*
40 718·8
(38 983·5 to 42 538·2) (–27·7 to –22·0)*–24·9 (530·4 to 579·1)554·3 (–38·9 to –34·1)*–36·5
Drug–susceptible
tuberculosis (1055·6 1105·9 to 1158·5)
–20·6
(–24·1 to –17·7)* (15·1 to 16·5)15·8 (–38·8 to –35·9 –33·5)*
37 134·8
(35 422·4 to 38 932·7) (–27·3 to –21·4)*–24·5 (482·1 to 530·0)505·7 (–38·6 to –33·6)*–36·2
Multidrug–resistant tuberculosis without extensive drug resistance
96·2
(80·0 to 113·3) (–35·6 to –21·5)*–28·9 (1·1 to 1·6)1·4 (–47·9 to –42·4 –36·5)*
3221·6
(2688·6 to 3805·5) (–39·1 to –25·4)*–32·7 (36·5 to 51·8)43·8 (–48·6 to –37·0)*–43·2
Extensively drug–resistant tuberculosis
10·9
(8·9 to 13·2) (45·9 to 92·7)*67·6 (0·1 to 0·2)0·2 (19·1 to 56·3)*36·4 (294·9 to 439·4)362·4 (34·8 to 80·7)*56·1 (4·0 to 5·9)4·9 (13·7 to 52·2)*31·4
HIV/AIDS 1033·8
(987·4 to 1081·6)
–45·8
(–47·7 to –43·7)* (13·1 to 14·3)13·7 (–54·4 to –52·8 –51·0)*
53 543·4 (50 984·7 to 56 292·0)*
–45·2
(–47·0 to –43·2)* (675·5 to 743·9)708·9 (–52·9 to –49·5)*–51·3
Drug–susceptible HIV/AIDS - tuberculosis
215·7
(148·7 to 288·6) (–55·4 to –50·0)*–52·7 (2·0 to 3·8)2·9 (–61·5 to –59·1 –56·9)*
11 308·6
(7797·9 to 15 096·2)* (–54·7 to –49·4)*–52·0 (103·5 to 200·3)150·0 (–59·8 to –55·1)*–57·4
Multidrug–resistant HIV/AIDS - tuberculosis without extensive drug resistance
18·4
(11·2 to 27·7) (–62·2 to –43·7)*–53·5 (0·1 to 0·4)0·2 (–67·5 to –51·2)*–59·9 (586·3 to 1472·2)*967·9 (–61·9 to –41·4)*–52·5 (7·8 to 19·6)12·8 (–66·2 to –47·9)*–57·8
Extensively drug– resistant HIV/AIDS - tuberculosis
1·2
(0·7 to 1·8) (26·4 to 67·0)*44·7 (0·0 to 0·0)0·0 (9·7 to 45·1)*25·7 (34·0 to 88·7)*56·8 (25·1 to 64·9)*43·0 (0·4 to 1·2)0·7 (10·4 to 45·8)*26·3
HIV/AIDS resulting
in other diseases (713·4 to 890·1)798·5 (–46·1 to –40·5)*–43·4 (9·4 to 11·7)10·6 (–53·0 to –50·6 –48·1)*
41 210·1
(36 586·4 to 46 337·7) (–45·4 to –40·1)*–42·8 (484·2 to 612·9)545·3 (–51·4 to –46·8)*–49·2
Diarrhoea, lower respiratory infections, and other common infectious diseases
4805·2 (4381·2 to 5480·6)
–18·4 (–21·9 to –14·2)*
72·7
(66·2 to 83·1) (–32·4 to –29·6 –26·0)*
209 304·9 (195 330·8 to 228 343·1)
–34·1
(–37·7 to –30·1)* (2796·5 2994·1 to 3264·0)
–38·4 (–41·6 to –34·8)*
Diarrhoeal diseases 1655·9 (1244·1 to 2366·6)
–24·2
(–32·2 to –14·2)* (18·8 to 36·0)25·1 (–42·4 to –35·9 –27·2)*
66 908·7
(56 202·7 to 85 858·5) (–43·7 to –30·4)*–37·4 (806·3 to 1230·0)959·5 (–47·6 to –36·2)*–42·2
Intestinal infectious
diseases (87·6 to 255·4)155·4 (–22·0 to –8·9)*–14·7 (1·2 to 3·5)2·1 (–27·3 to –20·5 –14·9)*
10 476·5
(5926·7 to 17 188·5) (–25·2 to –10·8)*–17·3 (80·7 to 233·5)142·6 (–29·5 to –15·5)*–21·8
Typhoid fever 128·2
(70·1 to 210·2) (–22·8 to –10·0)*–15·7 (1·0 to 2·9)1·7 (–27·8 to –21·1 –15·9)*
8729·6
(4775·3 to 14 334·4) (–25·8 to –12·0)*–18·1 (65·1 to 195·4)118·9 (–29·8 to –16·5)*–22·5
Paratyphoid fever 25·2
(11·8 to 49·2) (–14·1 to 0·3)–6·6 (0·2 to 0·7)0·3 (–20·7 to –7·8)*–14·0 (750·5 to 3096·7)1596·6 (–17·9 to –1·8)*–9·4 (10·1 to 41·8)21·6 (–23·0 to –8·0)*–15·1 Other intestinal
infectious diseases (0·6 to 5·5)2·1 (–80·5 to 102·0)–37·3 (0·0 to 0·1)0·0 (–81·4 to 85·8)–41·0 (40·8 to 410·6)150·3 (–84·9 to 130·3)–40·6 (0·6 to 5·9)2·1 (–85·4 to 118·9)–42·9 Lower respiratory
infections (2145·6 2377·7 to 2512·8)
–8·2
(–12·4 to –3·9)* (33·2 to 38·9)36·8 (–25·3 to –22·1 –18·9)*
91 363·1
(84 223·2 to 97 870·3) (–34·6 to –25·5)*–30·1 (1215·4 to 1412·3)1319·8 (–38·7 to –30·3)*–34·5