Rochester Institute of Technology
RIT Scholar Works
Theses Thesis/Dissertation Collections
2009
A Comparative Study of Package Orientation in the
Overnight Distribution Environment Utilizing
Different Shapes of Shipping Containers
Ritesh A. RaoFollow this and additional works at:http://scholarworks.rit.edu/theses
This Thesis is brought to you for free and open access by the Thesis/Dissertation Collections at RIT Scholar Works. It has been accepted for inclusion in Theses by an authorized administrator of RIT Scholar Works. For more information, please [email protected].
Recommended Citation
A Comparative Study of Package Orientation in the Overnight Distribution Environment Utilizing Different Shapes of Shipping Containers
by
Ritesh A Rao
A Thesis
Submitted to the
Department of Packaging Science
College of Applied Science and Technology
In partial fulfillment of the requirements for the degree of
Master of Science
Rochester Institute of Technology
Department of Packaging Science College of Applied Science and Technology
Rochester Institute of Technology Rochester, New York
CERTIFICATE OF APPROVAL
M. S. DEGREE
The M.S. degree thesis of Ritesh A Rao has been examined and approved by the thesis committee as satisfactory
for the requirements for the Master of Science Degree
(05/08/2009)
Acknowledgements
I would like to thank my advisors, Dr. Daniel Goodwin, Prof. Dennis Young, and Prof. Deanna Jacobs, for their guidance, help, and patience during the completion of this thesis.
Dedication
This thesis is dedicated to my family, my parents, and my friends who have made many sacrifices while I have pursued this goal. Without their love and support I would not have been able to accomplish this goal.
A Comparative Study of Package Orientation in the Overnight Distribution Environment Utilizing Different Shapes of Shipping Containers
By RiteshARao
Abstract
Package orientation is an important aspect to consider during the transit of packages worldwide. As orientation of a package can influence the manual handling and compressible load performance, it becomes important parameter to consider in an overnight distribution environment. Significantly, less amount of research completed in the area of package orientation. Current study involves three different types of packages (Rectangular, Cubic & Flat) and with the help of SENSR™ instrument impact orientations measured at defined time interval. Packages shipped along with measuring instrument to record the data, and collected data analyzed further to understand the orientations percentages for each type of container. Data showed variance in the percentage orientation between all the containers with normal (Z+) orientation being the most significant than the rest and concludes that size and shape have an effect on package orientation.
The information in this thesis will supplement the pre-existing body of knowledge and used for future test procedures
Table of Contents
Page
Chapter 1 Introduction... 1.
Chapter 2 Literature Review... 3.
Chapter 3 Hypotheses... 9.
Chapter 4 Methodology... 10.
Chapter 5 Data Analysis... 19.
Chapter 6 Conclusion... 26.
References... 28.
List of Tables
Page
Table 1 Data Representation in MS Excel... 22.
Table 2 Data in Tabular Format... 23.
Table 3 Degrees of Freedom... 24.
Table 4 Observed and Expected Values... 25.
[image:10.756.58.481.43.771.2]List of Figures
Page
Figure 1 RSC Cubic Container... . . . 11.
Figure 2 Flat RSC ... 11.
Figure 3 Rectangular RSC... 12.
Figure 4 SENSR ™ Data Logger I Recorder . . . 13.
Figure 5 SENSR™ in Shipping Container... 15.
Figure 6 Schematic Diagram of Arrangement of Shipping Containers... 17.
Figure 7 3D Co-ordinates of a Shipping container... 18.
Figure 8 3D Co-ordinates Representing Right-hand Rule... 19.
Figure 9 Data from the SENSR ™... .. 20.
Figure 10 Orientation-Time Plot. ... . 21.
Chapter 1.
Introduction
A significant number of packages are damaged during transit. As a direct result, package shipment companies incur financial losses, McKinlay (2004). A considerable amount of
research has been conducted to understand the significant factors that influence damages to packages. Package orientation in overnight distribution is a very important variable to
be considered during handling, transport, and storage of the packaged goods, Goodwin (2007). Many products are vulnerable to compression loading or leakage resulting from the improper orientation of the package during transit, which would cause damage to the
product. This issue has caused concerns in the overnight distribution environment and has
led many packaging researchers to study the package orientation of shipping containers in this environment.
Singh (1998) studied the effect oflabel location on impact orientation in the small-parcel environment (Study of Package Drop Orientation in the Small Parcel Environment,
1998). In one recent study Singh (2008) evaluated the dynamic events on the "smalls," "Packages with volume less than 13,000 cm3 (800 in3), and longest being 350 mm (14in)" (Dynamic Analysis of"Smalls" in FedEx Next Day Air Shipments), when they were shipped and handled along with the larger packages in the distribution environment.
were intended to develop a profile of the continuous orientation of the package as it
moves through the overnight distribution system.
In the most recent study Goodwin et al. (2008) compared the orientation patterns for two specimens that varied in shape and weight: flat (light) versus rectangular (heavy). With the use of the measuring instrument, orientation was measured over time, independent of any impact triggering a recording.
The effect of package orientation on different shapes and sizes of shipping containers is
an interesting area of research. This study considers different types and shapes of
containers in order to enhance understanding of the effect of package orientation on an
overnight shipment passing through the FedEx distribution system. The study will
employ a previously used instrumentation device to monitor and record the package
orientation in three different axes throughout the FedEx supply chain cycle.
The objective is to further understand whether any correlation exists between different
shapes and sizes of shipping containers in regards to the package orientation in the
overnight distribution/shipping environment. To that end, with the help of a recently
available programmable accelerometer made by SENSR of Elkader, Iowa, USA,
measured the orientation over time and performed the comparative analysis as a part of
his thesis. The information provided in this thesis is an original study on package
orientation and will add to the body of knowledge from previously conducted studies in
this area.
Chapter 2.
Literature Review
Research is relatively limited in the area of package orientation in correlation to the overnight distribution environment, although there are several technical papers published on similar topics. This chapter first reviews several papers on similar topics, identifies the initial work done by Goodwin (2008) in the field of package orientation, and summarizes the findings.
all impacts for Federal Express and UPS less than 165 in/sec and 225 in/sec for USPS
shipments in an overnight distribution environment.
Singh (1998) studied the effect of label placement on the package-drop orientation in a
small-parcel environment. In this study, five different sizes of packages with different
weights along with shock data recorders (Lansmont, SAVER) were used to record the
drop-impact orientation. Average drop heights for each of the containers were measured
and analyzed, and the findings were discussed with the observations. The data utilized for
analysis were the outcomes of the impact/shock recorded in the small-parcel
environment.
Singh (1998) also studied the effect of "this side up" markings on the package. The study
concludes that most of the regular-slotted shipping containers are expected to be in top
orientation; however, for space utilization the sorting employees would position the
packages in sideways.
The intent of the study was to help packaging professionals develop a suitable test
method for the package design process to reduce the damages in shipment.
Dr. J. Singh (2004) studied the dynamics of very lightweight packages of varying sizes in
the second-day air express environment. He also intended to propose the test levels for
drop testing. Environmental Data Recorder-3C (EDR- 3C), manufactured by
Instrumented Sensor Technology, Okemos, MI, USA, was used to measure the shock,
vibration, temperature, humidity, and pressure in the packages in the shipping
environment.
Five packages with different shapes, sizes, and weights were analyzed to further conclude
that size and shape do not have a correlation with the drop heights, and this research
suggests that the handling operations element has an effect on all types of packages (light
or heavy) in a FedEx second-day air delivery system. This information was the basis for
developing new test methods in designing protective packaging.
All the above studies provide information about the impacts/shocks to the packages, but
they don't provide any information on package orientation. In addition, all the events are
dependent on triggering impacts and not otherwise. It will be interesting to see if there is
any instrument that can provide the package orientation information when a package is in
an idle condition such as sitting at a warehouse or other zero-impact situations.
Goodwin and Young (2007) studied the effect of package orientation on a cubic container
in an overnight distribution environment. A recently available instrument from SENSR
was used to study orientation of the package independent of any impact or event to
trigger a recording. The data from the instrument was further analyzed, and it was
observed that the package spent the majority of time in normal orientation (label on top
face). Other orientations were also experienced on the package; however, the time spent
was significantly less.
Goodwin et al. (2008) did a comparative study that was completed on a flat and a
rectangular shipping container on FedEx overnight distribution environment. The
shipping containers were shipped along with the recorders and sent from Rochester, NY,
to Grand Rapids, MI, and vice versa. It was observed that the package spent the majority
of time in its normal orientation-label-up position. The flat and rectangular containers
differed by a few percentages.
Singh et al. (2008) presented a paper where they measured and analyzed the dynamic
instruments used were tri-axial recorders (SENSRTM GPl) to measure shock, impact,
drop, orientation, and temperature. Three different types of mailers were used, and the
recorders were placed inside these mailers and shipped using the FedEx priority
overnight. The drop test data was analyzed and compared further in order to develop a
test protocol. It was concluded that "smalls" or small-package containers were handled
differently from larger packages throughout the distribution environment.
A series of ASTM test methods were reviewed to understand if any one of them focuses
on package orientation or has any relationship with it. ASTM D5276 provides test
procedures for drop testing loaded shipping containers by free fall; it is suitable for
shipping containers that are manually handled during the distribution cycle (ASTM
Standard D5276, 2003).
ASTM D642 provides test methods to determine the compressive resistance for shipping
containers and unit loads. This procedure is used to measure the ability of containers to
withstand compressive forces applied to the faces, edges, or corners of any shipping
containers (ASTM Standard D642- 00 2005). ASTM D999 provides test methods for
vibration testing of shipping containers and assists in determining the performance of
shipping containers in terms of strength and package content protection (ASTM Standard
D999- 08, 1996-2009). ASTM 4728 provides a test method for random vibration of
shipping containers and assists in assessing the performance of a shipping container with
its interior contents and closure with respect to ruggedness or protection (ASTM Standard
D4728- 06, 1996-2009).
ASTM 4169 provides standard performance testing procedures for shipping containers by
subjecting them to a series of test plans consisting of a sequence of a hazardous element
in various distribution cycles (ASTM Standard D4169, 1996-2009).
D4 l 69 gives package designers a method for simulating the performance of new or
redesigned packages when distributed via any mode of transport. It provides test methods
wherein shipping containers are subjected to typical hazard elements as defined by the
ASTM test methods, a series of tests, and type of distribution, conducted in sequence
with the package being unopened until the package contents are inspected for any
damages to determine the acceptance criteria of the procedure. D4 l 69 provides a list of
distribution cycles, referred to as DCs, for truck, rail, air, export, import, and specialized
military requirements. Some DCs are for single shipping containers, unitized loads such
as palletized boxes. All of these DCs use ASTM test methods as test schedules to
simulate specific hazard element such as rough handling, vibration, or warehouse
stacking. The sequence of test schedules determines the test plan for each DC; for
example, a DC 3, single package environment up to 100 lb (45.4 Kg), requires handling
tests, loose load vibration, vehicle vibration, and more handling tests. D4 l 69 also
provides 3 levels of assurance, I being the highest intensity, II being medium, and III
being the lowest level of intensity, which help to define the level of intensity of the test to
be conducted (ASTM Standard D4169- 08).
Similarly, ISTA procedure 3A provides a test series for packaged products for parcel
delivery system shipment to help understand how a package or product would withstand
ISTA Project 4AB is a web-based program which generates simulation test plans
covering testing for 12 different package types, 4 handling types, and 7 types of load
carrying materials or their combinations. Each test plan is tailored to a particular situation
with the help of specific hazard profiles.
Chapter 3.
Hypotheses
Ho - The package orientation is not influenced by the size and shape of the shipping
container in the overnight distribution environment.
HI - The package orientation is influenced by the size and shape of the shipping
Chapter 4.
Methodology
The study consisted of a mixed methodology, with a combination of qualitative and
quantitative strategies, to study the various package orientations throughout the
distribution network and understand their relationship to handling, transport, and storage
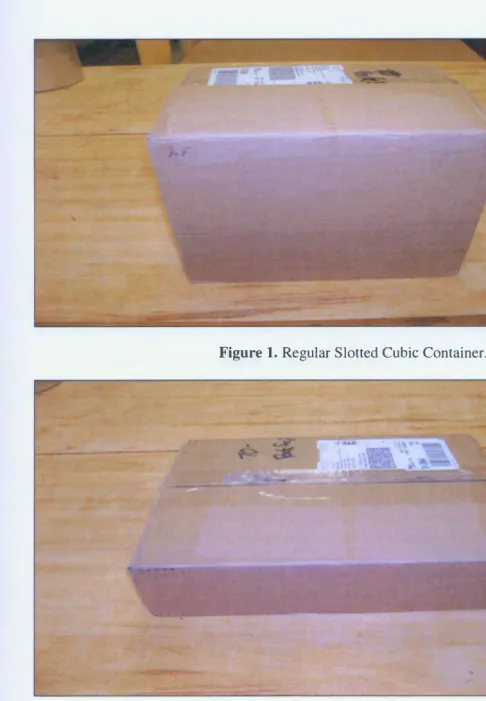
operations. Three specimens used for this study were constructed from C-flute corrugated
with a minimum ECT of 32 lb/in. The cubic regular-slotted containers (RSCs) measured
280 x 280 x 280 mm (9 x 9 x 9 in.). The flat RSC measured 38.7 x 31.1 x 8.3 cm (15.25
x 12.25 x 3.25 in.), and the rectangular RSC was 30.5 x 25.4 x 26.7 cm (12 x 10 x 10.5
in.). The flat specimen weighed 0.86 kg (1.90 lb.), and the larger rectangular cube
weighed 2.77 kg (6.10 lb.). See Figures 1, 2, and 3. Polyethylene foam was used to hold
the instrument and act as a fixture; it had nothing to do with the cushioning, as only the
orientation is measured. A mass-centered specimen was created that would not influence
its orientation.
Figure 1. Regular Slotted Cubic Container.
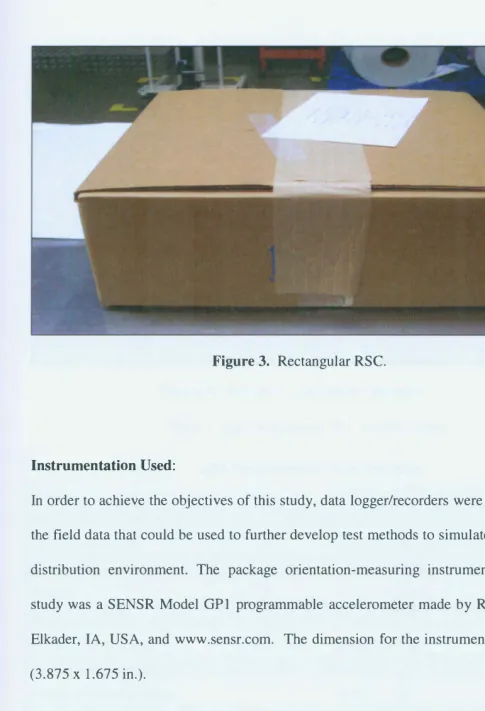
Figure 3. Rectangular RSC.
Instrumentation Used:
In order to achieve the objectives of this study, data logger/recorders were used to collect
the field data that could be used to further develop test methods to simulate the overnight
distribution environment. The package orientation-measuring instrument used in the
study was a SENSR Model GPl programmable accelerometer made by Reference LLC,
Elkader, IA, USA, and www.sensr.com. The dimension for the instrument was 10x4 cm
(3.875 X 1.675 in.).
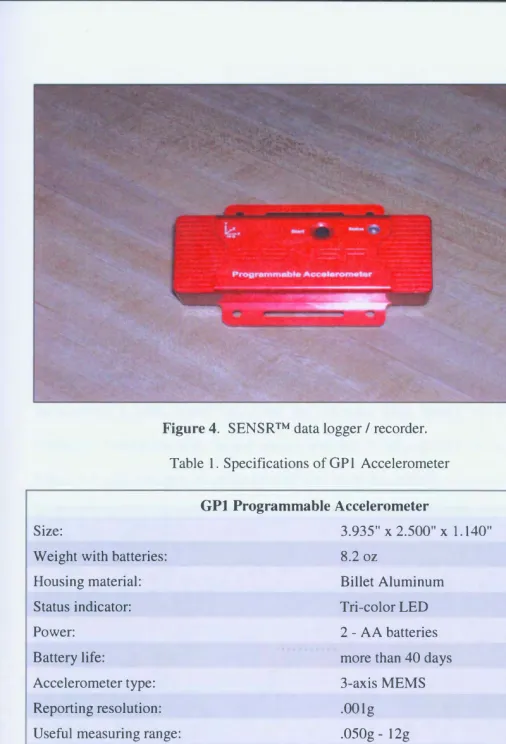
Figure 4. SENSR™ data logger I recorder.
Table 1. Specifications of GPl Accelerometer
Size:
Weight with batteries:
Housing material: Status indicator:
Power: Battery life:
Accelerometer type:
Reporting resolution: Useful measuring range:
Frequency response:
Sampling rate:
Shock survival limit:
Memory capacity:
GPl Programmable Accelerometer
3.935" X 2.500" X 1.140"
8.2 oz
Billet Aluminum Tri-color LED
2 - AA batteries more than 40 days 3-axis MEMS .OOlg
.050g - 12g DC-50Hz
The SENSR GPl is a 3-axis recording accelerometer instrument designed to record and
evaluate dynamic environmental events. The GPl can record up to 40 days of field data,
which can be used to create concise graphs and tables for easy-to-understand evaluations
and comparisons. It assists engineers and designers in measuring real-world data for fact
based decision-making and assists in eliminating any incorrect assumptions or
guesswork.
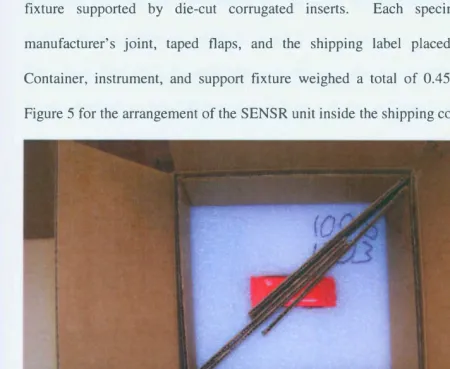
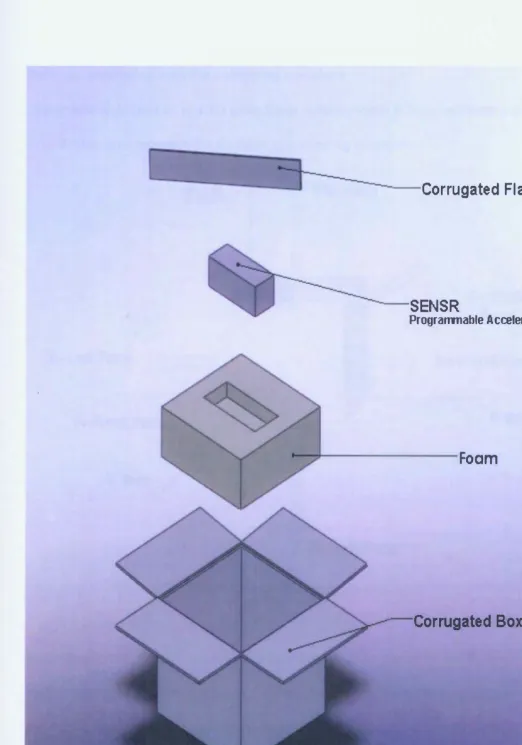
The instrument was positioned in the center of the container in a polyethylene foam
fixture supported by die-cut corrugated inserts. Each specimen had a glued
manufacturer's joint, taped flaps, and the shipping label placed on the top face.
[image:25.756.44.494.380.749.2]Container, instrument, and support fixture weighed a total of 0.45 kg (1.0 lb.). See
Figure 5 for the arrangement of the SENSR unit inside the shipping container.
Figure 5. SENSR in shipping container.
A set of programmable units was sent repeatedly through the FedEx overnight
distribution system from Rochester, NY, to locations in Grand Rapids, MI, and Elkader,
IA. Each type of package ( cubic, flat, and rectangular) made repeated round trips between
these destinations.
The epoch settings for recording orientation readings were set at 20 seconds for cubic and
15 seconds for flat and rectangular throughout the duration of each trip. It was then
downloaded into a computer system via a USB cable connecting the instrument to a
computer. The data was downloaded into an Excel spreadsheet for further analysis and
interpretation oflogistical operations taking place in transit.
The comparative study on each type of orientation data was completed using Microsoft
Corrugated Flap
SENSR
Progranmable Accelerometer
Foam
[image:27.756.41.564.30.776.2]Corrugated Box
Figure 6. Schematic diagram of arrangement of shipping containers.
Package orientation axes for a shipping container:
Orientation is defined as in a 3D co-ordinate system, where 6 faces represent a particular
axis. All the axes represent the six faces of a shipping container.
Zaxi
Z+ Top Face
X- Left Face
\
I
Y- Front Face
Yaxi
[image:28.756.51.505.96.558.2]Z- Bottom Face
Figure 7. 3D Co-ordinates of a shipping container.
Y+B
Face
X+ Right Face
Xaxi
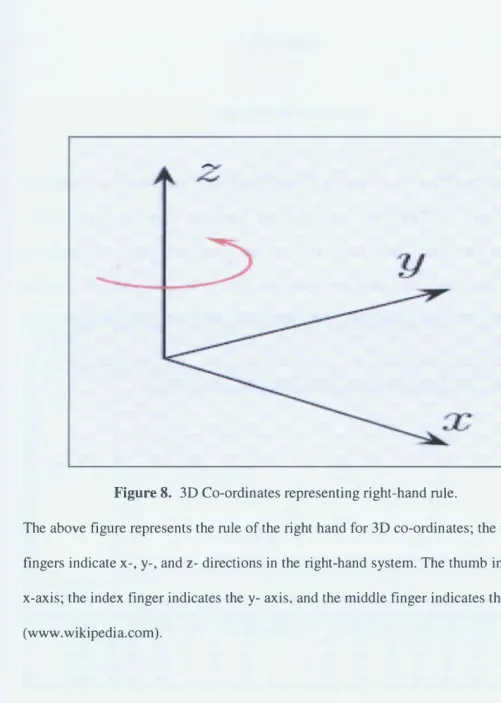
Determination of package orientation is based on the right-hand rule similar to
electromagnetism; however, it is not the same, because the index finger points forward,
the middle finger is bent inward at a right angle, and the thumb is at right angle to both.
The three fingers indicate x-, y-, and z- directions in the right-hand system. The thumb
-Figure 8. 3D Co-ordinates representing right-hand rule.
The above figure represents the rule of the right hand for 3D co-ordinates; the three fingers indicate x-, y-, and z- directions in the right-hand system. The thumb indicates the x-axis; the index finger indicates the y- axis, and the middle finger indicates the z- axis (www.wikipedia.com).
[image:29.759.45.546.66.768.2]Chapter 5.
Data analysis and results
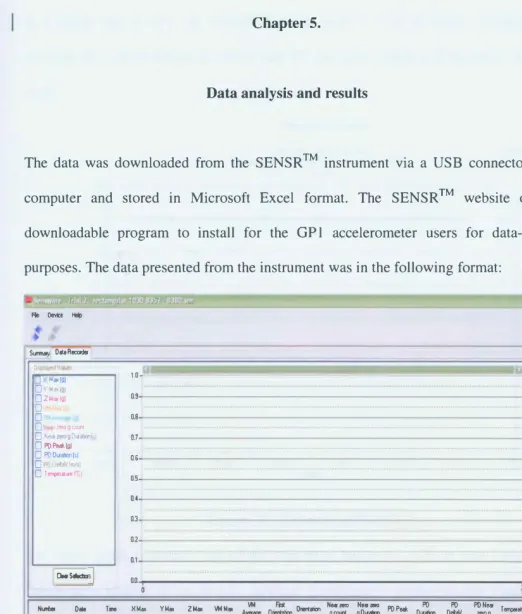
The data was downloaded from the SENSR TM instrument via a USB connector to the
computer and stored in Microsoft Excel format. The SENSR TM website offers a
downloadable program to install for the GPl accelerometer users for data-analysis
purposes. The data presented from the instrument was in the following format:
Flo Oew:e �
St.l!IMlll Dot.Recode<
Maic(ll) D • •llll CJ Z M,• Iii
lO-J '.] :J "''"• :(Ult
D • ... ,..,.go...a1ion D PDPeal<illJ D PDDlla1,on(,J
D 1e1.t11,m1,1
D r....,.. ... rc,
Ooar Selection J
0.9 0.8 QI 0.6 n5 0.4 0.3 n2 0.1 0.0 0
Ntffllef Dale Tine XM ..
ll4J09/200II 16:33]; 027 ll4J09/200II 16:3345 075 ll4J09/200II 16:34:00 OJ. ll4J09/200II 16:34:15 002
YM"' ZMac VMM"' AVfflll/fJ VM 1.67 019 100 002
nn 037 057 002
123 127 034 001
009 1.01 002 000
Fnt Orierlalion Nearmo
Oriertaiion gCOl.ri
z. y.z. 000
z. X+Y·Z· 000
z. Y+Z+Z· noo
Z+ Z+ 000
Neazero PDPeal<
gDllalion Dllalion PD
000 Q88 OC6
000 052 OC6
[image:30.761.43.565.85.699.2]000 Q34 D.C6 000 000 0.00
Figure 9. Data from the SENSR Instrument.
PD PD Near DetaV ZOIOg 1-oille 026 False 2369
019 False 2375
015 F ... 2388
000 False 24.13
"""' Lri< Tine: Vu En.,i;,,d lll)O Lri< lllll•lTine: Vu lllll•2Tine: Vu lllll•D••Tine: Vu B<Atm f'Tea False False False
This above data was further imported into an Excel spreadsheet in CSV (Comma
in a format that is very user friendly for data analysis. The provided information also
includes Net zero G Count, PD Peak, and PD Duration, which will not be a part of this
study.
4
3
2
I
•
OrientationI
0-1 -2 -3 -4 5/5llJ8
=
-516AJ8 5/1AJ8
Package Orientation
Overnight Parcel Shipment Rochester, NY· East Lansing, Ml Round Trip
Trial3
5/8,UI 519AJ8 5/1(11)8
[image:31.761.48.489.96.492.2]Date
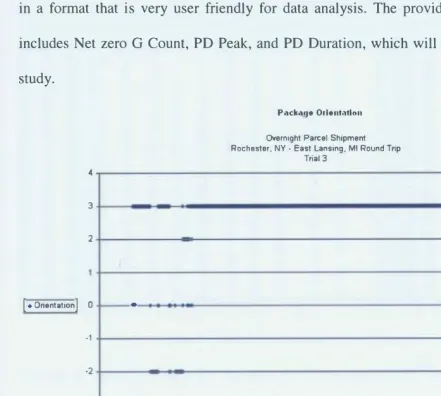
Figure 10 . Orientation-Time Plot.
5/11,1:E
Pad ac• Tvp•
Flat
St• >CxYxZ.
5/1
The above graph represents one of the trips from Rochester, NY, to East Lansing, MI.
Date/time is plotted on the X-axis, whereas orientation is plotted on the Y-axis. All 6
orientations (Z+, Z-, Y +, Y-, X+ and X-) were represnted with numbers where +3
represents (Z+) top face, -3 represents (Z-) bottom face, +2 represents (X+) right face,
-2 represents (X-) left face, + 1 represents ( + Y) back face, -1 represents the front face
(-Y), and O (zero) represents the time when the package was in an idle state. The reason
for doing this was the ease of plotting the graph in Microsoft Excel.
20
'
ow• ,o M,cmgan �·"7·2001 .l•OOl.:11:11,
lC '"
c,..- - -�
o J HQCIO<Q• Oit1t A I ,.. .,. C XA,,D ·•t.C.� x,.,,, f ... �v�, f ... YA,.,1A�1U.,1M H .. tNSA��V\I 11.� J ·oVMA.��f--�IC>•tflll>ontaM t.,o,, ·\-WI .. ..,�� Noert1 ,-i O P 4.:"19Q " 0..:1.,. 0,,r,,,tatl ,...., ..,, •:J . ) ' t.4997 !111:t,'!17 16'9.tO :JC7 Jt;ti Jt.:• Ot:2 1(;1 :J99 JC1 :J l• l• 2'l5 ':AP,nk<! t.c:itr1 A.1e<19 Y'l.','07 J
J b4tte Y12,'()7 1640.00 OC7 ilt.:ti :Jt.:• H2 1 (;1 09' JC1 ,J l.• l.• 7.H "'°'-P•nk'C l"an Alc,,ts YIH7 J
4 bilt!.)I Y'l.'·'117 1e•02C OCT JCC .It• 0(;1 1(;1 099 JC1 J l.• l.• 2'.:5 ,,_,JtP•uk� !'.de, .tJel1I "112,'Cr J
S WOOC "112,'CT 164C� :IC7 OCC :JC• ;)(;1 1(;1 Jt9 JC1 ill.• l.• 2'.:5 �P .. 1HC! � � �12,W l
6 b!,001 "112t17 1&•1 QC OC7 .Jl,;O Ot.:• Ot:1 1 C1 :JM JC1 J l.• l.• 7.!5 >.<AP•nk'C t.o.1 Ak1:I �'1.'t17 l
7 �°' Yl101 164110 VC7 'iJ(;(I JL• ,)(2 1(;1 OH JC1 az• l• T.'.� "JtPrMk'C Newt Alof'tl �12'CT l
I �� Y'l1'07 1e•1 � OCT i)L� av Qt:2 t(;1 ::,99 JC1 J l• l.• 225 .... 'ltP,Uk'C ,..._, � 511:t,'CT J
St � 5111'07 1&•2.:xi �er 01.:t Jt:4 'iltZ Ht JH Jc1 J l.· z.. T.d k:APflkC:: NcT, � Y12'07 :, 10 � 5112,'07 16 •2.10 0 er V (;5 0 CJ O t:2 1C1 J n J C1 J Z• l.• ,. •J75 ft'Jt P-nkC t<dH Aloo1I Y11'07 J
11 � !.111\17 16•.!CO .107 Jee Jc;. ilt:2 1L1 ilH JC:1 .I l.• l.• LJ., *'11P•u.wc: ""*1 � �12,W l
U bS,;107 �'12117 164J;t, OCT OLC ;JLJ Jt1 1 C1 J!lt JC1 :J l• Z• Tl5 ,.,.P,aklC ""*'- � $'12,117 J
13 � 5112"01 11102'C :JCT Ol.5 ilCJ otz 1 t.1 J" JC1 :J l• l• 2'15 ,...JtP-.u«l Noll"I ... �11,"()7 J
14 b!,iJOW 511.t'llT 1e•J.t0 OCT J(.5 a:.:J HZ 1C1 :J9' JC1 ;J l· l• 715 "''AP .. ,-= Nc1H � �11"07 J n wo1c s,,.t.'()7 1&•4:JO ocr .ice ac• .Jt:1 1L1 JH Jc1 J l• l• i-�, N-';IIP•u.- "'°'" ...,..._ ,-11.,or ,
16 6!,;111 '-'11,"07 1844:tO UC7 QUI JC4 JC2 1C1 JV, JC1 ;J z- l• n, NQIP1ase)C fl;olet Nlt'tl "'1l'tl7 3 17 b&l12 S,111"07 16444() OCT Ol.5 i.lC4 JC2 1 (.1 JH JC1 J l• l· Z2"J7b ,'r,iQl:PrnMC tcite• Ale-ti Sl12,"07 3
11 b!l.)13 5.'11\17 Ul450C i.lCT i.tl.t1 i.tl.' Jt2 1t,1 Jff JC1 J l.• l• l'l5 "'AP'flMIC Noln ...,_,. 5,'1;t,'C7 J
19 idQU ,i,n:, 184520 0C7 0� ,l(.A Jt:2 1(;1 JM JC1 0 l· l• 22431b "1•AP·n.-.: � � Yll."'()7 J 20 b!i01� 5,'11"07 16454() OCT ac.:t, atJ ac1 1C1 0'9 JC1 ;J l· l· Tl5 NotP1nwe Nolst Alfll':I '-'12,'07 :I Zl b&IHI 511if'Q7 1�"600 oc, OtiO at:i JC2 1C1 Ji! Jt.1 ll z- l• 2"�5 H:APraMC l'.oltt Ale'1I 5/1:t.'07 :I
�!
I=�;
:;�
�;
::::
��;
��= ��
ig
:��
g:: g�:
�
�= �=
�j! ::::= =
t��:::�
�; I
�!� �:;::;
:
:
:
�: ��;
�t: ����g
�g:
g:: g�
:
�
�= �= �:
�:
:
=::::
= = �
:�;
�; ;
lf• ti.5011 �12,-01 1e.a140 oc, ocs oc;.c oc1 1c1 on 001 oz.. l· hors 1+J1.P..a1CN: ""*' .� &12."0r :i Z7 ti!OU 5'12-'07 111'1Hl0 0tl7 Qt,$ 01,;,,1 0�1 1C1 J99 OU1 tl l• l• 2:4375 H.A.P'flMC � ...,.,_ >'11,'07 J l8 t1¢1JJJ )11J,'U7 111 .. 6:IO Yt.r7 Jt,� Y� ilC2 1CH OH Jill J l.• l• � .. J1� N>JtP-u.NC ,.,_., ._.,. ,.,12,117 l 29 '6.124 5/11-"07 16ole4C our OCti .)!,;,I OC2 101 .099 001 i.l l• Z• 2'J.5 �P .. ,u,c Nolet All"U �'12,"()7 3 JO WOJ6 !li1:t"01 1114:.100 007 coe ,1a. ilC2 1C1 ilN J01 0 Z• l• ri., WA.Prus«: t,;oeet Ale'• 'Yl2,'07 J )1 t.502' Y12'07 16'920 Oll7 oce oc, OC:2 1C1 :JM i)Q1 0 l• l• 12431b N,,AP,iro..c ..._ .._,. Yll,"07 J ll ti.!011 S,112'07 1649� oc, 0(.� OCJ JC2 1 C1 JH au, ;J Z• Z• 125 "-'XP'U1VC NQlf-1 ..._ �12'07 3 1, 0$):l' '112'07 165CQO OC7 JOt, OCA OC2 101 a99 au, ;J l• l• 22431b ... PthMC "'°'" � 5/11"07 J )4 ti!O:lt !1;12"()1 16,Clt Qtl7 ooe ;JC,4 JC2 I C1 JH 001 :J l· l• 2'4'5 ,...JlP....Sf.C: NuOff ...,... 5112.1H l JS- �� �11'07 111,CAC OC7 OtiG OtA OC2 1 C1 :J'9 JC1 :J l.• l.• Zl5 ,..,....P-..,MIC Molts ... 5/12'07 3 )6 �l1 ,_.12,'07 165t00 OU7 ;)Ct, OCJ JC2 1C1 O" 'JU1 .J l.• l.• :li5 l<t·A�wc hOll-1 � ,-12.:1 J J7 �l;l �12'07 1115120 OC7 JOC JC, .'IC2 1C1 Jl9 :JC1 :Jl.• l.• ��5 hQC.P'hH'<l holr1 � 511207 'l 18 �J S,112'1)7 1S5IAO 01.r aOb JCJ OC:2 1C:1 JH .'IC1 0 l.• l.• 225 ,.. ... P>fl-.: � ..,_... 5112'1)7 'l 39 0$Jl" S/12,'07 165'0C JC1 i.lCC JCJ OC2 1C1 ;;199 JC1 iJ l• l.• 2:H ,._.itP"UHC ""'*' � ,_,12'01 J 40 (15,J'.j� 5112'07 115.?10 OCT .ice JCJ JC2 tt1 OH ,c, J l• l.• 1''5 �JtP ... sw N<*t � �n.w 3 41 �jf S,12,"()7 111! .. ¢ OC7 :Jt:b oc• JC2 1t1 Jff JC1 J l- l- 2'.:, H·XP'flk� ""<*1 Aoct11 '112'1.7 3 4.l �37 Y11'07 1a,J� OC7 Jl.� :JC3 OC2 1t1 :)ff JC1 ,) l• l• :r.:, ""<AP'flt«: "'c1in � S1121l7 3 0 6!1ill8 5112'07 16S.12'C :JCT Ot! at:, OC2 1(;1 Jff OC1 ;J l• l.• l'i$ Ho'ltP,u.t« ,.._.. A;,."11 �1;1:01 3 44 e.,,Q.)9 5'12"07 1S!:'J.t(l OCT at:5 ot• iJC2 1 C1 :Jff :JC1 0 l.• l· TH ,..·JtPfltw � � Y12107 J 4S �c "12'Cr 16S,40C Qt7 oce JC4 JC2 1t1 Jff JC1 0 l• l• 22, NQlP'flMIC � Aoe'ttl '112'01 J [image:32.756.38.555.16.744.2],u. 11.-.�, Y11ur_1��,r- nn1 .iN<t 11:1 IOW• to MICh1g.u, 4-27-2007 1-0
Table 1. Data Representation in MS Excel.
The above figures represent the imported data from the SENSR TM instrument in an MS
Excel spreadsheet from the trip's start until its end. The instrument was set to record the
orientation positions, shocks, and vibrations at a programmed set of intervals. The stored
data was downloaded and further utilized for analysis purposes, as well as for testing the
hypothesis. It was available throughout the trip to permit study of the package's behavior
during the transit times, when only those data points were selected.
The time when the package was sitting idle was eliminated from the analysis. The live
transition time set of data was used for further analysis to estimate the time spent in each
particular orientation. To validate our hypothesis of whether the package size and shape
do influence its orientation, the collected data was analyzed for a chi-square test. The
randomized data was selected from all of the trials and utilized for analysis purposes. A
use of the Microsoft Excel randomizer, the data was randomized, and 1,000 additional
data points were taken for analysis purposes, as shown in Table 1, below.
<> A B C D E F G
.l Sr. No. I Cub<t I Rect I Flat I I Sr. No. I 3000 ValuH j �cm .,.,.,,..,be,. o.,...tor I Oata
2 1 z.-Cube x. l.{0C1 Z.-F•at 1 z.-Cubo 294
,
£-Cub,3 2 z.-Cube z.. Roel Z.-f-'OI 2 z.-Cubo 520 ,.. z.-Cub
4 3 z.-Cube z.. Roct Z.-l·'Ot 3 z.-Cube 2391 ... z.-F et
5 ' 4 z.-Cube z.. Rcct z.-FIDI 4 z.-Cube 778 ... z.-Cubo
6 ' 5 z.-Cube X-ROC1 z.-f-101 5 z.-Cube 1494 ... Z.-Roct
7 I 6 z-Cube X-RoC1 £+ Flot 6 z.-Cube 403
..
z.-Cube8
j
7 z.-Cube Z.-Roel Y-F1ot 7 z.-Cube 40 ... z.-Cubo190 1
e z.-Cube z.. Roct £+ flol e z.-Cube 10!55 ... X-1.{ect
9 z.-Cube X· ROC1 z.-1101 0 z.-Cube 500 ... z.-Cube
.11 10 z.-Cube z.. Roel z.-Flo! 10 z.-Cube 1010 ... Z-Roct
12 , 1, z.-Cube Z.-Roel Z.-Fla! 11 z.-Cube 579 ... z.-Cube
.HJ 12 z.-Cub!> Z.-Roel £-Ho! 12 z.-Cube 2633
..
z.-Fol.14_ I 13 z.� Cube z.. Roel z.-Flat 13 z-Cube 1496 ,.. £-Roel
_ls I 14 z.-Cube L-Roel z.-F•ol 14 z.-Cube 513
..
z.-Cube16_ j 15 z.-Cube X-RoC1 L-FID! 15 z.-Cube 2322 ... z.-Flot
_
17 I 16 z.-Cube X· Roct L-f-lOt 16 z.-Cube 1491 ... X· RoC1
18 17 z.-CubO L-Roel l.-Fla! 17 l.- Cube 277
..
l.- Cube19 I 18 z.-Cube l.-Roel L-f'IOI 18 z.-Cube 91
..
z.-Cub20' 19 z.-Cube z.. Roe1 L-f'IOI 19 z.-Cube 21!!8 ,.. Y-Flol
21 20 z.-Cube Z-ROCl Y-FIOI 20 l.-Cube 471
..
z.-Cube22 21 z.-Cube L-ROCl Y-Flot 21 z.-Cube 2742
..
L-F'ol23 22 L-Cube X· Roct X-FOI 22 l.-Cube 2917 ,.. L-f'OI
24 23 L-Cube L-Roel Y+ Fial 23 z.-Cube 691 r L-Cub
25 24 z.-Cube X-Roct Z.-F101 24 z.-Cube 590
..
z.-Cub26 25 z.-Cube X· Roct L-FIOI 25 z.-Cubc 832 ... L-Cub
27 26 L-Cubc X-�OC1 L-FIOI 26 z.-Cubc 60 ... L-Cub
28 27 Z-Cube z.. Roel z.-Flot 27 z.-Cubc 2107 r Y-Fie!
29 26 z.-Cube X-ROC1 l.-f-1;:,1 26 £-Cube 300
.
L-Cub30 29 z.-Cubo L-Roel Y+ Flot 29 z.-Cube 1020
..
l.-Roct31 30 £- Cube l.-Roc1 z.-f-•01 30 z.-Cube 2006
..
l.-Hat32 31 z.-Cube X-Roel l.-f-lot 31 L-Cube :.!587
..
l.-Flo!33 32 L-Cube z.. Roel z.-f-101 32 z.-Cube 595
..
z.-Cube 34 33 Z-Cube z.. Reel L-f'lal 33 z.-Cube 212, r Z.-F'Ol35 34 L-Cube Z.-Rocl z.-Flat 34 l.-Cube 494 r z.-Cub,
36 35 z.-Cubo X-Roct l.-Flat 35 l.-Cube 1490 ... L-Roc
37 36 L-Cube X-RtiC1 z.-Flot 36 z.-Cube 15!> ... L-Cub
38 37 z.-Cube L-ROCl l.-Flot 37 l.-Cube 1998 ... l.· ROCl
39 38 L- Cube z.. Roct Y-f'1ot 38 L-Cube 1927 • L-Roct
[image:33.756.44.554.30.785.2]40 39 z.-Cube X-Roel l.-Flot 39 z.-Cube 1712 ... L-Roel
Table 2. Data in a Tabular Format.
The formula to calculate the chi-square is shown below.
Chi-Square Formula and Degrees of Freedom ""
x
'!=I (
Alpha value = 5 Alpha Value = 1
Degrees of Value Degrees of Value
freedom freedom
1 3.84 1 6.63
2 5.99 2 9.21
3 7.82 3 11.3
4 9.49 4 13.3
5 11.10 5 15.1
6 12.60 6 16.8
7 14.10 7 18.5
8 15.50 8 20.1
9 16.90 9 23.2
10 18.30 10 24.7
11 19.70 11 26.2
12 21.00 12 27.7
13 22.40 13 29.1
14 23.70 14 30.6
15 25.00 15 30.6
16 26.30 16 32.0
17 27.60 17 33.4
18 28.90 18 34.8
19 30.10 19 36.2
20 31.40 20 37.6
21 32.70 21 38.9
22 33.90 22 40.3
23 35.20 23 41.6
24 36.40 24 43.0
25 37.70 25 44.3
26 38.90 26 45.6
27 40.10 27 47.0
28 41.30 28 48.3
29 42.60 29 49.6
30 43.80 30 50.9
Table 3. Degrees of Freedom.
The degree of freedom (DOF) was calculated utilizing the formula (m-1 )*(n-1 ), where m
denotes the 6 faces of the cube and n denotes 3 for types of containers. The DOF is 10,
and the corresponding value will be 18.30 for alpha value = 5. This value will be critical
in accepting or rejecting the hypothesis. The observed values were the actual values from
[image:34.759.49.492.55.580.2]From the above DOF table, in order for DOF conditions to accept the hypotheses, the
following must be indicated:
If the chi-square value is more than 18.30, then accept Ho, i.e., the size and the shape of
the shipping container influences the package orientation.
Ho - The package orientation is influenced by the size and the shape of the shipping
container in the overnight distribution environment.
HJ -The package orientation is not influenced by the size and the shape of the shipping
container in the overnight distribution environment.
If the chi-square value is less than 18.30, then reject the other hypothesis because the size
and the shape of the shipping container do not influence the package orientation.
The following table represents the information from 1,000 randomized data points for all
three containers as being observed and expected readings; "observed" = the real
downloaded information and "expected" = calculated.
OBSERVED VALUES
Z+ Z- Y+ Y- X+ X- '"' Total
Cube 360.00 0.00 0.00 0.00 0.00 0.00 360.00
Rectangle 4.00 247.00 2.00 0.00 0.00 87.00 340.00
Flat 230.00 2.00 15.00 52.00 0.00 1.00 300.00
Total 594.00 249.00 17.00 52.00 0.00 88.00 1,000.00
EXPECTED VALUES
Z+ Z- Y+ . Y- X+
X-Cube 213.84 89.64 6.12 18.72 0.00 31.68 360.00
Rectangle 201.96 84.66 5.78 17.68 0.00 29.92 340.00
'Flat 178.20 74.70 5.10 15.60 0.00 26.40 300.00
[image:35.754.48.548.50.795.2]594.00 249.00 17.00 52.00 0.00 88.00 1,000.00
Table 4. Observed and Expected Values.
24
- ,,. ,,.
I ·-· 'I. '.
·~
' --~ ' .,-..
The further breakdown of the formula was computed in a tabular format to calculate the
chi-square value. See Table 4 below, where "O" = observed and "E" = expected.
0 E ··o-e (O�E)A2. [(O-E)A2J/E
360.00 213.84 146.16 21,362.75 99.90
0.00 89.64 -89.64 8,035.33 89.64
0.00 6.12 -6.12 37.45 6.12
0.00 18.72 -18.72 350.44 18.72
0.00 0.00 0.00 0.00 0.00
0.00 31.68 -31.68 1,003.62 31.68
4.00 201.96 -197.96 39,188.16 194.04
247.00 84.66 162.34 26,354.28 311.30
2.00 5.78 -3.78 14.29 2.47
0.00 17.68 -17.68 312.58 17.68
0.00 0.00 0.00 0.00 0.00
87.00 29.92 57.08 3,258.13 108.89
230.00 178.20 51.80 2,683.24 15.06
2.00 74.70 -72.70 5,285.29 70.75
15.00 5.10 9.90 98.01 19.22
52.00 15.60 36.40 1,324.96 84.93
0.00 0.00 0.00 0.00 0.00
87.00 26.40 60.60 3,672.36 139.10
[image:36.756.44.528.125.459.2]SUM 1,209.51
Table 5. Breakdown of Chi-Square Formula.
We see that the chi-square value is 1,209.51, which is more than 18.30. Hence, we will
accept our hypothesis that size and shape do affect the package orientation.
The value of chi-square helps to conclude that for three containers, different shapes and
Chapter 6.
Conclusion
This study, in conjunction with previously held research in the same environment, is the
comparative analysis of three types of packages in the overnight distribution
environment. Table 1 represents the orientation of each type of shipping container. When
measured, the cube, rectangular, and flat packages spent 100%, 73.7%, and 69%,
respectively, of their time in the normal, and thus the strongest, orientation (Z+), in which
the label was placed on the top face of each package.
In ASTM D 4577, where the load is generally tested in top-to-bottom orientation, which
is the normal orientation (Z+) for compression resistance of a shipping container, this
testing method co-relates to our earlier conclusion that normal orientation is the most
significant. ASTM D5487, the test method for simulated drop ofloaded containers by
shock machines, recommends testing the parcel on its most stable orientation, which
happens to be normal orientation (Z+) for any parcel. Similarly, 49 CFR, 172.312 (a), a
section for liquid hazardous materials in non-bulk packaging, indicates that the package
should always be marked in an upward direction, which would be the normal orientation.
This is in support of our earlier conclusion that normal orientation (Z+) is the strongest of
all as the flute construction is in a vertical direction ( orientation) with the box opening at
the top.
From the chi-square test that we performed on the data obtained via the field study using
the SENSR instrument, we should accept our hypothesis that different container sizes and
shapes do have an effect on orientation, and we should reject the other hypotheses in the
real-world overnight distribution environment where space utilization is more critical
than package orientation ( except when packages are scanned), as there is no statistically
significant difference. The information in this thesis will supplement the pre-existing
body of knowledge and used for future test procedures.
Recommendations for Further Study
This study could be extended to identify other areas where the SENSR instrument can be
utilized for other distribution studies. Further recommendations are:
1. A similar study can be conducted for different types of distribution cycles or
methods of services (2-day priority, international, etc.) to expand the study in
order to see whether any relationship exists with other distribution cycles.
2. A similar experiment can be conducted using different carriers, such as United
Parcel Service (UPS) and/or United States Postal Service (USPS), to understand
whether any correlation exists among the handling operations in an overnight
distribution environment.
3. RFID (Radio-Frequency Identification-tagged) packages should be similarly
tracked and studied to reveal how the package orientation would correlate against
a manually placed shipping label, because RFID would eliminate the manual
handling of the package and would likely change the need to place it in the
References
ASTM Standard D642-00 (2005) el, ASTM International, West Conshohocken, PA, 1996-2009, DOI: 10.1520/D0642-00R05E01,www.astm.org
ASTM Standard D999- 08, ASTM International, West Conshohocken, PA, 1996-2009, DOI: 10.l 520/D0999-08,www.astm.org
ASTM Standard D4728- 06, ASTM International, West Conshohocken, PA, 1996-2009, DOI: 10.l520/D4728-06,www.astm.org
ASTM Standard D4168- 08, ASTM International, West Conshohocken, PA, 1996-2009, DOI: 10.1520/D4169-08, www.astm.org.
ASTM Standard D5276, 2003, ASTM International, West Conshohocken, PA, 1996-2009, DOI: 10.1520/D5276-98R09,"vww.astm.org)
Cartesian coordinate system. June 25th 2009, from Wikipedia:
http:! /en. wikipedia.org/wiki/Cartesian coordinate
GPl Recording Accelerometer, 2009, website: http://sensr.com/products/testing-and development/gp1 .php
Goodwin, Daniel, and Young, Dennis, September 2007, "Package Orientation at Selected
Points in the Overnight Distribution Environment," 23rd IAPRI symposium in
Windsor, UK.
Goodwin, Daniel, Young, Dennis, Rao, Ritesh, and Ashokan, Pooja, 2008, "Comparison of Shipping Container Orientations in the Overnight Distribution Environment,"
16th IAPRI world conference, Bangkok, Thailand.
McKinlay, Alfred, October 2004, "Measuring Package Performance to Avoid Shipping Damage," ASTM International.
Montgomery, C. Douglas. November 29, 2001. "Introduction to Statistical Quality Control," fourth edition, John Wiley & Sons, Inc
Singh, Jagjit, 2004, "Measurement and Analysis of the Small and Light Weight Parcel
Shipping Environment," 14th IAPRI World Conference, Stockholm, Sweden.
Singh, Paul, 1993, "Designing Packages for Overnight Parcel Environment," 8th IAPRI