Int. J. Electrochem. Sci., 14 (2019) 8450 – 8469, doi: 10.20964/2019.09.27
International Journal of
ELECTROCHEMICAL
SCIENCE
www.electrochemsci.orgCorrosion Behavior of Common Metals in Eutectic Ionic
Liquids
Taleb Hassan Ibrahim1,*, Rami Alhasan1, Mohamed Bedrelzaman1,
Muhammad Ashraf Sabri1, Nabil Abdel Jabbar1, Farouq Sabri Mjalli2
1 Department of Chemical Engineering, American University of Sharjah, Sharjah, UAE
2 Petroleum & Chemical Engineering Department, Sultan Qaboos University, Muscat 123, Oman, *E-mail: [email protected]
Received: 11December 2018 / Accepted: 1 May 2019 / Published: 31July 2019
The corrosion behavior of six choline chloride-based eutectic solvents namely, ChCl-Ur, ChCl-EG, ChCl-Gl, ChCl-MA, ChCl-Ph and ChCl-TG towards copper, mild steel and stainless steel 316 have been investigated. The effect of temperature and moisture content was evaluated. The corrosion rates of the three materials increased with an increase in the temperature and moisture content. Stainless steel was found to be the most resistant under all experimental conditions. The experimental results demonstrated ChCl-Ph and ChCl-Gl to have high inhibition efficiency suggesting these to be a suitable candidate as green corrosion inhibitors for metal and alloys under extreme environments.
Keywords: Molten salts, Mild steel, Copper, Stainless steel, EIS, Cyclic voltammetry
1. INTRODUCTION
Ionic Liquids (IL) are under considerable industrial attention due to their intrinsic properties of thermal stability, negligible vapor pressure at room temperature, high decomposition temperature, solvation characteristics, non-flammability, and low melting points [1-4]. Ionic liquids have been referred in literature as fused salts, molten salts, ionic fluids, liquid electrolytes, ionic glasses, ionic melts, ambient temperature molten salts, liquid organic salts and designer chemicals [5]. These salts are referred as designer solvents as their physiochemical properties can be easily modified by changing the relevant anions and cations [6-8]. Ionic liquid mixtures, thus, offer enhanced possibilities for fine-tuning of mixture properties according to the desired applications [6-8].
to conventional IL and organic solvents due to their cost effectiveness, simple synthesis and flexibility in choice of constituent component [11, 12]. These are frequently being employed for applications in fields such as electrochemistry, solvent extraction, nanotechnology, shape controlled nanosized catalyst synthesis, lubricants and zeolite analogues synthesis [13-18].
Corrosion of metal and alloys is a major concern for industries that leads to financial burden in terms of maintenance and replacement costs. Organic polymeric corrosion inhibitors have conventionally been employed extensively to reduce corrosion of metal and alloys in aggressive media. The use of such corrosion inhibitors is particularly limited due to their low solubility in polar electrolytes, toxicity, non-biodegradability and high volatility. Due to increased environmental concerns associated with conventional corrosion inhibitors, recent studies are focused towards the search for environment benign corrosion inhibitors. IL are being recognized as potential green corrosion inhibitors for metals and alloys on account of their relative non-toxicity, biodegradability and high solubility in polar electrolytes [19-21]. The metal-inhibition bonding and electron rich centers acting as adsorption centers in case of IL is analogous as in case of corrosion inhibition mechanism by traditional organic polymeric inhibiters [5, 21]. The corrosion inhibition efficiency and adsorption behavior of few IL, such as azomethine and indazole derivatives, have been reported in literature [21-23]. Corrosion inhibition efficiency of imidazolium based IL in corrosive media have been reported to increase with an increase in the size and number of alkyl chains [19-22]. However, a longer chain molecule reduces the effective movement of inhibitor molecules in polar media. Thus, a moderate size and chain length is more reasonable in enhancing the corrosion inhibition as it favors the movement of inhibitor molecules from solution to the metallic surface as compared to a longer chain molecule [5, 24, 25]. Verma et al. suggested choline based IL to be the best example of moderate chain length and size molecule offering optimum conditions (hydrophilic or hydrophobic) for metal-inhibition interactions [5].
Choline chloride based DES (CDES), such as ChCl-Ur, represent an important class of IL as they are biodegradable, non-toxic, inexpensive and water soluble [26]. In spite of these environment friendly properties, the use of CDES as corrosion inhibitors is quite limited. Very few reports explaining the corrosion inhibition behavior of CDES have been reported in literature. An investigation of the corrosion rates of metal electrodes in ChCl-EG and proline-lactic acid showed increased stability and decreased corrosion rates of titanium, nickel and iron [27]. Kityk et al. studied the kinetics and corrosion mechanism of mild steel in ChCl-Ur and ChCl-EG [28]. They concluded that the corrosion in these media can lead to accelerated corrosion of mild steel due to the presence of chloride ions [28]. Understanding the corrosion rates of DES, proposed as potential lubricants, is an important factor to be researched for their commercial applicability. Abbott et al. evaluated the corrosion rates of aluminum, nickel and steel in CDES and reported to have significantly reduced corrosion rates in such media [18].
2. EXPERIMENTAL PROCEDURES
2.1. Materials
Malonic acid (assay 99% min.), urea (99% min.), glycerol, ethylene glycol and phenol were purchased from LabChem Inc. Triethyene glycol (extra pure) was supplied by SchartauChemie S.A., Spain, respectively. Potentiostat (ACM Instruments - Gill AC), double distilled water (Water Still Aquatron A4000D, UK), precise vacuum oven (Model WOV-30, DAIHAN Scientific Co. Ltd, Korea) fitted with a vacuum pump (Model G-50DA, UlvacKiko, Japan) and hot plate stirrer (MSH-20D, Korea) were used.
2.2. Metal and alloys Composition
Table 1 summarizes the composition of mild and stainless steel. All elements are mentioned other than iron in these alloys
Table 1. Compositional analysis of mild and stainless steel.
C Si Mn P S Cr Ni Mo N
Mild Steel 0.037 0.001 0.151 0.009 0.014 0.017 0.028 0.001 0.003
Stainless
Steel 0.021 0.510 0.950 0.033 0.001 16.8 10.0 2.03 0.039
2.3. CDES Preparation:
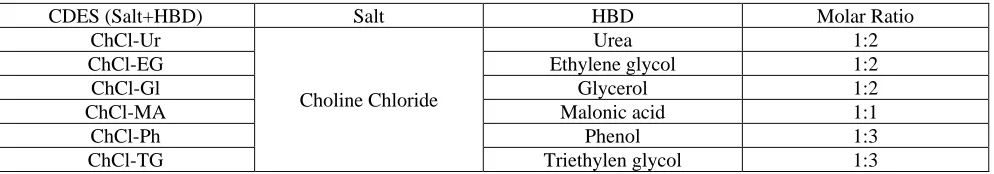
[image:3.596.52.549.627.714.2]21.00 g of the salt, Choline Chloride, was mixed with hydrogen bond donors (HBD) i.e. 18.07g urea, 18.67g ethylene glycol, 27.70g glycerol, 15.65g malonic acid, 42.47g phenol and 67.76g triethylene glycol, respectively according to their respective molar ratios mentioned in literature, as given in Table 2. In each case, the mixture was shaken at 400 rpm and 343 K for one to two hours for the formation of stable DES with no apparent precipitation. All chemicals were subjected to vacuum oven for 24 hours at 343 - 353 K to remove moisture. The prepared DES were put in desiccators to avoid any moisture influence before the measurements.
Table 2. Molar ratio for CDES synthesis
CDES (Salt+HBD) Salt HBD Molar Ratio
ChCl-Ur
Choline Chloride
Urea 1:2
ChCl-EG Ethylene glycol 1:2
ChCl-Gl Glycerol 1:2
ChCl-MA Malonic acid 1:1
ChCl-Ph Phenol 1:3
2.4. Corrosion Tests
A typical 3 electrode cell was used to carry out the electrochemical measurements. A saturated calomel electrode containing potassium chloride was used as reference electrode (RE). The potential of working electrode (WE) was measured with respect to the RE. A platinum wire was used to act as the auxiliary electrode (AE). The platinum wire transmits current through the DES, either to or from the WE. A Gill AC potentiostat was used to connect the three electrodes. Data was recorded from the software coupled with Gill AC potentiostat. The electrodes, with exposed surface area of approximately 7.5 cm2, were immersed in a 17 mL of CDES aqueous solution. Before the start of the experiment, the electrodes were immersed in solution for 5 minutes to ensure the thermal equilibrium of the system. Electrochemical measurements were performed and recorded using A GILL AC potentiostat. The three metals were tested with six DESs and their aqueous mixture (water wt%: 5% and 10%) at 298 K, 323 K and 348 K, respectively. EIS and potentiodynamic polarization curves were performed and reported. The electrochemical impedance spectroscopy was carried out between a frequency range of 1000 Hz to 0.1 Hz with a peak to peak amplitude of 20 mV. The potentiodynamic polarization was conduction within the potential range of -150 mV to +150 mV with a sweep rate of 20 mV/min. The cathodic and anodic regions of the generated Tafel plot were scanned from -150 mV to 0 mV and from 0 mV to + 150 mV, respectively.
3. RESULTS AND DISCUSSION
Electrochemical tests, like linear polarization resistance (LPR), potentiodynamic polarization curves, and Electrochemical Impedance Spectroscopy (EIS) provide a convenient, easy and quick measurements for corrosion rates. Since the corrosion phenomena is time dependent the aforementioned tests may not provide an accurate interpretation of the corrosion rate. Gravimetric method, where the metal is put in the media to be tested then actual change in mass is measured, is more accurate in predicting corrosion rate. Nevertheless, the results obtained from electrochemical tests, besides being quick and convenient can be correlated to the actual corrosion rates, and will give a valid comparison between different metals or different mediums.
The three electrochemical tests mentioned above were performed, and their results show good agreements in describing the corrosion rate trend with respect to the investigated parameters. The full results obtained for the effect of six choline chloride based ionic liquids on acidic corrosion of mild steel, copper and stainless steel has been reported in table 1-18 of the Appendix.
3.1 Potentiodynamic Polarization Studies
using ChCl-Ur are presented in figure 1 – 5 while the complete data for other metals and CDES are presented in table 1-18 of the Appendix
current density [mA/cm2]
10-5 10-4 10-3 10-2 10-1 100 101
P o te n ti a l a g a in st S C E [ m V ] -700 -600 -500 -400 -300
[image:5.596.122.477.130.389.2]0% /25 °C 0% /50 °C 0% /75 °C
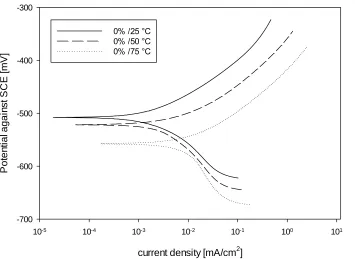
Figure 1. Potentiodynamic polarization curves of copper immersed in pure ChCl-Ur DES (0% water content) at different temperatures
current density [mA/cm2]
10-5 10-4 10-3 10-2 10-1 100 101
P o te n ti a l a g a in st S C E [ m V ] -600 -550 -500 -450 -400 -350 -300
5% /25 °C 5% /50 °C 5% /75 °C
[image:5.596.121.465.460.705.2]
current density [mA/cm2]
10-5 10-4 10-3 10-2 10-1 100 101
P o te n ti a l a g a in st S C E [ m V ] -600 -500 -400 -300
[image:6.596.190.399.101.254.2]10 % /25 °C 10% /50 °C 10% /75 °C
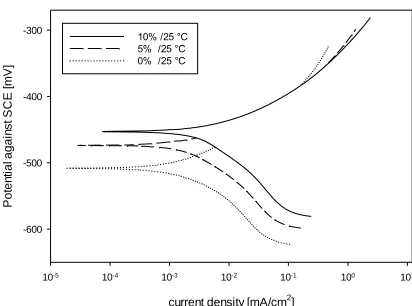
Figure 3. Potentiodynamic polarization curves of copper immersed in ChCl-Ur DES with 10% water content at different temperatures
The data for Copper in ChCl-Ur can be taken as a representative example of the results, the same trend with regards to temperature and water content is observed in the other metals and mediums tested. Figure 1, Figure 2, and Figure 3 show the potentiodynamic polarization curves results for copper in ChCl-Ur at 0% 5% and 10% water content respectively, each figure shows three curves corresponding to different temperatures, namely 25 °C, 50 °C and 75 °C.
The rest potential decreases as temperature increases, this decrease in corrosion potential is cause by a shift in the anodic dissolution of copper, hence the corrosion rate is higher at higher temperatures. A similar trend on the cathodic part of the curve is observed, where the corrosion potential increases as the water content increases, and the increase in potential is accompanied by a shift in the cathodic part of the curve as shown in Figure 4.
current density [mA/cm2]
10-5 10-4 10-3 10-2 10-1 100 101
P o te n ti a l a g a in st S C E [ m V ] -600 -500 -400 -300
[image:6.596.191.397.496.649.2]10% /25 °C 5% /25 °C 0% /25 °C
Temperature [°C]
20 30 40 50 60 70 80
co
rr
o
si
o
n
r
a
te
[
m
m
/y
r]
0.0 0.5 1.0 1.5 2.0
[image:7.596.188.408.73.233.2]10% - EIS 5% - EIS 0% - EIS 10% - CS 5% - CS 0% - CS
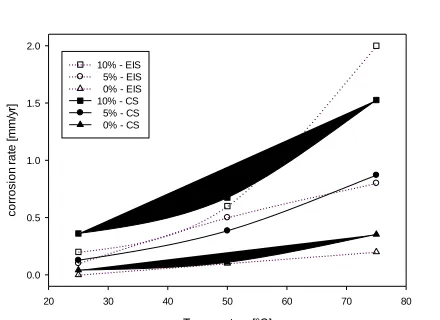
Figure 5. Potentiodynamic polarization curves copper in ChCl-Ur DES at different temperatures and water contents
The values of Tefel parameters from the PPC curves such as slopes (cathodic and anodic), corrosion current density and corrosion potential were determined through extrapolation of linear segments of Tafel cathodic and anodic linear segments. The values of such parameters are presented in table 1-18 of the Appendix
From the results provided in in table 1-18 of the Appendix, it is clear that CDES significantly retards the cathodic and anodic reactions. The significant reduction in the current density in the presence of CDES can be attributed to the adsorption of CDES molecules on the metal surface preventing cathodic or anodic reactions [32, 33].
The corrosion current density increases as the water content in the system increases. It can be seen that increasing the water content at a fixed temperature or increasing the temperature at a fixed water content caused a decrease in the charge transfer resistance Rp and an increase in the double layer
capacitance Cdl. This indicates that the electrochemical process intermediates from the dissolution of
copper have low retention time in this case. The increase in double layer capacitance can be due to a thinner protective film being formed on the copper surface. This can also be attributed to a passive layer formation on the material surface [28]. The displacement of corrosion potential (Ecorr) in the presence or
absence of CDES in the corrosive environment determines the inhibitor type (cathodic, anodic or mixed) [32, 34, 35]. In our present study, both the βc and βa values are affected representing that both metal dissolution (anodic) and hydrogen evolution (cathodic) were inhibited. The inhibition type can be recognized to be cathodic type inhibition as the βc values were more affected compared to βa values [32, 34-37]
3.2 Electrochemical Impedance Spectroscopy (EIS)
different temperatures (25oC, 50oC and 75oC). Figure 6 shows the corrosion rates for copper immersed in 1 M HCl solution with eutectic ionic liquids at various water concentrations (5 – 10 wt%). The results depict that the eutectic ionic liquids act as inhibitor molecules and inhibit corrosion of copper by adsorbing on the material-electrolyte interfaces [31, 39]. Figure 6 show that the presence of water in the solution increases the corrosion rate. The CDES molecules tend to adsorb on the metal/electrolyte surface thus inhibiting corrosion [40]. This suggests that the presence of water in the solution decreases the concentration of the inhibitor in the system and decreases the adsorption of CDES molecules on the metal/electrolyte interface. The decrease in the inhibitor concentration at the metal/electrolyte interface tend to decrease the inhibitive film on the metal surface thus increasing the corrosion rates of copper and other metals.
[image:8.596.62.546.266.450.2]A B
Figure 6. Corrosion rate of copper in CDES with different water contents and at A) 25oC and B) 75oC
The analysis of the electrochemical impedance spectra for 1 M HCl medium with pure eutectic ionic liquids and in the presence of water (5-10 wt%) was carried out with the use of suitable equivalent circuit (as shown in figure 6). The values for the solution resistance Rs, the Double layer capacitor Cdl,
and the polarization resistance Rp, can be obtained and used to interpret the behavior of the system [40,
41]. A Randles circuit with solution resistance Rs, a polarization resistance Rp, and a capacitor Cdl as
shown in Figure 6, was found to best fit the experimental data from the EIS test [40].
[image:8.596.224.358.620.714.2]
The main parameters along with the corrosion rates and inhibition efficiencies are provided in table 1-18 of the Appendix
An attempt was made to replace the double layer capacitance by a Constant phase element CPE, in order to compensate for any non-homogeneity in the system which can be caused for instance by roughness in the surface, as opposed to the ideal response from single electrochemical reactions where the capacitor having a phase equal to 1 [42]. The fitting gave less error but the results didn’t predict the actual behavior of the system which can be confirmed by the results from potentiodynamic polarization curves. This make it clear that upon fitting a data to a circuit, the best model is not necessary the one with the least error but rather the one that best describes the actual system. Results from the fit to the circuit in Figure 6 are in good accord with the results from the potentiodynamic polarization curves.
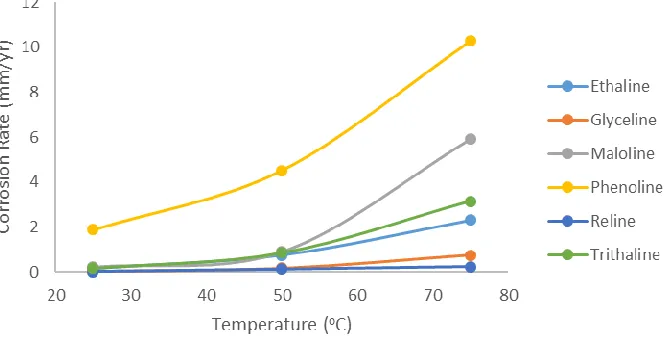
[image:9.596.143.476.365.536.2]Figure 6 presents the corrosion of copper with pure CDES as electrolytes at different temperatures. Inspection of the figure shows that the corrosion of copper increases as the temperature is increased. The maximum inhibition is offered by ChCl-Ur and ChCl-Gl even at elevated temperatures. Similar trends are obvious in case of corrosion of mild steel, copper and stainless steel where the metal corrosion increases with increasing temperature. Similarly, the corrosion rates of mild steel, copper and stainless steel increases with increasing the water content in the solution.
Figure 8. Corrosion rate of copper in pure CDES at different Temperature
corrosion inhibitors on mild steel in acidic media. Additionally, Verma et al. explained in detail the temperature effects on inhibition efficiencies of CDES through Arrhenius equation comparing the activation energies of non-inhibited and inhibited mild steel [5].
It has been established that these CDES are hygroscopic and changes in water contents of the CDES solvents can lead to physicochemical characteristics of these CDES. An increase in the water content in CDES results in decreased viscosity, decreased density and increased conductivity of the CDES-water solution. Thus, an increase in the water content of these CDES effects the physiochemical properties and corrosion activities of CDES on copper, stainless steel and mild steel. Increase in the water content of the CDES results in increased corrosion rates of mild steel, stainless steel and copper. This can be attributed to the reduced viscosity resulting in enhanced diffusion rates. These enhanced diffusion rates can adversely affect the adsorbed CDES protective layer on the material surface. Similar trends were reported by Kityk et al. who reported the mechanism and kinetics of mild steel corrosion in ChCl-EG and ChCl-Ur [28]. Similar studies showing results on the corrosion activities and mechanism of several CDES in acidic environment has been reported in literature [31].
The above results for the corrosion activities of six CDES (ChCl-Ur, ChCl-EG, ChCl-Gl, ChCl-MA, ChCl-Ph and ChCl-TG) on mild steel, stainless steel and copper dictates that two CDES namely ChCl-Ur and ChCl-Gl have lowest corrosion rates for these materials even at elevated temperatures and with moisture content upto 10 wt% percent. This point out towards the fact that these CDES (ChCl-Ur and ChCl-Gl) can be used as corrosion inhibitors in harsh acidic and moist environment for structures and machines related to mild steel, stainless steel and copper.
4. CONCLUSION
In the present study, inhibition effects of six choline based deep eutectic solutions (CDES) has been demonstrated to be effective corrosion inhibitors for copper, mild steel and stainless steel 316. The study reveals that the corrosion rate of these materials increases as the temperature and moisture content increases. The corrosion rate of steel in urea and ethylene glycol based CDES was found to be minimum as compared to other materials and CDES. The corrosion inhibition of stainless steel 316 was found to be maximum in case of pure ChCl-Ur at 25°C. Moreover, the corrosion rate of stainless steel was found to be the lowest at all conditions for urea based CDES materials suggesting it to be suitable for a number of industrial applications. The results suggest that these CDES, urea and glycol based CDES, can be suitable alternatives to traditional organic polymeric corrosion inhibitors.
ACKNOWLEDGEMENT
References
1. Y. Nakata, K. Kohara, K. Matsumoto, and R. Hagiwara, J. Chem. Eng. Data, 56 (2011) 1840 2. K.S. Kim, S.Y. Park, S. Choi, and H. Lee, J. Chem. Eng. Data, 49, (2004) 1550
3. U. Domańska and A. Marciniak, J. Phys. Chem. B, 112 (2008) 11100
4. U. Domańska, A. Marciniak, M. Królikowska, and M. Arasimowicz, J. Chem. Eng. Data, 55 (2010) 2532
5. C. Verma, I. B. Obot, I. Bahadur, E.-S. M. Sherif, and E. E. Ebenso, Appl. Surf. Sci., 457 (2018) 134
6. J. Salgado, T. Regueira, L. Lugo, J. Vijande, J. Fernández, and J. García, J. Chem. Thermodyn., 70 (2014) 101
7. M. T. Clough, C. R. Crick, J. Grasvik, P. A. Hunt, H. Niedermeyer, T. Welton and O. P. Whitaker,
Chem. Sci., 6 (2015) 1101
8. M. Freemantle, Chem. Eng. News, 76 (1998) 32
9. A. P. Abbott, G. Capper, D. L. Davies, R. K. Rasheed, and V. Tambyrajah, Chem. Commun., 1 (2003) 70
10.A. P. Abbott, R. C. Harris, K. S. Ryder, C. D'Agostino, L. F. Gladden, and M. D. Mantle, Green Chem., 13 (2011) 82
11.M. A. Kareem, F. S. Mjalli, M. A. Hashim, and I. M. AlNashef, J. Chem. Eng. Data, 55 (2010) 4632
12.A. P. Abbott, D. Boothby, G. Capper, D. L. Davies, and R. K. Rasheed, J. Am. Chem. Soc., 126 (2004) 9142
13.E. R. Cooper, C. D. Andrews, P. S. Wheatley, P. B. Webb, P. Wormald, and R. E. Morris, Nature,
430 (2004) 1012
14.P. Dominguez de Maria and Z. Maugeri, Curr. Opin. Chem. Biol., 15 (2011) 220
15.A. Abo-Hamad, M. Hayyan, M. A. AlSaadi, and M. A. Hashim, Chem. Eng. J., 273 (2015) 551 16.M. A. Kareem, F. S. Mjalli, M. A. Hashim, and I. M. AlNashef, " Fluid Phase Equilib., 314 (2012)
52
17.H.G. Liao, Y.X. Jiang, Z.Y. Zhou, S.P. Chen, and S.G. Sun, Angew. Chem., Int. Ed., 47 (2008) 9100
18.A. P. Abbott, E. I. Ahmed, R. C. Harris, and K. S. Ryder, Green Chem., 16 (2014) 4156
19.J. G. Huddleston, A. E. Visser, W. M. Reichert, H. D. Willauer, G. A. Broker, and R. D. Rogers,
Green Chem., 3 (2001) 156
20.W. E. S. Hart, J. B. Harper, and L. Aldous, Green Chem., 17 (2015) 214
21.C. Verma, E. E. Ebenso, and M. A. Quraishi, J. Mol. Liq., 248 (2017) 927
22.H. Hamani, T. Douadi, D. Daoud, M. Al-Noaimi, and S. Chafaa, Meas., 94 (2016) 837 23.Y. Qiang, S. Zhang, S. Yan, X. Zou, and S. Chen, Corros. Sci., 126 (2017) 295
24.C. Zuriaga-Monroy, R. Oviedo-Roa, L. E. Montiel-Sánchez, A. Vega-Paz, J. Marín-Cruz, and J.-M. Martínez-Magadán, Ind. Eng. Chem. Res., 55 (2016) 3506
25.S. Yesudass, Lukman O. Olasunkanmi, I. Bahadur, M. M. Kabanda, I. B. Obot, and Eno E. Ebenso,
J. Taiwan Inst. Chem. Eng., 64 (2016) 252
26.D. Rengstl, V. Fischer, and W. Kunz, Phys. Chem. Chem. Phys., 16 (2014) 22815
27.D. Di Marino, M. Shalaby, S. Kriescher, and M. Wessling, Electrochem. Commun., 90 (2018) 101 28.A. A. Kityk, Y. D. Rublova, A. Kelm, V. V. Malyshev, N. G. Bannyk, and I. Flis-Kabulska, J.
Electroanal. Chem., 823 (2018) 234
29.K. Haerens, E. Matthijs, A. Chmielarz, and B. Van der Bruggen, J. Environ. Manag., 90 (2009) 3245
30.B. Dilasari, Y. Jung, J. Sohn, S. Kim, and K. Kwon, Int. J. Electrochem. Sci., 11 (2016) 1482 31.R. Solmaz, Corros. Sci., 81 (2014) 75
34.P. Mourya, S. Banerjee, and M. M. Singh, Corros. Sci., 85 (2014) 352
35.C. Verma, M. A. Quraishi, K. Kluza, M. Makowska-Janusik, L. O. Olasunkanmi, and E. E. Ebenso,
Sci. Rep., 7 (2017) 44432
36.P. Singh, E. E. Ebenso, L. O. Olasunkanmi, I. B. Obot, and M. A. Quraishi, J. Phys. Chem. C, 120
(2016) 3408
37.C. Verma, M. A. Quraishi, L. O. Olasunkanmi, and E. E. Ebenso, RSC Adv., 5 (2015) 85417 38.C. Verma, M. A. Quraishi, and A. Singh, J. Taiwan Inst. Chem. Eng., 58 (2016) 127
39.M. Chevalier, F. Robert, N. Amusant, M. Traisnel, C. Roos, and M. Lebrini, Electrochim. Acta, 131 (2014) 96
40.R. Solmaz, G. Kardaş, M. Çulha, B. Yazıcı, and M. Erbil, Electrochim. Acta, 53 (2008) 5941 41.L. R. Chauhan and G. Gunasekaran, Corros.Sci., 49 (2007) 1143
42.M. E. Orazem and B. Tribollet, Electrochemical Impedance Spectroscopy. Wiley, (2011) New Jersey.
Appendix
EIS and CS parameters obtained using Glyceline on copper.
obtained for mild steel in 1 M HCl in absence and presence of different concentrations of GPHs.
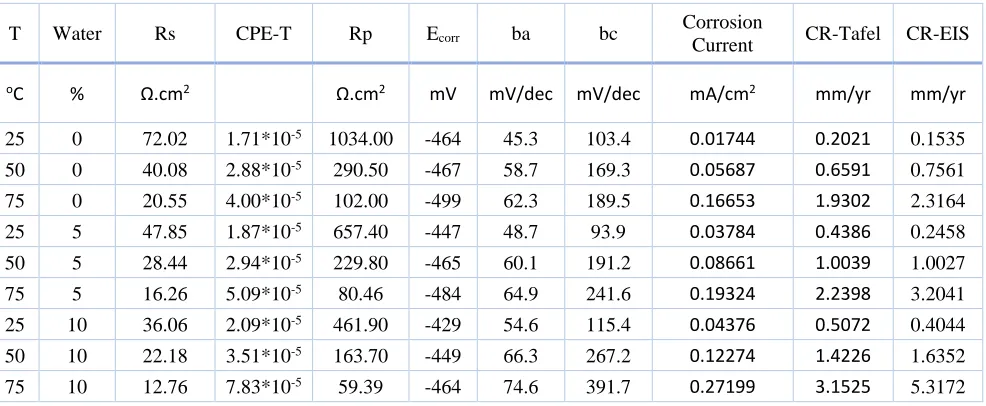
[image:12.596.55.548.517.720.2]Copper:
Table 1. EIS and PPC parameters obtained for Copper in ChCl-EG (in absence and presence of different water content)
T Water Rs CPE-T Rp Ecorr ba bc Corrosion
Current CR-Tafel CR-EIS
oC % Ω.cm2 Ω.cm2 mV mV/dec mV/dec mA/cm2 mm/yr mm/yr
25 0 72.02 1.71*10-5 1034.00 -464 45.3 103.4 0.01744 0.2021 0.1535
50 0 40.08 2.88*10-5 290.50 -467 58.7 169.3 0.05687 0.6591 0.7561
75 0 20.55 4.00*10-5 102.00 -499 62.3 189.5 0.16653 1.9302 2.3164
25 5 47.85 1.87*10-5 657.40 -447 48.7 93.9 0.03784 0.4386 0.2458
50 5 28.44 2.94*10-5 229.80 -465 60.1 191.2 0.08661 1.0039 1.0027
75 5 16.26 5.09*10-5 80.46 -484 64.9 241.6 0.19324 2.2398 3.2041
25 10 36.06 2.09*10-5 461.90 -429 54.6 115.4 0.04376 0.5072 0.4044
50 10 22.18 3.51*10-5 163.70 -449 66.3 267.2 0.12274 1.4226 1.6352
Table 2. EIS and PPC parameters obtained for Copper in ChCl-GI (in absence and presence of different water content)
T Water Rs CPE-T Rp Ecorr ba bc Corrosion
Current CR-Tafel CR-EIS
oC % Ω.cm2 Ω.cm2 mV mV/dec mV/dec mA/cm2 mm/yr mm/yr
25 0 414.30 6.53*10-6 4028.00 -451 65.9 105.4 0.00603 0.0699 0.0507
50 0 141.40 2.38*10-5 1154.00 -481 61.0 121.0 0.01435 0.1663 0.1771
75 0 52.28 4.50*10-5 373.70 -516 70.0 254.9 0.03122 0.3619 0.7406
25 5 217.50 1.22*10-5 1817.00 -434 60.7 104.1 0.00865 0.1002 0.1063
50 5 77.80 2.75*10-5 590.00 -461 57.8 145.7 0.02391 0.2772 0.3535
75 5 30.40 4.38*10-5 241.20 -495 71.6 391.2 0.04435 0.5140 1.2645
25 10 117.10 1.27*10-5 1397.00 -413 54.8 93.9 0.01788 0.2073 0.1248
50 10 48.83 3.05*10-5 387.10 -443 59.7 150.0 0.03548 0.4113 0.5559
[image:13.596.52.548.370.576.2]75 10 26.59 5.77*10-5 210.60 -478 71.8 404.9 0.05112 0.5925 1.4593
Table 3. EIS and PPC parameters obtained for Copper in ChCl-MA (in absence and presence of different water content)
T Water Rs CPE-T Rp Ecorr ba bc Corrosion
Current CR-Tafel CR-EIS
oC % Ω.cm2 Ω.cm2 mV mV/dec mV/dec mA/cm2 mm/yr mm/yr
25 0 1078.00 2.97*10-5 1025.00 -449 70.1 119.3 0.00743 0.0861 0.2171
50 0 355.90 8.82*10-5 302.90 -429 81.4 157.1 0.02983 0.3457 0.8920
75 0 126.80 2.50*10-4 70.30 -421 125.6 239.2 0.33317 3.8616 5.9035
25 5 363.20 1.11*10-4 483.50 -389 68.9 107.9 0.02665 0.3089 0.4383
50 5 118.40 2.37*10-4 125.50 -383 81.6 146.1 0.11952 1.3853 2.1023
75 5 52.82 2.69*10-4 31.81 -388 104.8 309.4 0.83284 9.6530 12.4016
25 10 159.90 2.00*10-4 266.40 -361 61.8 123.5 0.05716 0.6625 0.7791
50 10 60.50 2.21*10-4 66.88 -362 80.4 143.1 0.22076 2.5587 3.8787
75 10 26.35 3.20*10-4 22.97 -372 95.4 281.6 1.02547 11.8856 15.6332
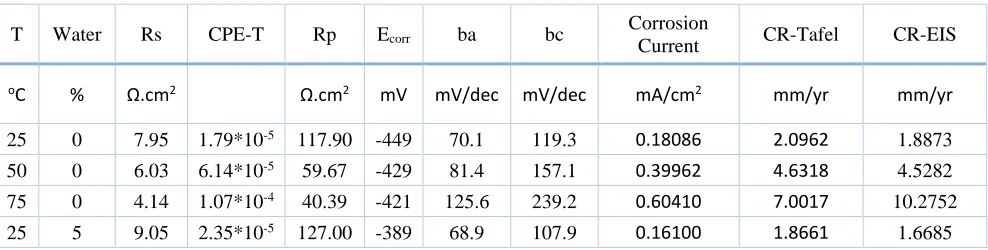
Table 4. EIS and PPC parameters obtained for Copper in ChCl-Ph (in absence and presence of different water content)
T Water Rs CPE-T Rp Ecorr ba bc Corrosion
Current CR-Tafel CR-EIS
oC % Ω.cm2 Ω.cm2 mV mV/dec mV/dec mA/cm2 mm/yr mm/yr
25 0 7.95 1.79*10-5 117.90 -449 70.1 119.3 0.18086 2.0962 1.8873
50 0 6.03 6.14*10-5 59.67 -429 81.4 157.1 0.39962 4.6318 4.5282
75 0 4.14 1.07*10-4 40.39 -421 125.6 239.2 0.60410 7.0017 10.2752
[image:13.596.53.547.636.761.2]
50 5 6.42 7.97*10-5 54.49 -383 81.6 146.1 0.33781 3.9154 4.8421
75 5 3.92 1.62*10-4 31.06 -388 104.8 309.4 0.56566 6.5563 12.7010
25 10 9.51 2.54*10-5 129.90 -361 61.8 123.5 0.15830 1.8347 1.5979
50 10 6.46 8.73*10-5 55.66 -362 80.4 143.1 0.36084 4.1823 4.6606
[image:14.596.50.549.238.443.2]75 10 3.81 1.56*10-4 29.42 -372 95.4 281.6 0.41409 4.7995 12.2058
Table 5. EIS and PPC parameters obtained for Copper in ChCl-Ur (in absence and presence of different water content)
T Water Rs CPE-T Rp Ecorr ba bc Corrosion
Current CR-Tafel CR-EIS
oC % Ω.cm2 Ω.cm2 mV mV/dec mV/dec mA/cm2 mm/yr mm/yr
25 0 981.20 9.14*10-6 5979.00 -498 57.3 78.3 0.00358 0.0440 0.0279
50 0 177.60 1.52*10-5 1559.00 -533 56.6 113.4 0.00945 0.1142 0.1220
75 0 74.30 1.14*10-5 1021.00 -547 63.8 164.5 0.03045 0.3285 0.2269
25 5 118.60 1.44*10-5 1575.00 -468 41.0 79.2 0.01098 0.1273 0.0864
50 5 44.29 2.15*10-5 440.80 -489 58.6 125.5 0.03315 0.3653 0.4567
75 5 32.39 1.92*10-5 353.80 -519 66.0 264.1 0.07506 0.9281 0.7521
25 10 47.48 1.62*10-5 846.80 -422 44.8 121.0 0.03115 0.3396 0.1946
50 10 26.44 2.37*10-5 346.40 -465 56.7 131.7 0.05815 0.6640 0.5766
[image:14.596.50.549.528.733.2]75 10 17.94 4.02*10-5 132.80 -491 66.7 263.5 0.13169 1.4818 2.0198
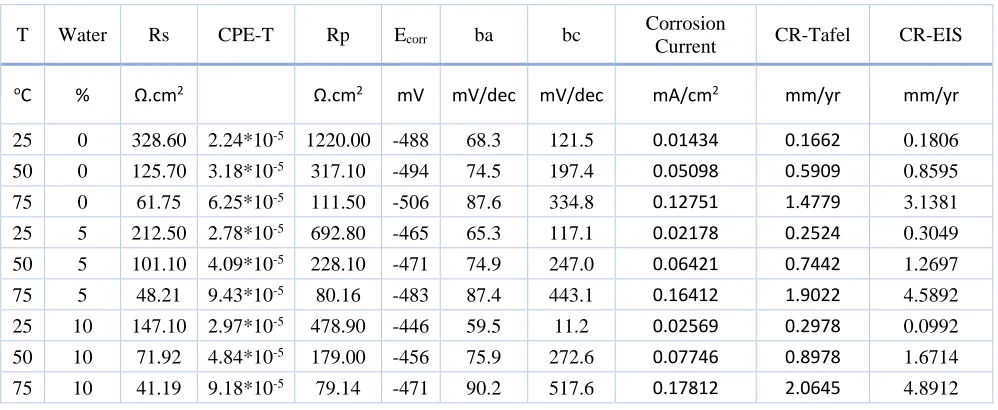
Table 6. EIS and PPC parameters obtained for Copper in ChCl-TG (in absence and presence of different water content)
T Water Rs CPE-T Rp Ecorr ba bc Corrosion
Current CR-Tafel CR-EIS
oC % Ω.cm2 Ω.cm2 mV mV/dec mV/dec mA/cm2 mm/yr mm/yr
25 0 328.60 2.24*10-5 1220.00 -488 68.3 121.5 0.01434 0.1662 0.1806
50 0 125.70 3.18*10-5 317.10 -494 74.5 197.4 0.05098 0.5909 0.8595
75 0 61.75 6.25*10-5 111.50 -506 87.6 334.8 0.12751 1.4779 3.1381
25 5 212.50 2.78*10-5 692.80 -465 65.3 117.1 0.02178 0.2524 0.3049
50 5 101.10 4.09*10-5 228.10 -471 74.9 247.0 0.06421 0.7442 1.2697
75 5 48.21 9.43*10-5 80.16 -483 87.4 443.1 0.16412 1.9022 4.5892
25 10 147.10 2.97*10-5 478.90 -446 59.5 11.2 0.02569 0.2978 0.0992
50 10 71.92 4.84*10-5 179.00 -456 75.9 272.6 0.07746 0.8978 1.6714
Mild steel:
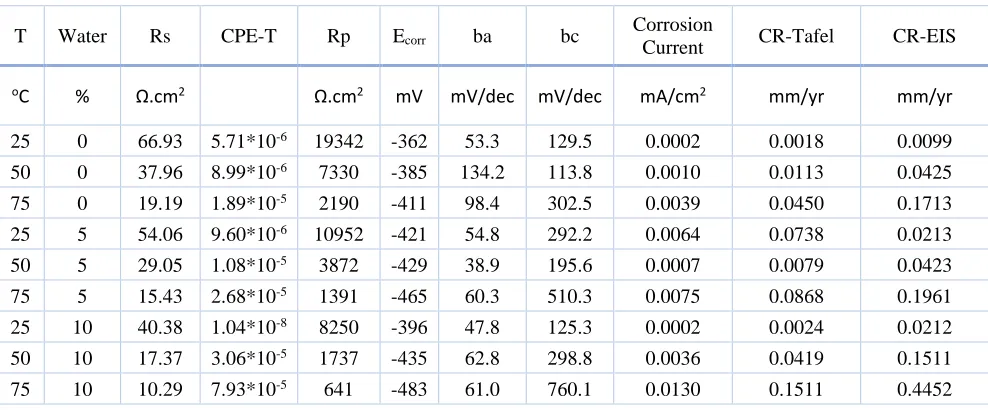
Table 7. EIS and PPC parameters obtained for mild steel in ChCl-EG (in absence and presence of different water content)
T Water Rs CPE-T Rp Ecorr ba bc Corrosion
Current CR-Tafel CR-EIS
oC % Ω.cm2 Ω.cm2 mV mV/dec mV/dec mA/cm2 mm/yr mm/yr
25 0 66.93 5.71*10-6 19342 -362 53.3 129.5 0.0002 0.0018 0.0099
50 0 37.96 8.99*10-6 7330 -385 134.2 113.8 0.0010 0.0113 0.0425
75 0 19.19 1.89*10-5 2190 -411 98.4 302.5 0.0039 0.0450 0.1713
25 5 54.06 9.60*10-6 10952 -421 54.8 292.2 0.0064 0.0738 0.0213
50 5 29.05 1.08*10-5 3872 -429 38.9 195.6 0.0007 0.0079 0.0423
75 5 15.43 2.68*10-5 1391 -465 60.3 510.3 0.0075 0.0868 0.1961
25 10 40.38 1.04*10-8 8250 -396 47.8 125.3 0.0002 0.0024 0.0212
50 10 17.37 3.06*10-5 1737 -435 62.8 298.8 0.0036 0.0419 0.1511
75 10 10.29 7.93*10-5 641 -483 61.0 760.1 0.0130 0.1511 0.4452
Table 8. EIS and PPC parameters obtained for mild steel in ChCl-GI (in absence and presence of different water content)
T Water Rs CPE-T Rp Ecorr ba bc Corrosion
Current CR-Tafel CR-EIS
oC % Ω.cm2 Ω.cm2 mV mV/dec mV/dec mA/cm2 mm/yr mm/yr
25 0 484.6 1.60*10-6 55350 -356 70.9 67.4 6.0*10-6 6.7*10-5 0.0032
50 0 152.6 4.39*10-6 12819 -383 46.9 173.0 1.2*10-4 1.4*10-3 0.0145
75 0 59.83 9.42*10-6 3796 -411 42.3 452.2 5.2*10-4 6.0*10-3 0.0515
25 5 191.7 5.75*10-6 17114 -389 56.5 133.4 4.8*10-5 5.6*10-4 0.0117
50 5 72.39 6.74*10-6 6609 -404 44.7 316.8 4.2*10-4 4.8*10-4 0.0300
75 5 38.56 1.07*10-6 2346 -465 53.9 754.2 1.7*10-3 2.0*10-2 0.1084
25 10 160.3 5.18*10-6 13689 -398 57.2 148.8 1.0*10-4 1.2*10-3 0.0153
50 10 52.48 1.08*10-5 4811 -448 42.5 318.2 4.2*10-4 4.8*10-3 0.0394
[image:15.596.52.546.157.362.2] [image:15.596.52.546.461.663.2]
Table 9. EIS and PPC parameters obtained for mild steel in ChCl-MA (in absence and presence of different water content)
T Water Rs CPE-T Rp Ecorr ba bc Corrosion
Current CR-Tafel CR-EIS
oC % Ω.cm2 Ω.cm2 mV mV/dec mV/dec mA/cm2 mm/yr mm/yr
25 0 1643 2.53*10-5 2871 -423 113.6 183.7 0.0050 0.0577 0.1236
50 0 498.4 2.85*10-5 717.4 -422 152.9 204.2 0.0300 0.3488 0.6159
75 0 146.8 3.81*10-5 104.1 -439 218.3 270.9 0.1870 2.1741 5.8693
25 5 550.9 2.61*10-5 1861 -414 97.4 166.3 0.0087 0.1015 0.1668
50 5 154.4 3.13*10-5 393.5 -430 158.7 230.3 0.0795 0.9243 1.2070
75 5 76.83 4.26*10-5 53.88 -433 220.5 246.2 0.3922 4.5597 10.9139
25 10 230.1 3.36*10-5 973.4 -421 87.5 141.0 0.0167 0.1942 0.2804
50 10 69.36 4.00*10-5 177.5 -430 162.7 209.6 0.1563 1.8171 2.6089
75 10 30.6 6.83*10-5 25.43 -429 230.6 241.8 0.9630 11.1959 23.4628
Table 10. EIS and PPC parameters obtained for mild steel in ChCl-Ph (in absence and presence of different water content)
T Water Rs CPE-T Rp Ecorr ba bc Corrosion
Current CR-Tafel CR-EIS
oC % Ω.cm2 Ω.cm2 mV mV/dec mV/dec mA/cm2 mm/yr mm/yr
25 0 7.043 2.83*10-5 915.8 -630 80.2 631.0 0.0251 0.2918 0.3926
50 0 4.544 5.58*10-5 381.5 -680 68.6 558.9 0.0447 0.5197 0.8099
75 0 4.085 1.22*10-4 162.4 -676 66.1 333.4 0.0880 1.0231 1.7162
25 5 5.282 3.72*10-5 631.9 -635 84.0 505.5 0.0135 0.1570 0.5762
50 5 4.628 1.81*10-6 334.1 -673 70.2 469.4 0.0475 0.5522 0.9239
75 5 4.31 9.32*10-5 201 -680 64.7 312.8 0.0820 0.9533 1.3480
25 10 5.513 7.47*10-5 518 -636 70.8 562.1 0.0149 0.1732 0.6132
50 10 4.753 9.32*10-5 224.2 -679 68.8 593.1 0.0393 0.4567 1.3891
[image:16.596.50.551.142.347.2] [image:16.596.53.546.419.623.2]
Table 11. EIS and PPC parameters obtained for mild steel in ChCl-Ur (in absence and presence of different water content)
T Water Rs CPE-T Rp Ecorr ba bc Corrosion
Current CR-Tafel CR-EIS
oC % Ω.cm2 Ω.cm2 mV mV/dec mV/dec mA/cm2 mm/yr mm/yr
25 0 1094 1.77*10-8 2.56E+05 -288 417.4 67.7 1.0*10-6 1.5*10-5 0.0012
50 0 237.4 1.80*10-6 1.31E+05 -154 332.8 61.5 3.0*10-6 3.2*10-5 0.0020
75 0 90.43 3.76*10-6 40036 -158 303.9 87.3 2.0*10-5 2.4*10-4 0.0086
25 5 110.9 9.74*10-8 5.30E+04 -275 471.3 74.5 3.3*10-5 3.8*10-4 0.0061
50 5 52.92 6.63*10-6 23203 -200 537.7 104.8 3.1*10-5 3.6*10-4 0.0191
75 5 23.46 7.58*10-6 3722 -324 218.7 167.9 2.4*10-4 2.8*10-3 0.1290
25 10 62.82 5.29*10-6 26821 -345 202.4 133.8 1.4*10-5 1.6*10-4 0.0152
50 10 28.25 1.43*10-5 3171 -339 263.6 195.5 1.2*10-4 1.4*10-3 0.1789
75 10 17.07 1.95*10-5 1937 -285 885.7 133.4 3.3*10-3 3.8*10-2 0.3026
Table 12. EIS and PPC parameters obtained for mild steel in ChCl-TG (in absence and presence of different water content)
T Water Rs CPE-T Rp Ecorr ba bc Corrosion
Current CR-Tafel CR-EIS
oC % Ω.cm2 Ω.cm2 mV mV/dec mV/dec mA/cm2 mm/yr mm/yr
25 0 423.4 1.36*10-5 8429 -408 47.4 336.9 0.0002 0.0028 0.0249
50 0 156.3 3.57*10-5 2334 -527 63.3 392.1 0.0031 0.0356 0.1180
75 0 72.06 2.61*10-5 1677 -595 73.4 437.7 0.0090 0.1044 0.1894
25 5 220 2.64*10-5 4511 -523 55.9 314.8 0.0008 0.0096 0.0532
50 5 105.2 3.13*10-5 2517 -575 60.1 343.7 0.0039 0.0458 0.1027
75 5 57.73 3.78*10-5 985.7 -604 102.5 366.2 0.0124 0.1436 0.4108
25 10 155.2 4.48*10-5 4067 -541 58.2 299.4 0.0009 0.0103 0.0606
50 10 75.14 4.98*10-5 1780 -579 68.3 356.5 0.0054 0.0630 0.1628
[image:17.596.49.557.119.323.2] [image:17.596.50.547.399.602.2]
Table 13. EIS and PPC parameters obtained for stainless steel 316 in ChCl-EG (in absence and presence of different water content)
T Water Rs CPE-T Rp Ecorr ba bc Corrosion
Current CR-Tafel CR-EIS
oC % Ω.cm2 Ω.cm2 mV mV/dec mV/dec mA/cm2 mm/yr mm/yr
25 0 82.9 1.86*10-6 31650 -312 106.2 75.7 1.4*10-5 1.6*10-4 0.0072
50 0 42.5 6.32*10-6 18913 -238 64.3 83.8 1.6*10-5 1.9*10-4 0.0099
75 0 23.3 1.09*10-5 7610 -185 100.3 123.9 2.3*10-4 2.7*10-3 0.0375
25 5 62.3 3.53*10-6 30047 -158 143.1 57.6 6.0*10-6 6.6*10-5 0.0070
50 5 28.4 5.83*10-6 22785 -157 65.6 97.6 0.0*100 0.0*100 0.0089
75 5 16.1 1.31*10-5 7091 -167 70.8 135.8 1.5*10-5 1.8*10-3 0.0338
25 10 44.5 4.69*10-6 33617 -175 376.7 63.0 7.0*10-6 8.0*10-5 0.0083
50 10 20.6 1.29*10-5 14469 -151 130.6 70.8 1.1*10-5 1.3*10-4 0.0164
75 10 13.8 1.17*10-5 7355 -173 45.7 127.2 1.9*10-4 2.3*10-3 0.0236
Table 14. EIS and PPC parameters obtained for stainless steel 316 in ChCl-GI (in absence and presence of different water content)
T Water Rs CPE-T Rp Ecorr ba bc Corrosion
Current CR-Tafel CR-EIS
oC % Ω.cm2 Ω.cm2 mV mV/dec mV/dec mA/cm2 mm/yr mm/yr
25 0 491.2 2.39*10-6 35871 -215 228.9 46.6 8.0*10-6 9.3*10-5 0.0056
50 0 186.9 3.29*10-6 17191 -192 65.5 73.2 2.0*10-6 2.6*10-5 0.0104
75 0 86.3 7.36*10-6 6645 -200 60.8 165.8 1.1*10-4 1.2*10-3 0.0345
25 5 309.1 2.83*10-6 17175 -308 505.6 75.4 1.8*10-5 2.1*10-4 0.0197
50 5 94.1 4.33*10-6 10722 -166 77.7 82.0 1.2*10-5 1.5*10-4 0.0192
75 5 62.9 1.11*10-5 5651 -184 52.8 180.7 1.4*10-4 1.6*10-3 0.0373
25 10 135.7 6.37*10-6 13166 -313 821.7 91.7 2.2*10-5 2.6*10-4 0.0323
50 10 65.7 1.15*10-6 9176 -96 115.7 84.0 7.0*10-6 7.9*10-5 0.0273
[image:18.596.53.547.371.575.2]
Table 15. EIS and PPC parameters obtained for stainless steel 316 in ChCl-MA (in absence and presence of different water content)
T Water Rs CPE-T Rp Ecorr ba bc Corrosion
Current CR-Tafel CR-EIS
oC % Ω.cm2 Ω.cm2 mV mV/dec mV/dec mA/cm2 mm/yr mm/yr
25 0 1524.0 2.43*10-5 7746 -231 76.0 96.3 0.0004 0.0052 0.0283
50 0 325.3 3.13*10-5 4109 -221 76.9 124.5 0.0042 0.0500 0.0596
75 0 123.3 5.86*10-5 935 -227 78.2 170.5 0.0227 0.2688 0.2954
25 5 361.9 3.02*10-5 6186 -250 82.3 122.6 0.0008 0.0100 0.0410
50 5 110.6 4.25*10-5 2184 -240 66.3 141.5 0.0107 0.1264 0.1065
75 5 46.6 1.00*10-4 360 -262 57.4 153.6 0.0913 1.0821 0.5990
25 10 144.5 3.63*10-5 5034 -256 71.3 113.6 0.0021 0.0250 0.0448
50 10 58.1 5.09*10-5 1218 -257 56.6 141.3 0.0249 0.2948 0.1710
75 10 30.1 1.22*10-4 230 -280 68.0 157.0 0.1474 1.7472 1.0627
Table 16. EIS and PPC parameters obtained for stainless steel 316 in ChCl-Ph (in absence and presence of different water content)
T Water Rs CPE-T Rp Ecorr ba bc Corrosion
Current CR-Tafel CR-EIS
oC % Ω.cm2 Ω.cm2 mV mV/dec mV/dec mA/cm2 mm/yr mm/yr
25 0 7.6 9.81*10-6 25100 -123 361.2 87.0 4.8*10-5 5.7*10-4 0.0144
50 0 5.0 1.16*10-5 9320 -106 421.9 81.6 6.7*10-5 7.9*10-4 0.0378
75 0 5.3 4.93*10-6 6874 -76 288.3 86.9 1.2*10-4 1.4*10-3 0.0501
25 5 7.7 8.79*10-6 23967 -121 446.8 70.4 3.0*10-5 3.5*10-4 0.0131
50 5 4.5 1.52*10-5 11340 -99 451.3 128.0 1.7*10-4 2.1*10-3 0.0453
75 5 4.7 7.79*10-6 4195 -74 367.2 76.1 8.7*10-5 1.0*10-3 0.0775
25 10 10.0 5.91*10-6 12817 -122 857.2 67.0 3.0*10-5 3.5*10-4 0.0250
50 10 7.0 6.39*10-6 8023 -95 736.9 91.1 8.7*10-5 1.0*10-3 0.0521
[image:19.596.54.547.371.575.2]
Table 17. EIS and PPC parameters obtained for stainless steel 316 in ChCl-Ur (in absence and presence of different water content)
T Water Rs CPE-T Rp Ecorr ba bc Corrosion
Current CR-Tafel CR-EIS
oC % Ω.cm2 Ω.cm2 mV mV/dec mV/dec mA/cm2 mm/yr mm/yr
25 0 995.0 1.01*10-6 266760 -294 1564.1 45.8 8.0*10-6 8.9*10-5 0.0009
50 0 166.2 2.34*10-6 62660 -220 606.7 54.8 1.3*10-5 1.6*10-4 0.0041
75 0 103.9 2.11*10-6 23778 -177 423.8 60.3 1.3*10-5 1.5*10-4 0.0114
25 5 198.6 1.09*10-6 207710 -239 591.4 40.8 4.0*10-6 5.3*10-5 0.0009
50 5 56.8 7.98*10-6 16327 -240 600.8 48.5 7.0*10-6 7.8*10-5 0.0142
75 5 44.7 2.60*10-6 14565 -164 378.1 70.5 3.0*10-5 3.4*10-4 0.0210
25 10 80.1 6.76*10-6 16141 -327 570.5 105.2 8.9*10-5 1.1*10-3 0.0284
50 10 31.9 3.60*10-6 15951 -238 487.9 57.8 1.0*10-5 1.2*10-4 0.0167
75 10 24.4 2.12*10-6 10671 -120 344.1 68.7 3.5*10-5 4.1*10-4 0.0276
Table 18. EIS and PPC parameters obtained for stainless steel 316 in ChCl-TG (in absence and presence of different water content)
T Water Rs CPE-T Rp Ecorr ba bc Corrosion
Current CR-Tafel CR-EIS
oC % Ω.cm2 Ω.cm2 mV mV/dec mV/dec mA/cm2 mm/yr mm/yr
25 0 445.7 9.02*10-6 16604 -146 55.6 146.8 2.1*10-4 2.5*10-3 0.0125
50 0 156.5 1.89*10-5 5084 -146 55.6 146.8 5.7*10-4 6.7*10-3 0.0409
75 0 80.8 2.22*10-5 3505 -156 77.2 333.4 1.3*10-3 1.5*10-2 0.0922
25 5 272.0 2.10*10-5 9587 -57 39.2 103.8 6.1*10-5 7.3*10-4 0.0153
50 5 107.5 3.93*10-5 4827 -68 92.2 258.1 2.8*10-4 3.3*10-3 0.0725
75 5 60.9 3.88*10-5 4426 -126 91.9 283.0 5.9*10-4 7.0*10-3 0.0808
25 10 213.5 2.39*10-5 9786 27 65.7 101.8 2.6*10-5 3.1*10-4 0.0210
50 10 83.5 3.75*10-5 5800 -40 88.3 180.6 1.9*10-4 2.2*10-3 0.0527
75 10 43.9 4.09*10-5 4941 -102 79.6 238.1 2.8*10-4 3.3*10-3 0.0622
[image:20.596.53.546.371.575.2]