Int. J. Electrochem. Sci., 12 (2017) 4940 – 4957, doi: 10.20964/2017.06.51
International Journal of
ELECTROCHEMICAL
SCIENCE
www.electrochemsci.orgDischarge Capacity of Energy Storages as a Function of the
Discharge Current –Expanding Peukert’s equation
Christoph Nebl, Fabian Steger, Hans-Georg Schweiger*
Centre for Applied Research, Technische Hochschule Ingolstadt (THI), Esplanade 10, 85049 Ingolstadt, Germany
*
E-mail: hans-georg.schweiger@thi.de
Received: 27 July 2016 / Accepted: 16 March 2017 / Published: 12 May 2017
In 1897 Wilhelm Peukert tested lead-acid batteries with constant current and observed that a single equation can describe the relationship between the discharge capacity of the battery and a constant discharge current. In this article the dependence of the discharge capacity of lithium-ion battery cells, electrochemical double-layer capacitors and lithium capacitors are investigated from low to very high discharge rates. From low to intermediate discharge rates, these energy storage devices show ideal Peukert behavior, but a deviation was observed at high discharge rates. The cells provide less charge than predicted by Peukert’s Law. To describe this deviation, a new equation has been derived by expanding Peukert’s law to very discharge rates. It is capable to describe the discharge behavior of lithium-ion battery cells, electrochemical double-layer capacitors and lithium capacitors from low to high discharge rates in an unequivocal way.
Keywords: discharge capacity, lithium-ion cell, electrochemical double-layer capacitors, lithium capacitors, capacity, Peukert equation, discharge current
1. INTRODUCTION
The electrification of the powertrain of road vehicles e.g. in hybrid or battery electric vehicles (HEV and BEV) offer a wide variety of opportunities to influence vehicle dynamics and driving stability. One example is active yaw control [1]. Precise knowledge of the available battery discharge capacity at high current loads is necessary for safe vehicle operation [2]. This knowledge is also mandatory for designing the operation strategy of hybrid and electric vehicles to prevent unintended loss of power during acceleration [3]. Even the selection of fuses and other overcurrent protection devices for battery systems requires prediction of the maximum charge, which can be delivered by the battery cells under very high discharge rates [4].
conditions. The findings will help to increase the scope of application and accuracy of physical models of lithium-ion batteries by extending the operating area.
2. CURRENT STATE OF THE SCIENCE
Discharge capacity Q of a battery or any other energy storage device is the amount of charge which can be withdrawn by discharging from maximum operating voltage to minimum operating voltage. It is determined by the integration of the current from the starting time tstart to tend.
∫
Equation 2 was derived empirically from measurements with lead acid batteries by W. Peukert in 1897 [5]. It describes the dependence of the discharge duration t from the applied discharge current I [5]:
Qp is the battery capacity at 1 A discharge current, t the time in hours the battery needs to be completely discharged [5], and k the dimensionless Peukert-number, which is referred to as the Peukert exponent [5]. All discharges conducted until to the cut-off voltage of the cell, stated by the manufacturer, are reached. A considerable difficulty of this classical Peukert equation 2 is the occurring unit uncertainty, if the dimensionless Peukert exponent k is not one, which is always the case. Up to this point, this inaccuracy doesn’t influence the validity of Peukert’s Law. But Peukert’s equation is only directly usable, if the rated capacity Qp is determined at 1 A [6]. Otherwise the equation cannot be used due to this issue. For other discharge currents it needs to be transposed into the following equation:
( )
Thereby, t is the actual discharge time at the actual discharge current I of the battery, Ira the rated discharge current, and k the dimensionless Peukert-exponent.
The Peukert exponent k can be determined by discharging the cell with two discharge currents (I1, I2) which can differ from the rated current and result in two discharge times (t1, t2) at the discharged current I1 and I2 according to equation 3:
( )
( ) ( )
The decrease of the available discharge capacity at increased discharge current is explained by the voltage drop caused by the internal resistance of the cell, the reduced recovery rate and the reduced amount of active mass contributing to the electrochemical reaction at high current densities [7], [8]. The Peukert equation merely represents an empirical approximation. Internal resistance, the limited velocity of the charge transport processes, the electrochemical processes within the cell and the reduced amount of active mass are not directly considered by Peukert’s equation, but is an empirical approximation of the change of capacity at different discharge rates [7].
The conversion of equation 3 into the following equation enables a linear representation of Peukert’s equation as illustrated in Figure 1:
( )
this can be modified to the linear equation [7]
(
) (
) (
) (
)
The first two terms of equation (7) comply with y0 the intercept with the ordinate axis
(
) (
)
and thus
(
) (
)
The form of equation can be used for interpolation between two values. An extrapolation is not recommended because it can lead to erroneous results.
In recent times some new approaches were made for extending or replacing Peukert’s equation. Hausmann and Depcik included current and temperature effects in a new equation, used for state-of-charge (SOC) prediction models in automotive applications [9].
where is the capacity of a fully charged battery at time zero. With increasing battery temperature T and increasing load I. , the rate at which the capacity is reduced, increases.
(
[image:4.596.117.396.240.445.2]
) ( )
Figure 1. Schematic of the interpolation with two data points. k is Peukert’s constant and the slope of the curve, y0 corresponds to the capacity of the cell.
Thereby the exponent is analogous to Peukert’s constant and β provides the indication of how the battery response to thermal changes on either side of the reference temperature Tref. The coefficient given in ampere hours relates the capacity removed to the non-dimensional reference current ratio and to the temperature components in equation 11.
The first product, the dynamic current It, is modelled by the Peukert constant analogous α and It relates to the reference current Iref. Tt corresponds to the actual dynamic temperature of the cell and refers to Tref [9].
Omar et al. [10] proposed a new relationship regarding the discharge capacity of lithium-ion batteries. According to this equation, the Peukert factor k is not constant and varies with temperature and current, the aging caused by cycling of the cell and the capacity recovery by the differential Equation 12 [10] :
[
]
with discharge capacity in Ah, depth of discharge in %, t° operating temperature in °C, applied current in A and a constant. The relationship has been linearized at each operating
point.
Omar’s relationship contains all parameters which have a bearing on the battery behavior under all conditions. This provides a precise estimation of the discharge capacity of the battery at expense of a very complex equation and large number of parameters [10].
Doerffel et. al. [11] present a review of Peukert’s equation and its variants, as well as its application to lithium-ion cells.
According to [11], Peukert’s equation cannot be applied to determine the SOC accurately for any given load profile, because the Peukert equation cannot be applied for an accurate prediction of the remaining capacity of a battery unless it is discharged at a constant current and constant temperature.
Galushkin’s analytical model for capacity evaluation of remaining charge state of commercial automotive-grade lithium batteries [12] refers to the approach of Hausmann and Depcik [9]. This extension solves the problem of a limitation of a capacity growth in conditions of a temperature increase and the absence of a negative thermal critical point, under which the battery capacity output is zero [12]:
( ( ) )
( (
) )
f(I, T) is the rate at which the capacity is reduced. Tk is the temperature at f(i, T) = 0, the parameter K displays how many times maximum the capacity can be enlarged along with the battery temperature increase. and are empirical constants, I0 is a current at which a capacity released will be twice as small as the maximum capacity of the battery. Iref and Tref are the reference current and temperature, I the actual discharge current and T the actual temperature and both refer to Iref or Tref.
2.1. Electrochemical double-layer and lithium capacitors
Electrochemical double-layer capacitors are also used for high current applications [13]. The charge Q which can be discharged from an ideal capacitor is independent from the discharge current:
In the equations 14 to 16, C is not the capacity, being the capacitance. U the voltage of the capacitor.
Lithium capacitors cannot be discharged to 0 V, but similar to batteries to a minimum operation voltage Umin. There equation (15) is modified to the following equation,
describing the dependence of the discharge capacity Q from the current I.
Peukert’s equation 2 can be also used to describe the capacity of electrochemical double-layer and lithium capacitors more precise than equation 16, as it includes empirical effects reducing the capacity.
3. EXPERIMENT DESCRIPTION 3.1. Experimental setup
A ZENNIUM electrochemical workstation in combination with a power potentiostat PP241 (both from ZAHNER-elektrik GmbH & Co. KG, Kronach, Germany) were used to test the cylindrical lithium-ion cells (Table. 1, No. 1 to 3). This cell tester has 1 channel (-40 A to +40 A and -4 V to 4 V and from -10 V to +10 V). It provides a voltage accuracy of ±0.1 % and a current accuracy of ±0.25 % [16]. A home-made switch-off box is used as a redundant safety device, preventing the cell from overcharge, deep discharge and over temperature. This safety device is designed to have no influence to the voltage measurement. The input current by the mounted analog-to-digital converter (MAX1272 from Maxim Integrated) has a maximum of 430 A.
A MCV4-100-5 CE electric vehicle battery cell tester (from Bitrode Corporation, St. Louis, USA) was used to for the experiments with cells No. 4 to 7. This tester provides eight channels (-100 A to 100 A and 0 to 5 V) and a voltage and current accuracy of ±0.1 % to full-scale [17].
Aluminum profile heat sinks were used to limit the temperature increase of the cells (see Figure 2) caused by the load profile. A PR130/50/SE type heat sink (2) was used for the 18650 type cells and a SK 03/75 SA type heat sink for the 26650 cells. A custom aluminum block out of AlCu4PbMgMn (3) was used to connect the cells within the heat sink. Between this aluminum block and the examinee, a commercial high heat-conducting paste MX-2 from ARTIC was used. 7 * 40 * 0.15 mm nickel strips (4) with a purity of > 99.5 % were laser welded centrally at each electrode of the cylindrical lithium-ion cells (see Figure 2). The temperature sensors were placed centrically. The prismatic and pouch-cells (no. 3, 4 and 5) were positioned between two PR169/100/SE heat sinks to improve the heat dissipation (see Figure 3).
All specimens were placed inside a temperature chamber (model VT 4021, Vötsch Industrietechnik GmbH, Balingen-Frommern, Germany). Temperature inside the chamber was set to 25.0°C ± 0.5 K [18].
Figure 2. Illustration of the test setup: 1 - test cell, 2 - heatsink, 3 - aluminum block to embed the cell, 4 - nickel strips for contacting.
Figure 3. Connected cell holder for an AMP20M1HDA cell during testing.
[image:7.596.226.373.136.279.2]Table 1 and 2 show the lithium-ion cells and capacitors investigated [19 – 25].
Table 1. Specifications of the tested lithium-ion cells.
Model
Manu-facturer
Capacity (Ah)
Cont. discharge Current (A)
Cell chemistry 1)
HTCN-26650
[image:7.596.185.411.334.563.2]
2) APR-18650MA1
A123 1.10 30.0 LiFePO4
3) AMP20-M1HDA
[image:8.596.89.509.170.312.2]A123 20.0 300 LiFePO4
Table 2. Specifications of the tested super capacitors. Model Manufacturer Capacity/
Capacitance
Cont. discharge Current (A)
Cell chemistry 4)
HPNP-3R2200B
Lumos 20.0 Ah 100 LiFePO4 +
EDLC
5) SCHE0320 Skeleton 320 F 50.0 EDLC
6) NESHSR-3000C0
Nesscap 3000 F 200 EDLC
7) FSC10XA AFEC 2000 F 100 Li-ion +
EDLC
3.2. Experimental design
Measurements were based on the procedures described by IEC 61960:2011 [26] and ISO 12405-1:2011 [27].
All charges and discharges are performed using the constant current/constant voltage (CC/CV) procedure until the examinee’s individual defined cut-off voltage is reached.
[image:8.596.202.395.450.729.2]
3.3. Initial cycles
Pre-cycling is necessary to set stable condition for the subsequent testing. The completing of the basic formation like the Solid Electrolyte Interface (SEI) within the cell is required and therefore a basic cycling profile is applied to each cell [28]. Figure 4 shows the flow diagram of the initial pre-cycles.
1) Prior to the test, the examinee needs to be set to constant 25.0 °C± 0.5 K. It is kept at the specified test temperature for at least one hour to fully reach the set temperature inside the examinee [27].
2) Cell is completely discharged (until minimum voltage) with a CC profile. Current rate was set to 1.0 C. Discharge capacity QP is determined by current integration of the CC phase (see Equation 1).
3) Cells is recharged with the CC-CV charging method with 1.0 or 1.5 C. Current rate and upper cut-off voltage are selected according specification of the manufacturer of the cell.
4) Step 1, 2 and 3 are repeated at least ten times. In step 2 the rate of change of the capacity must reach a stable value, less than 5 % deviation to the previous measurement.
5) Termination of the pre-cycle and start of the measurement cycle (Figure 6).
3.4. Measurement cycles
[image:9.596.95.500.478.606.2]The cell is completely charged before the measurement (at the end of the pre-cycling). The dependence of capacity of the discharge current is determined with the following procedure.
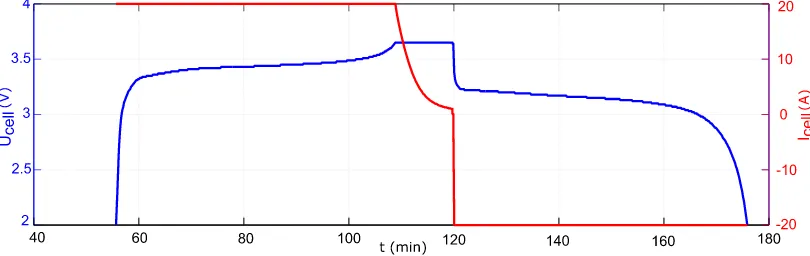
Figure 5. Measurement cycle example based on an AMP20M1HD-A cell from A123.
1) The discharge current is defined in the first step. For each cell, a set of discharge currents is defined, covering the complete current range of the cell (see Table 3 and 4). From this set, the current for each step is randomly selected to avoid systematic deviations, caused, for example, by aging of the cell.
of the Peukert equation.
4) Cells are recharged with the CC-CV charging method. Current rate and upper cut-off voltage are selected according specification of the manufacturer of the cell. The charge capacity Q here is determined by current integration (see Equation. 1) as well.
5) The complete measurement cycle is repeated three times.
6) For each examinee at least 10 different discharge currents are set and performed.
[image:10.596.233.366.231.447.2]7) Investigations are completed for this specimen. In Figure 6 the graphical representation of one entire cycle is pictured.
Figure 6. Measurement cycle based on [23] and [24].*(2)-(3) for examinees [19 – 22].
Table 3. Voltage limits and test currents of the lithium-ion cells. Model Charge cut-off
voltage (V)
Discharge cut-off voltage (V)
Discharge currents (C-rating) HTCN
26650
4.20 2.75 0.4, 0.7, 0.9, 1.1, 1.3, 1.6, 1.8, 2.0, 2.2, 2.4, 2.7, 2.9, 3.1, 3.3
APR18650MA1 3.60 2.00 1.0, 3.6, 6.4, 10.0, 12.7, 15.5, 18.2, 20.9, 23.6, 26.4, 29.1, 31.8
[image:10.596.44.548.632.748.2]
Table 4. Voltage limits and test currents of the tested supercapacitors. Model Charge
cut-off voltage (V)
Discharge cut-off voltage (V)
Discharge currents (A)
HPNP 3R2200B
3.60 2.50 10.0, 20.0, 30.0, 40.0, 50.0, 60.0, 70.0, 80.0, 90.0, 100.0, 105.0, 110.0, 115.0, 120.0, 125.0, 130.0, 135.0,
140.0, 145.0, 150.0, 155.0, 160.0, 165.0, 170.0, 175.0 SCHE
0320
2.85 0.00 5.0, 10.0, 15.0, …, 90.0
NESHSR- 3000C0
2.70 0.00 10.0, 20.0, 30.0, …, 250.0
FSC10XA 3.80 2.20 10.0, 20.0, 30.0, …, 100.0
4. ACCURACY ESTIMATION
According to information by Zahner [16], the PP241 booster has a total current measurement deviation of ± 0.1 %.
The MCV4-100-5 CE electric vehicle battery cell tester (from Bitrode Corporation) has a measurement accuracy of ±0.1 % to full-scale [17]. The relative deviation depends on the size of the chosen current and amounts ± 0.1 %.
The following table summarizes the systematic deviation per measurement device.
Table 5. General accuracy of the test equipment by [16],[17]. Equipment Max. absolute
deviation
Max. relative deviation Zahner
PP241 booster
± 100 mA ± 10 mV
± 0.25 % ± 0.1 % Bitrode
MCV4-100-5 CE
± 400 mA ± 5 mV
± 0.1 % ± 0.1 %
Due to the application of the CC/CV discharging method, the set voltage limit and the deviation within the voltage and current measurement result a time deviation. Based on that, the estimation regarding the accuracy of the results is done by using the error propagation law.
(
[image:11.596.151.443.504.634.2]
Thereby,
depends from the SOC-curve and must be solved numerically from the measured
data. is the absolute voltage error.
Additionally, a time error results of the applied current error. By using the accuracy information (Table 5) and equation 18, which is derived from equation 2, the absolute deviation of this error can be calculated.
( )
The addition of both time resulting errors - voltage and current - are listed in table 6.
[image:12.596.173.422.346.487.2]The stated results are the maximum relative time error . The deviation of the parameters in tables 7 and 8 correspond to the time deviation results of table 6.
Table 6. Calculated maximum time error of the test equipment. Equipment Worst sampling
rate (s)
Absolute deviation
(s) max. Zahner
PP241 booster
1.0 21.3
Bitrode
MCV4-100-5 CE
0.1 2.7
5. RESULTS AND DISCUSSION
[image:12.596.179.407.547.731.2]
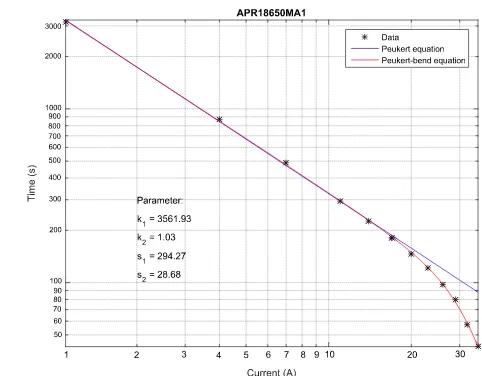
Figure 8. APR18650MA1 lithium-ion cell from A123 – 1.1 Ah.
Figure 9. AMP20M1HDA lithium-ion cell from A123 – 20 Ah.
[image:13.596.165.429.310.505.2] [image:13.596.166.407.546.731.2]
Figure 11. SCHE0320 capacitor cell from Skeleton Technologies – 320 F.
[image:14.596.169.408.76.261.2]Figure 12. NESHSR3000C0 capacitor cell from Nesscap – 3000 F.
[image:14.596.167.406.290.473.2] [image:14.596.167.408.516.702.2]
The figures 7 to 13 show that lithium-ion cells behave according to Peukert’ law at low discharge rates and can be linearized. At high discharge rates a deviation from the classic Peukert behavior is observed.
Due to these deviation, less capacity can be discharged from the cells than predicted by Peukert’s law. A declining capacity effect at high current loads can be observed and is called the Peukert-bend-effect.
The evaluated electrochemical double-layer capacitors and lithium capacitors also confirm the assumption of the observed Peukert-bend.
5.1.Peukert bend equation
To describe the behavior of the cells at high current loads, the new so-called Peukert-bend equation is introduced. This equation is based on formula 6, the transformation of Peukert’s law.
The aim is to expand Peukert’s equation with a feature of describing the capacity declining effect at high current loads. This is achieved by multiplying Peukert’s equation in superposition with a current dependent declining factor, using the same equations as used for determining the cut-off frequency of low-pass filters.
(
) (
) √
( )
The fitted parameter k1 is the first term of equation 19
(
)
When the current I reaches the value of parameter s2,
equation 19 results to the typical mitigation factor
( )
√
and behaves similar to the cut-off frequency of electronic filters with a gain factor of
√ . and
5.2. Analysis
Data of different discharge currents of energy storage systems, lithium-ion cells, electrochemical double-layer and lithium capacitors are evaluated.
In figures 7 to 13 the results of the application of the Peukert-bend equation 19 are shown to describe the cells behavior. Each graph compares the result of the classical Peukert equation (blue lines) with the improved Peukert-bend equation (red lines) of all lithium-ion cells, electrochemical double layer capacitors and lithium capacitors.
Determination of parameter k of the classical Peukert equation was done by fitting equation 7 to the low currents, which are within the manufacturer’s current limits. This parameter k was used to define parameter k2 for the Peukert-bend fitting This was done with the least squares error method of MATLAB R2015b, using logarithmic error weighting. The resulting parameters are shown in table 7 and 8. All axes are scaled in a logarithmic order for a straight-line representation of the fitted results.
[image:16.596.95.499.380.479.2]The tables 7 and 8 summarize the determined parameters k1, k2, s1 and s2 of the examinees presented in figure 7 to 13:
Table 7. Parameters of the tested lithium-ion cells.
Model k1 (s) k2 s1 s2 (A)
HTCN 26650
167 x 102 1.08 288.0 15.0
APR18650MA1 36 x 102 1.04 529.0 29.5
AMP20M1HAD 794 x 102 1.05 168.0 307.0
Table 8. Parameter of the tested electrochemical double-layer capacitors.
Model k1 (s) k2 s1 s2 (A)
HPNP 3R2200B
907 x 102 1.03 218 x 103 152.0 SCHE
0320
11 x 102 1.04 3.9 46.0
NESHSR 3000C0
13 x 102 1.04 1.0 3.20
FSC10XA 19 x 102 1.23 796.0 86.0
By extending Peukert’s equation to the Peukert bend equation a good description of the behavior of lithium-ion cells, electrochemical double-layer capacitors and lithium-ion capacitors from low to very high discharge rates is obtained.
[image:16.596.116.484.533.666.2]
The introduction of the additional parameters s1 and s2 offer advantages. s2 is a dimensionless value which corresponds to the characteristic current on which the fitting of the developed equation deviates more than the gain factor
√ , thus about 30 % of the classic Peukert equation. s1 characterizes
the intensity of the capacity decrease like the order of a low pass filter describes the strength of damping above the cut-off frequency.
6. CONCLUSION
If lithium-ion cells are discharged with low to medium discharge rates, a decrease of the discharge capacity with increasing discharge rates was observed. This dependence can be described by the Peukert equation. Electrochemical double-layer capacitors, and lithium capacitors, also show similar behavior at low to medium discharge rates, which can also be described by the Peukert equation.
At very high discharge rates, an additional decrease of the cells capacity is observed while discharging lithium-ion, electrochemical double-layer capacitors and lithium capacitors alike. This results in a bend in the classical Peukert plot. A new equation is proposed describing this behavior by expanding the Peukert equation, while still keeping the old Peukert parameter within this equation. The introduction of the additional parameters s1 and s2 provide the possibility to describe the behavior of the cell at high current rates while maintaining the classic Peukert constant k2.
The new Peukert bend equation provides a good description of the decline of the capacity of lithium-ion, electrochemical double-layer capacitors and lithium capacitors from low to very high discharge rates.
ACKNOWLEDGEMENTS
The authors would like to thank Sönke Barra and Alexander Nitsche for all technical support for this work, James McDonald and Roland Meier for editing and the faculty of Electrical Engineering and Computer Science of the Technische Hochschule Ingolstadt (THI) for financing the tested specimens. Not least thanks to the support and help during the stay in Brazil to Professor Impennisi of the LACTEC and to the project AWARE of the THI for financing this stay.
References
1. M. Ringdorfer and M. Horn, CCA; IEEE Int. Conf. on Cont. App.; IEEE Multi-Conference on Systems and Control; MSC, (2011).
2. S. F. Schuster, M. J. Brand, P. Berg, M. Gleissenberger and A. Jossen, Journal of Power Sources, 297 (2015) 242-251.
3. S. Wilkins, B. Rosca, J. Jacob and E. Hoedmaekers, Tenth International Conference on Ecological Vehicles and Renewable Energies (EVER), (2015) 1-8.
4. M. Kulkarni, A. Vaidya and P. Karwa, IEEE Int. Transp. Electr. Conf. (ITEC), (2015) 1-3. 5. W. Peukert, Elektrotechnische Zeitschrift, 20 (1897) 287-288.
6. D. Small, [Online]. Available: http://www.smartgauge.co.uk/peukert_depth.html, (Apr/15).
9. A. Hausmann and C. Depcik, Journal of Power Sources, 235 (2013) 148-158.
10.N. Omar, P. Van den Bossche, T. Coosemans and J. Van Mierlo, Energies, 6 (2013) 5625-5641. 11.D. Doerffel and A. Sharkh Suleiman, Journal of Power Sources, 155 (2005) 395-400.
12.N. E. Galushkin, N. N. Yazvinskaya and D. N. Galushkin. Journal of the Electrochemical Society, 162 (2015) 308-314.
13.Y. Parvini, J. B. Siegel, A. G. Stefanopoulou and A. Vahidi. IEEE Transactions on Industrial Electronics, 63 (2016) 1574-1585.
14.B.E. Conway, New York, Plenum Press, (1999).
15.T. B. Reddy and D. Linden, 4th edition, McGraw-Hill, (2011).
16.Zahner-Elektrik and Zahner-Schiller GmbH & Co. KG – Zahner Messysteme, [Online]. Available: http://www.zahner.de/, (May/15).
17.Bitrode Corporation, [Online]. Available: http://www.bitrode.com/model-mcv/, (May/15).
18.Vötsch Industrietechnik GmbH, [Online]. Available: http://www.v-it.com/de/home/schunk01.c.59546.de, (May/15).
19.Lumos Lithium-ion Battery Series, Doc: PS-LI015, Model: HTCN26650-4500mAh-3.6V.
20.A123 Systems, APR18650 Lithium Ion Cylindrical Cell, Nanophosphate APR18650M1-A, http://www.a123systems.com/lifepo4-battery-cell.htm, (Nov/2015).
21.A123 Systems, Doc: 493005-002, Battery Pack Design, Validation, and Assembly Guide using A123 Systems AMP20M1HD-A Nanophosphate Cells.
22.Lumos Cell Technical Data Sheet of Supercapacitor Li-ion Battery, Model HP-NP-3R2-200B. 23.Skeleton Technologies, Skelcap High Energy Ultracapacitor, Doc. 01-14002-2, SCHE0320. 24.Nesscap Ultracapacitors, Datasheet – 2.7V / 3000F Cell, Weldable, ESHSR-3000C0-002R7A5. 25.AFEC Asahi Kasei FDK Energy Device Co., Ltd., Datasheet ECT-LP2015-FE02.
26.BS ISO 12405-1:2011. 27.IEC 61960:2011.
28.Y. Lee, J. Lee, H-T Shim, J. Lee and J. Park, Journal of the Electrochemical Society, 154 (2007) A515-A519.


![Figure 6. Measurement cycle based on [23] and [24].*(2)-(3) for examinees [19 – 22].](https://thumb-us.123doks.com/thumbv2/123dok_us/1812799.136623/10.596.44.548.632.748/figure-measurement-cycle-based-examinees.webp)
![Table 5. General accuracy of the test equipment by [16],[17].](https://thumb-us.123doks.com/thumbv2/123dok_us/1812799.136623/11.596.46.545.97.267/table-general-accuracy-test-equipment.webp)