Int. J. Electrochem. Sci., 14 (2019) 5924 – 5937, doi: 10.20964/2019.07.03
International Journal of
ELECTROCHEMICAL
SCIENCE
www.electrochemsci.orgComparison Study of Partial Least Squares Regression Analysis
and Principal Component Analysis in Fast-Scan Cyclic
Voltammetry
Jaekyung Kim1, Yoonbae Oh2, Cheonho Park1, Yu Min Kang1, Hojin Shin1, In Young Kim1, and Dong Pyo Jang1,*
1 Department of Biomedical Engineering, Hanyang University, Seoul, South Korea 2 Department of Neurologic Surgery, Mayo Clinic, Rochester, MN, USA
*E-mail: [email protected]
Received: 24 February 2018 / Accepted: 25 March 2019 / Published: 10 June 2019
Both principal component regression (PCR) and partial least squares regression (PLSR) have been commonly used to predict neurochemical concentrations from measurements of fast-scan cyclic voltammetry (FSCV). However, a comparison of the accuracy of the above methods for FSCV analysis is yet to be demonstrated. In this work, we compare the concentration estimation performance of PCR and PLSR in an analysis of FSCV data. Using conventional FSCV, we recorded in vitro background-subtracted cyclic voltammograms from five neurochemicals i.e., dopamine, ascorbic acid, 3,4-dihydroxyphenylacetic acid, and serotonin, and pH change, with five concentrations of each substance and five pH values. The results showed that the absolute error (AE) and mean absolute percentage error (MAPE) were significantly smaller on average when the concentration of a single substance was predicted using PLSR compared with the use of PCR. As a further evaluation of PCR and PLSR, we compared the predictions of the concentrations of mixtures using PCR and PLSR. The AE and MAPE in the predictions obtained using PLSR were significantly smaller than those obtained using PCR. Across the single substance and the four types of mixtures, compared with PCR, PLSR showed not only higher accuracy in the prediction of concentrations but also higher selectivity. Therefore, PLSR should be preferred over PCR as a more reliable tool to analyze FSCV data.
Keywords: Fast-scan cyclic voltammetry (FSCV); Principal component analysis (PCR); Partial least squares regression (PLSR); Neurochemical
1. INTRODUCTION
physiological environment requires identifying neurochemicals and their concentrations are based on electrochemical features such as the peak potential position, shape, and peak amplitude. In general, a statistical method called principal component regression (PCR) has been used in the field of FSCV; it consists of feature extraction data analysis (principal component analysis (PCA)) and multiple linear regression to PCA [3-7]. PCR allows an analytical chemist to resolve complex mixtures of neurochemicals and analyze their features such as the absolute concentrations or phasic and tonic fluctuations.
Over the past decade, partial least squares regression (PLSR) has received significant attention in the field of chemometrics since its development by Herman Wold and coworkers [8-10]. PLSR has been applied to many scientific areas including bioinformatics, food research, medicine, pharmacology, and physiology [11-17]. It has also been applied to FSCV analysis once, to the best of our knowledge [18]. PCA has been used to maximize covariance in voltammograms, whereas PLSR is used to consider both voltammograms and the corresponding concentrations [19, 20]. PLSR is particularly useful to predict a testing dataset of dependent variables from training with a large dataset of independent variables (i.e., predictors). Thus, the application of PLSR to an analysis of cyclic voltammograms is underlined by the fact that the prediction of unknown cyclic voltammograms is based on the causal relationship between the known concentration and the reference cyclic voltammograms. However, the advantages of PLSR over PCR are still unclear [21].
Here, we demonstrate the better performance achieved by applying PLSR to FSCV analysis in the estimation of features of chemical fluctuations compared with that of PCR. We used conventional FSCV recordings to estimate five neurochemicals (dopamine (DA), ascorbic acid (AA), 3,4-dihydroxyphenylacetic acid (DOPAC), and serotonin (5-HT)) and pH change (∆pH). First, the concentrations of unknown voltammograms (testing dataset) recorded from inducing a single neurochemical were estimated, from an identical calibration set (training dataset), but by using the distinct analytical methods PCR and PLSR independently. Second, the performances of PCR and PLSR for the predictions of a single analyte were evaluated through cross-validation. Third, through prediction of the mixtures of the two analytes mimicking a more physiological environment (e.g., a mixture of DA 0.5 µM and AA 100 µM), we compared the performances of PLSR and PCR. From these results, we observed that PLSR showed remarkably improved performance for the classification of neurochemicals (accuracy) and the estimation of concentrations (sensitivity).
2. METHODS AND MATERIALS
2.1. Data acquisition
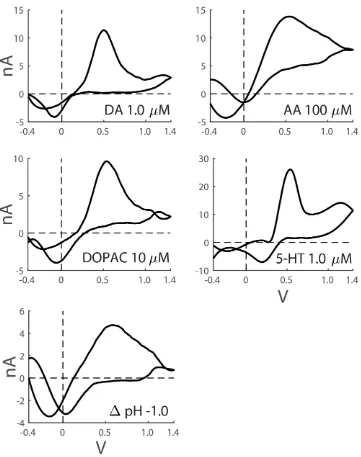
(DOPAC), and ascorbic acid (AA) were introduced to collect the cyclic voltammograms. Each neurochemical was recorded at four different concentrations, (0.5–2.0 µM for DA and 5-HT, 5–20 µM for DOPAC, and 50–200 µM for AA) and also in the Tris buffer alone (none in Fig. 1A). In addition to these neurochemicals, cyclic voltammograms were also recorded at five different pH values (between pH 7.2 and 7.6). After collection, background subtraction, signal averaging, and digital filtering were performed under software control. All the experiments were performed inside a Faraday cage to eliminate as much electromagnetic noise as possible. The background-subtracted cyclic voltammograms for the five neurotransmitters are shown in Figure 1.
2.2. Electrodes
Carbon fiber microelectrodes (CFM) were constructed, as previously described [22], by inserting a single carbon fiber (d = 7 μm) (Cytech Thomel T300) into a silica tube with an outer diameter of 89 μm (Polymicro Technologies, Phoenix, AZ) and holding it in place with amic acid cement. One end was attached to a nitinol wire (Small Parts, Logansport, IN) with silver epoxy paste and inserted into polyimide tubing (Chemtron Inc., Lorton, VA) for insulation. The other end with exposed carbon fiber was trimmed to a final length of ~ 100 µm using a scalpel blade.
2.3. Flow injection apparatus
A CFM was positioned at the center of the flow cell so that a flowing stream of buffer and analyte could be injected as a bolus. The buffer solution was pumped across the CFM at a rate of 2 mL/min. The buffer was injected using a flow-injection system consisting of a syringe pump (Harvard Apparatus, Holliston, MA) through a Teflon tube to a 6-port injection valve (Rheodyne, Rohnert Park, CA) at a rate of 2 mL/ min. The analyte was introduced from an injection loop to the flow cell using an injection valve controlled using a 12 V dc solenoid. The flow cell was flushed with a buffer solution for at least 30 s prior to each injection of analyte.
2.4. Chemicals
All the chemicals were purchased from Sigma-Aldrich (St Louis, MO). The Tris buffer solution was composed of 150 mM NaCl and 12 mM Tris (Trizma base) at pH 7.4. DA, AA, DOPAC, and 5-HT at the desired concentrations as well as solutions for the five different pH values were prepared in the Tris buffer on the day of use.
2.5. Data analysis
neurochemicals. A regression matrix was constructed using a training dataset composed of cyclic voltammograms (850 data points of a sample in a single column, and 650 and 1500 samples for the estimation of a single substance and mixture, respectively, unless noted).
Figure 1. Background-subtracted cyclic voltammograms of four neurochemicals and pH change. Results for DA (1.0 µM), AA (100 µM), DOPAC (10 µM), 5-HT (1.0 µM), and ∆pH (–1.0) are shown.
[image:4.596.119.480.136.593.2]
, (1)
where σ2 is the variance of the random matrix (cyclic voltammograms in the Tris buffer) and q is the number of data points divided by the number of samples. Therefore, eigenvalues greater than λmax are a
sign of nonrandom correlations in the matrix, and hence, we refer to these primary components as a signal. We used the same number of components in a comparison between PCR and PLSR. Data pretreatments such as mean centering and normalization were not used so that the cyclic voltammogram retained its current amplitude. To limit problems such as overfitting in a regression model [26], a 10-fold cross-validation was performed for the estimation of the single substance (Fig. 4). We repeated the same procedure for the three different sets of data collected from the three electrodes. The Pearson correlation between the projections on each PCR component and the concentration of each neurochemical was calculated (Fig. 2B and Fig. 3B). From these correlation coefficients, the mean of absolute correlation coefficients was calculated for the specified components and all neurochemicals (Fig. 4A). To remove the disproportionate effect of a large error in the predictions of concentrations, we calculated the mean absolute percentage error (MAPE), which is the sum of the absolute error (|predicted – actual value|) divided by the number of predictions and multiplied by 100 (Fig. 4C and Fig. 5B).
3. RESULTS AND DISCUSSION
3.1. Estimation of concentrations using PCR
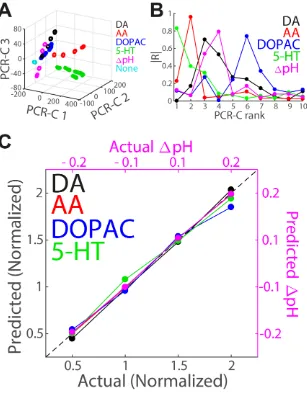
We performed PCA to reduce the dimensionality of a training dataset of cyclic voltammograms of four neurochemicals and pH change from a single CFM. The first three PCR components (PCR-C; typically called principal components) accounted for 97.2% of the variance in the training dataset. For each neurochemical, the distribution on the first three PCR components shows a relatively monotonic relationship as a function of concentrations (Fig. 2A). Every neurochemical was classified roughly well with the first three PCR components, but the classification of DOPAC and ∆pH from DA was relatively poor. Therefore, we must understand the relationship between lower-ranked PCR components and the concentrations of each neurochemical, in addition to which PCR component was highly correlated with which neurochemical. Here, the absolute correlation coefficient (|R|) between the projections on each PCR component and the concentration of the neurochemical was calculated. It had a relatively unimodal shape of the PCR component rank, with a rank that maximizes |R|; the projections to the PCR components of the peak |R| are highly correlated with the corresponding neurochemical concentration (Fig. 2B). Indeed, |R| for DA, AA, and 5-HT was at the maximum within the first three PCR components, but the maximum of |R| for DOPAC and ∆pH was out of that range. This explains why DOPAC and ∆pH were poorly classified in Figure 2A.
the actual concentrations introduced. For comparison, the concentrations of DA, AA, DOPAC, and 5-HT were normalized to the standard concentration (0.1, 100, 10, and 0.1 µM, respectively). The pH was represented by a change from a pH of 7.4 (∆pH). If PCR estimated the actual concentration or ∆pH accurately, all predictions should lie on the identity line. The prediction obtained using PCR deviated from the actual values by a root mean squared error (RMSE) of 0.07, 1.05, 0.9, and 0.07 µM for DA, AA, DOPAC, and 5-HT, respectively, and a pH 0.03 for ∆pH. Across the four neurochemicals and pH change, PCA showed a good performance for classifying the feature of cyclic voltammograms of the single substance, and PCR estimated well the actual concentrations of the single substance.
[image:6.596.145.452.225.620.2]
3.2. Estimation of concentrations using PLSR
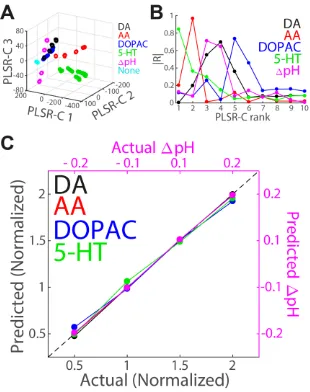
[image:7.596.143.453.182.574.2]We also performed partial least squares (PLS) as in the case of PCA. The same training and testing datasets were used for independent analysis of PCR and PLSR. The first three PLSR components (typically called latent vectors or score vectors) accounted for 97.1% of the variance in the training dataset.
Figure 3. PLSR prediction for the concentrations of the four neurochemicals and pH change (same as Fig. 2). (A) Distribution on the first three primary PLSR components (PLSR-C). PLSR-C 1 and 2 have inverse polarity so that this figure appears similar to Figure 1A. (B) Absolute correlation coefficient (|R|) between the projections on each PLSR component (shown only for the first three PLSR components in “A”) and the actual value of concentration or ∆pH of each neurochemical. (C) Prediction using PLSR (circle) and an actual value (dashed identity line). The normalized concentrations of the four neurochemicals (DA, AA, DOPAC, and 5-HT) are represented by the black axis, and ∆pH is represented by the magenta axis.
scores in the PCR and PLSR component space, |R| between the projections on each PLSR component and the concentration of a neurochemical has a relatively unimodal shape of the PLSR component rank. The maximum |R| is observed for AA, ∆pH, and 5-HT within the first three PLSR components (Fig. 3B, compared with Fig. 2B).
Subsequently, PLSR was performed using the same number of PLSR components as PCR (accounting for 99.9% of the variance in the data). The statistical analysis produced one more significant component for PLSR than for PCR. However, we used the same number of components so that the effect of the number of primary components is removed (see Methods). Although we did not use a significant component in PLSR, the predictions of the concentrations of the neurochemicals (testing dataset) obtained using PLSR lie near the identity line (the actual concentration) better than the predictions obtained using PCR (Fig. 3C, compared with Fig. 2C). The prediction obtained using PLSR deviated from the actual values by the RMSEs of 0.04, 1, 0.7, and 0.05 µM for DA, AA, DOPAC, and 5-HT, respectively, and a ∆pH of pH 0.02. These RMSE values obtained using PLSR were smaller than those obtained using PCR (by 42, 5, 22 28, and 33% for DA, AA, DOPAC, 5-HT, and ∆pH, respectively). It shows that PLSR has a higher degree of precision than PCR. Overall, PLSR showed better performance for the estimation of concentrations of single substances from cyclic voltammograms.
Theoretically, PLSR is particularly more useful than PCR to predict unknown concentrations (Y; dependent variables) from known template of cyclic voltammograms (X; independent variables), in that it attempts to find a set of primary components and creates a regression matrix, as a dependent process between the independent (X) and the dependent variables (Y), by maximizing the covariance between dependent and independent variables [19, 20]. However, PCR finds a set of primary components that maximizes the variance of independent variables; subsequently, as an independent process, it creates a regression matrix that links a set of primary components to dependent variables. Our estimation using PLSR, rather than the use of PCR, showed the results predicted by the theoretical basis.
3.3. Comparison between PCR and PLSR
The performance of PCR for the estimation of the concentration was compared with that of PLSR in Figure 4. We collected cyclic voltammograms using the same set of concentration combinations for each CFM. Subsequently, we performed 10-fold cross-validation for PCR and PLSR independently but by using the same dataset (see Methods and materials). In the cross-validation in the single electrode, the same number of components was used in both PCR and PLSR (accounting for 99.9% of the variance in the data). We validated the predictions obtained using PCR and PLSR with three different electrodes (circle, square, and triangle in Fig. 4B and C).
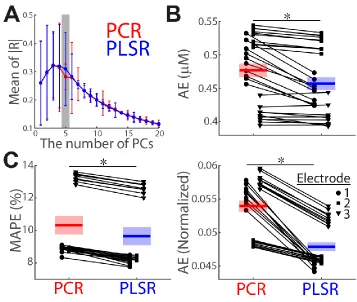
both PCR and PLSR. Interestingly, a remarkable discrepancy occurred with the 1st–5th components (gray rectangular box in Fig. 4A). This difference indicates that the performance of PLSR for the prediction of the concentration and pH was better than that of PCR as the projections on the primary components, at least with the first five components, have a higher correlation to the concentrations on average.
Figure 4. Comparison of the estimations between PCR (red) and PLSR (blue) using 10-fold cross-validation. (A) Mean of the absolute correlation coefficients (|R|) across the different numbers of primary components (PC). Error bars represent SEM. The largest discrepancy occurred at the mean of |R| for the first five PCR and PLSR components (gray transparent rectangular box). (B) Smaller absolute error (AE; before (top) and after (bottom) normalization) in PLSR (right, blue) than in PCR (left, red). (C) Smaller MAPE in PLSR than in PCR. The circle, square, and triangle indicate electrodes 1, 2, and 3, respectively. Mean ± SEM (n = 30; n = 10 per electrode) is indicated by the thick horizontal bar and transparent rectangular box. The single point represents the average from a set of all concentrations or ∆pH across all the neurochemicals.
As another step toward a more quantitative comparison, we compared the AE between PCR and PLSR (Fig. 4B). The AE was significantly lower in the predictions obtained using PLSR than those obtained using PCR, not only before normalization (Fig. 4B top, 0.48 ± 0.01 and 0.45 ± 0.01 µM for PCR and PLSR, respectively, mean ± SEM, n = 30, paired t-test of PCR and PLSR AE: t29 = 5.25,
[image:9.596.118.475.174.476.2]
differed greatly across different electrodes and the AE with electrode 3 was larger than that with the others, Supplementary Figure 1), we compared the MAPE (see Methods and materials) between PCR and PLSR. The MAPE was significantly lower in the predictions obtained using PLSR than those obtained using PCR (Fig. 4C, 10.33 ± 0.55 and 9.65 ± 0.53% for PCR and PLSR, respectively, mean ± SEM, n = 30, paired t-test of PCR and PLSR MAPE: t29 = 23.08, P < 10-19). Thus, the prediction
obtained using PLSR is more effective than that obtained using PCR for the estimation of concentrations of single neurochemicals. As explained in the previous part, this difference must be due to the property that PLSR bears some relation to PCR, but it attempts to perform both PCR and multilinear regression by maximizing the covariance between the training dataset (X; independent variables) and the testing dataset (Y; dependent variables).
Although we achieved better performance using PLSR than by using PCR for the estimation of neurochemical concentrations and previous studies proposed PLSR as a good estimator of chemometrics [8-10], PCR has been routinely used in the field of FSCV [3-7, 27, 28]. Our comparison study between PCR and PLSR raises an interesting possibility of applying PLSR to FSCV [18] and improving the performance of an estimation of neurochemical metrics in the field of FSCV.
3.4. Evaluation of PCR and PLSR with mixtures
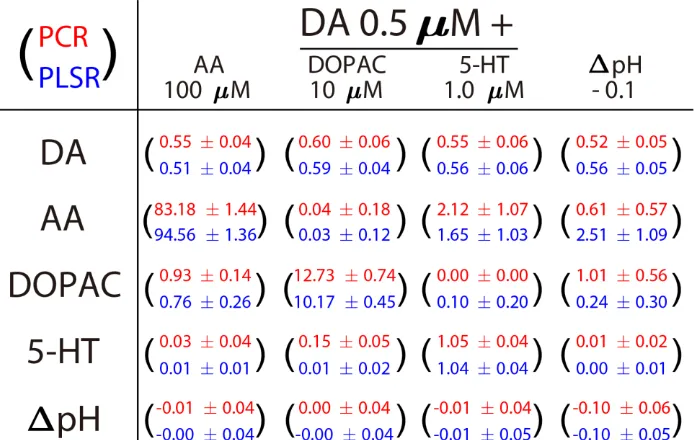
To test the performance of PCR and PLSR further, the testing dataset of cyclic voltammograms from solutions that contained DA of 0.5 µM and one other substance (100, 10, and 1.0 µM for AA, DOPAC, and 5-HT, respectively, and ∆pH of –0.1) was evaluated (Table 1 and Fig. 5). The PCR and PLSR with mixtures were performed using the same number of components (accounting for 99.9% of the variance in the data, see Methods). The regression matrix was constructed from the training dataset, composed of recordings for the predictions of a single neurochemical (training dataset used in Fig. 1–4) and new recordings of mixtures (DA of 1.0 µM and one other substance (100, 10, and 1.0 µM for AA, DOPAC, and 5-HT, respectively, and ∆pH of –0.1)). The predictions obtained using PCR and PLSR shown in Table 1 are summarized, and PCR and PLSR are compared in Figure 5 in the same way as in Figure 4B and C. For the cyclic voltammograms of the mixtures, the predictions obtained using PLSR show better classification of neurochemicals and performances than those obtained using PCR, not only in terms of AE (Fig. 5A top, 0.11 ± 0.01 and 0.09 ± 0.01 µM for PCR and PLSR, respectively, mean ± SEM, n = 30, paired t-test of PCR and PLSR AE: t29 = 8.35, P < 10-8)
but also in terms of MAPE (Fig. 5B, 22.80 ± 1.29 and 20.44 ± 1.14% for PCR and PLSR, respectively, mean ± SEM, n = 30, paired t-test of PCR and PLSR MAPE: t29 = 10.59, P < 10-10).
[image:11.596.126.473.211.431.2]
that in the previous studies [4, 27]. Here, this was demonstrated by estimating the mixtures tested in Table 1 using the test framework used in the previous studies (training dataset composed of only cyclic voltammograms of a single analyte) [4, 27]. The overall values of AE and MAPE were greater in the test framework of the previous studies [4, 27] (Supplementary Figure 2) compared with the results of our main test framework (Fig. 5). Remarkably, we observed smaller AE and MAPE in the predictions obtained using PLSR compared with those obtained using PCR for both test frameworks. Thus, PLSR shows higher performance than PCR in the estimation of concentrations of the mixtures.
Table 1. Concentrations predicted from the cyclic voltammograms of the mixtures. Each mixture contained 0.5 µM of DA and a neurochemical indicated by the column headings. The values in each of the parenthesis are concentrations or ∆pH determined using PCR (red) and PLSR (blue). The mean ± SD (n = 150; n = 50 per electrode) is shown.
Figure 5. Comparison of the mixture estimations using PCR (red) and PLSR (blue) shown in Table 1. Smaller AE after normalization (A, same as Fig. 4B bottom, paired t-test: t29 = 8.35, P < 10-8)
and MAPE (B, same as Fig. 4C, paired t-test: t29 = 10.59, P < 10-10) are observed in PLSR than
[image:11.596.119.476.517.672.2]
4. CONCLUSIONS
In this study, PLSR shows improved performance in an analysis of FSCV data compared with PCR as it comprises regression and classification tasks and dimension reduction techniques. For application of PLSR to electrochemical data, techniques that are much more complicated or a greater effort are not required compared with application of PCR. Using PLSR in the field of FSCV would yield higher accuracy and improved selectivity in the estimation of neurochemicals in both in vitro and in vivo data analysis.
SUPPLEMENTARY FIGURES:
Supplementary Figure 1. Absolute error (AE) after normalization for each condition (same as Fig. 4B bottom). For example, “DA|DA” indicates the estimations of the DA concentrations given that the DA solution is injected into the flow cell and “DA|Oth” indicates the estimations of the DA concentrations given other neurochemical solutions (AA, DOPAC, 5-HT, and ∆pH). Mean ± SEM (n = 30; n = 10 per electrode) is indicated by the thick horizontal bar and transparent rectangular box.
Supplementary Figure 2. Comparison of the mixture estimations using PCR (red) and PLSR (blue) with the training set as the test framework, performed by the previous studies [4, 27]. The training dataset is not composed of mixtures and is only composed of single analytes (compared with Fig. 5). Smaller AE after normalization (A, paired t-test: t29 = 3.58, P < 10-1) and MAPE (B, paired t-test: t29 =
horizontal bar and transparent rectangular box. The single point represents the average from a set of all the different mixtures.
ACKNOWLEDGMENT
This study was supported by an NIH 1U01NS090455-01 award and the National Research Foundation of Korea (NRF-2017R1A2B2006896).
References
1. D. L. Robinson, A. Hermans, A. T. Seipel and R. M. Wightman, Chem. Rev., 108 (2008) 2554. 2. R. M. Wightman and D. L. Robinson, J. Neurochem., 82 (2002) 721.
3. E. S. Bucher, K. Brooks, M. D. Verber, R. B. Keithley, C. Owesson-White, S. Carroll, P. Takmakov, C. J. McKinney and R. M. Wightman, Anal. Chem., 85 (2013) 10344.
4. M. L. Heien, M. A. Johnson and R. M. Wightman, Anal. Chem., 76 (2004) 5697.
5. D. F. Hill, K. L. Parent, C. W. Atcherley, S. L. Cowen and M. L. Heien, Brain Stimul., 11 (2018) 426.
6. J. A. Johnson, C. N. Hobbs and R. M. Wightman, Anal. Chem., 89 (2017) 6166.
7. J. A. Johnson, N. T. Rodeberg and R. M. Wightman, ACS Chem. Neurosci., 7 (2016) 349. 8. K. G. Jöreskog and H. O. A. Wold, Systems under indirect observation: Causality, structure,
prediction, North-Holland, (1982) Amsterdam, Netherlands
9. S. Kotz, N. L. Johnson and C. B. Read, Encyclopedia of statistical sciences, multivariate analysis to plackett and burman designs, Wiley, (1985) New York City, United States.
10.S. Wold, A. Ruhe, H. Wold and W. J. Dunn, SIAM Journal on Scientific and Statistical Computing, 5 (1984) 735.
11.F. Allegrini and A. C. Olivieri, Anal. Chem., 86 (2014) 7858.
12.Y. Z. Feng, G. Elmasry, D. W. Sun, A. G. Scannell, D. Walsh and N. Morcy, Food Chem., 138 (2013) 1829.
13.N. J. Lobaugh, R. West and A. R. McIntosh, Psychophysiology, 38 (2001) 517. 14.D. V. Nguyen and D. M. Rocke, Bioinformatics, 18 (2002) 39.
15.K. Nitta, W. A. Lavina, S. Pontrelli, J. C. Liao, S. P. Putri and E. Fukusaki, J. Biosci. Bioeng., 124 (2017) 498.
16.J. R. Piggott, Statistical procedures in food research, Elsevier Applied Science, (1986) London, United Kingdom.
17.K. J. Worsley, Hum. Brain Mapp., 5 (1997) 254.
18.C. J. Meunier, E. C. Mitchell, J. G. Roberts, J. V. Toups, G. S. McCarty and L. A. Sombers, Anal. Chem., 90 (2018) 1767.
19.H. Abdi, Wiley interdisciplinary reviews: computational statistics, 2 (2010) 97.
20.R. Rosipal and N. Krämer, Overview and recent advances in partial least squares, SLSFS 2005: Subspace, Latent Structure and Feature Selection, Berlin, Heidelberg, Germany, 2006, 34-51. 21.J. A. Johnson and R. M. Wightmanabout, Electrochem. Soc. Interface, 26 (2017) 53.
22.Y. Oh, C. Park, D. H. Kim, H. Shin, Y. M. Kang, M. DeWaele, J. Lee, H. K. Min, C. D. Blaha, K. E. Bennet, I. Y. Kim, K. H. Lee and D. P. Jang, Anal. Chem., 88 (2016) 10962.
23.T. Gulati, D. S. Ramanathan, C. C. Wong and K. Ganguly, Nat. Neurosci., 17 (2014) 1107. 24.V. A. Marchenko and L. A. Pastur, Matematicheskii Sbornik, 114 (1967) 507.
25.A. Peyrache, M. Khamassi, K. Benchenane, S. I. Wiener and F. P. Battaglia, Nat. Neurosci., 12 (2009) 919.
26.R. R. Picard and R. D. Cook, J. Amer. Statistical Assoc., 79 (1984) 575.
E. Bennet, M. L. Heien, K. H. Lee, I. Y. Kim and D. P. Jang, Anal. Chem., 90 (2018) 13348. 28.Y. Oh, M. L. Heien, C. Park, Y. M. Kang, J. Kim, S. L. Boschen, H. Shin, H. U. Cho, C. D. Blaha,
K. E. Bennet, H. K. Lee, S. J. Jung, I. Y. Kim, K. H. Lee and D. P. Jang, Biosens. Bioelectron., 121 (2018) 174.