Fully phase-stabilized quantum cascade laser
frequency comb
Luigi Consolino
1, Malik Nafa
1, Francesco Cappelli
1, Katia Garrasi
2, Francesco P. Mezzapesa
2, Lianhe Li
3,
A. Giles Davies
3, Edmund H. Lin
fi
eld
3, Miriam S. Vitiello
2, Paolo De Natale
1& Saverio Bartalini
1,4Miniaturized frequency comb sources across hard-to-access spectral regions, i.e. mid- and far-infrared, have long been sought. Four-wave-mixing based Quantum Cascade Laser combs (QCL-combs) are ideal candidates, in this respect, due to the unique possibility to tailor their spectral emission by proper nanoscale design of the quantum wells. We demonstrate full-phase-stabilization of a QCL-comb against the primary frequency standard, proving inde-pendent and simultaneous control of the two comb degrees of freedom (modes spacing and frequency offset) at a metrological level. Each emitted mode exhibits a sub-Hz relative frequency stability, while a correlation analysis on the modal phases confirms the high degree of coherence in the device emission, over different power-cycles and over different days. The achievement of fully controlled, phase-stabilized QCL-comb emitters proves that this tech-nology is mature for metrological-grade uses, as well as for an increasing number of scientific and technological applications.
https://doi.org/10.1038/s41467-019-10913-7 OPEN
1CNR-Istituto Nazionale di Ottica and LENS, Via N. Carrara 1, 50019 Sesto Fiorentino, FI, Italy.2NEST, CNR—Istituto Nanoscienze and Scuola Normale
Superiore, Piazza S. Silvestro 12, 56127 Pisa, Italy.3School of Electronic and Electrical Engineering, University of Leeds, Leeds LS2 9JT, UK.4ppqSense Srl, Via
Gattinella 20, 50013 Campi Bisenzio, FI, Italy. Correspondence and requests for materials should be addressed to L.C. (email:[email protected])
123456789
O
ptical frequency comb synthesizers (FCs)1 are lasersources covering a broad spectral range with a number of discrete, equally spaced and highly coherent frequency components, fully controlled through only two parameters: the frequency separation between adjacent modes and the carrier offset frequency. Providing a phase-coherent link between the optical and the microwave/radio-frequency regions2, FCs have
become groundbreaking tools for precision measurements3,4. Despite these inherent advantages, developing miniaturized comb sources across the whole infrared (IR), with an independent and simultaneous control of the two comb degrees of freedom at a metrological level, has not been possible, so far. Recently, pro-mising results have been obtained with innovative sources, namely diode-laser-pumped microresonators5,6 and quantum cascade lasers frequency combs (QCL-combs). In particular, the latter can benefit from a smaller footprint electrical pumping scheme, combined with an ad-hoc tailoring of the spectral emission in the 3–250 µm range, by quantum engineering7. However, due to the QCL-combs active region structure, the short gain recovery time of the laser prevents stable pulse train formation8,9and, therefore, classical pulsed passive mode locking has not been achieved, yet. Pulsed emission has been demon-strated via active mode-locking10,11, with pulse duration, in the
best cases, of few picoseconds. An alternative route to QCL-based FCs, able to achieve a much broader spectral coverage, is based on four-wave-mixing (FWM) parametric generation in QCLs12,13.
These combs, whose emission profile is not pulsed, are based on multimode-emitting, broad-gain Fabry–Pérot QCL devices with low group velocity dispersion.
Thorough characterizations of FWM-based QCL-combs, recently performed both in the mid-IR14,15and in the far-IR15,16, have demonstrated that FWM is a strong mode-locking mechanism, providing tight phase relation among the modes simultaneously emitted by the devices. However, while QCL-based FCs have been already used in a variety of sensing setups, mostly related to dual-comb spectroscopy17,18, their relevance as
metrological-grade, phase-stabilized sources has not been proven, yet. In fact, simultaneous stabilization of the two key comb degrees of freedom requires two suitable and independent actuators. Although reliable procedures for stabilizing the QCL-comb modes spacing12,19 or the frequency of a single mode20
have been reported, independent control and tuning of carrier offset and spacing, together with an effective overall phase sta-bilization has represented, for a long time, a non-trivial breakthrough.
Here, we demonstrate full stabilization and control of the two key parameters of a FWM-based QCL-comb against the primary frequency standard. Our technique, here applied to a far-IR emitter and open ended to other spectral windows, enables Hz-level narrowing of the individual comb modes, and metrological-grade tuning of their individual frequencies, which are simulta-neously measured with an accuracy of 2 × 10⁻¹², limited by the frequency reference used. These fully-controlled, frequency-scalable comb emitters will allow an increasing number of mid-and far-IR applications, including quantum technologies, due to the quantum nature of the gain media21.
Results
Experimental setup. A detailed description of the QCL used in the present work can be found in Methods section. The bias-dependent emission bandwidth displays a maximum frequency coverage of 1.3 THz22, and is centered at 2.9 THz. The mode spacing, defined by the cavity length, can be electrically extracted through the measurement of the intermode beat-note (IBN—fIBN~ 17.45 GHz).
The experimental setup used for full stabilization and characterization of the QCL-comb is shown in Fig.1a, and it is based on multi-heterodyne dual-comb detection. An amplified mode-locked Erbium-dopedfiber fs-laser (Menlo Systems, model FC1500) is optically rectified in a single-mode Lithium Niobate waveguide23, providing a zero-offset free-standing THz frequency
comb24,25(OR-comb). The repetition rate (f
rep) of the pump laser
can be tuned around 250 MHz, being the same for the generated THz OR-comb, while the average power of 350 mW at 1.55 μm generates an overall THz average power of about 14 μW. The QCL is mounted on the coldfinger of a liquid Helium cryostat at a fixed heat sink temperature of 25 K, and it is driven in continuous-wave (CW) mode by an ultra-low noise current driver (ppqSense, QubeCL-P05) around 0.32 A. The OR-comb and the QCL-comb beams are overlapped by means of a wire grid polarizer (WGP) and generate the dual-comb multi-heterodyne signal on a fast non-linear detector, i.e. a hot electron bolometer (HEB—Scontel RS0.3-3T1). This frequency mixing results in a down-converted radio-frequency comb (RF-comb), which carries full information on the QCL-comb emission, and that allows its thorough characterization through Fourier-transform Analysis of Comb Emission (FACE) technique15.
A frequency synthesizer, oscillating at a frequency close to the QCL cavity round trip time (around 17.45 GHz) is used for injection locking the QCL-comb spacing, while a phase-locked loop (PL-loop) circuit, on board the current driver, is used to stabilize the frequency of one down-converted mode against a local oscillator frequency around 180 MHz. The phase-lock loop has a 400 kHz electronic bandwidth and is capable of effectively concentrating the power of the QCL-comb mode within the OR-comb mode width (see Fig. 1b). The two signals are coupled to the QCL by a cryogenic bias-tee (Marki Microwave, mod. BT-0024SMG) placed on chip, very close to the QCL device. The synthesizer, the PL-loop local oscillator and the spectrum analyzer used for the acquisitions are tightly ruled by a GPS-Rb-quartz frequency reference chain.
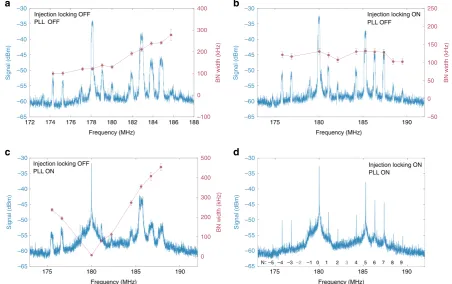
Phase-locking the QCL-comb. Figure 2a shows the RF-comb spectrum of the free-running QCL-comb (blue trace) acquired by a real-time spectrum analyzer. The beat-notes (BNs) pattern distinctly retraces the QCL-comb Fourier transform infrared (FTIR) spectrum measured in air (Methods section). In these conditions, the emission linewidth of the OR-comb modes does not contribute to the BNs width, which shows a linear increase (about 14.4 kHz per mode) with the QCL-comb order N. This increment is close to the IBN width for a comparable acquisition time, confirming that the observed trend can be ascribed to fre-quency spacing fluctuations. In this scenario, a full active stabi-lization of the comb emission frequencies can be performed by means of two independent actuators.
On one hand, the mode spacing of the QCL-comb can be stabilized through injection locking (Fig. 2b), by feeding to the QCL a radio-frequency signal (fRF) approaching the QCL cavity
round-trip frequency (fIBN). When injection locking is active, the
QCL-comb frequency spacingfluctuations are drastically reduced (Fig. 2b), while only the mode-independent offset-frequency fluctuations survive, as confirmed by the roughly constant width (120 kHz) of the BN signals (red dots).
On the other hand, any mode of the RF-comb can be singly stabilized to a reference oscillator (fLO), using a phase-lock loop
(Fig. 2a). Indeed, the offset fluctuations of the stabilized mode propagate to the adjacent modes as spacing fluctuations. Consequently, a significant broadening is observed for the BNs distant from the stabilized mode.
Finally, simultaneous implementation of both these processes results in a full stabilization of the QCL-comb (shown in Fig.2d),
as confirmed by the linewidth of the acquired BN signals, that are all resolution bandwidth (RBW) limited. It is worth noting that both the stabilization signals are sent to the QCL-comb as electrical signals, acting on its voltage/current, over two well separated frequency ranges: the RF range for the 17.45 GHz signal that locks the mode spacing, and the DC/low frequency range for
172 174 176 178 180 182 184 186 188 Frequency (MHz)
–65 –60 –55 –50 –45 –40 –35 –30
Sign
al (dBm)
–100 0 100 200 300 400
BN wi
dth (kH
z)
175 180 185 190 Frequency (MHz)
–65 –60 –55 –50 –45 –40 –35 –30
Sign
al (dBm)
–50 0 50 100 150 200 250
BN wi
dth (kH
z)
175 180 185 190 Frequency (MHz)
–65 –60 –55 –50 –45 –40 –35 –30
Sign
al (dBm)
0 100 200 300 400 500
BN wi
dth (kH
z)
175 180 185 190 Frequency (MHz)
–65 –60 –55 –50 –45 –40 –35 –30
Sign
al (dBm)
a b
c d
Injection locking ON PLL OFF
–5 –4 –3–2 –1 0 1 2 3 4 5 6 7 8 9
N:
Injection locking ON PLL ON Injection locking OFF
PLL OFF
Injection locking OFF PLL ON
Fig. 2Radio frequency (RF) spectra. RF-comb spectra (blue traces) and related width of each beat-note (red dots), the uncertainty bars have been
calculated as standard deviation on a set of 20 acquisitions. In all the acquisitions the optically-rectified THz frequency comb is fully stabilized, while the QCL-comb is:afree-running;bstabilized mode spacing and free-running offset frequency;cfree-running spacing and stabilized offset;dfully stabilized. The orderNof each comb mode is labeled ind,N=0 indicating the mode used for offset frequency stabilization
BS BP filter
QCL-comb OR-comb
Available for experiment
BP filter
HEB
LO reference Phase-lock
loop
17.45 GHz synthesizer Current
driver
Spectrum
analyzer –50 –60
–70
–90
–100
–110
179.0 179.5 180.0 180.5 181.0 –80
Mod. in
Output
AC
DC
DC+AC
Frequency standard
Bias Tee
Beat-note frequency (MHz)
Intensity (dBm)
b a
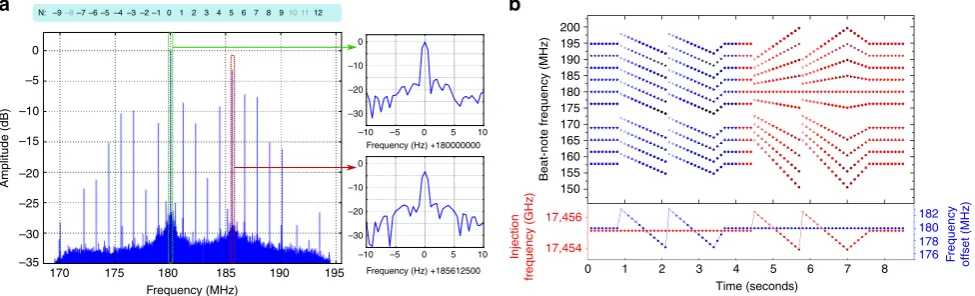
Fig. 1Experimental set-up.aSchematics of the experimental setup employed for full stabilization, control and characterization of the QCL-comb. The
[image:3.595.94.503.52.214.2] [image:3.595.70.523.325.609.2]the PL-loop, with a 400 kHz bandwidth. Actually, this configuration only requires a RF source for mode spacing stabilization, and one single-frequency metrological-grade THz signal23,26,27, falling into the QCL-comb emission spectrum, for
offset frequency stabilization. To this purpose, in this work, we have used one mode of the OR-comb, while exploiting its complete emission for an exhaustive characterization of the QCL-comb.
Frequency stability and comb parameters independent tuning. The QCL-comb mode frequencies can be simultaneously mea-sured with high accuracy by acquiring RF spectra with a small RBW (0.5 Hz), limited by the spectrum analyzer maximum acquisition time of 2 s (Fig.3a). The long acquisition time allows lowering the noise floor, thus enabling the detection of all the emitted modes. In the operating conditions presented in this work, the comb emission is made of 19 modes, with a total spectral coverage of about 400 GHz (−25-dB bandwidth). Moreover, the optical power of the individual modes can vary dramatically, which is another drawback of FWM based QCL-combs. Their RF frequencies coincide, within the RBW (Fig. 3a, insets), with the ones extrapolated from the reference signals frequencies (see Methods section). As a consequence, the emission linewidth of each QCL-comb mode is narrowed down to the linewidth of the OR-comb modes. This latter is ~2 Hz in 1 s, limited by the stability of the GPS-Rb-clock frequency reference used. The frequency reference accuracy of 2 × 10⁻¹²also limits the measurement of the absolute QCL-comb THz frequencies, to a 6 Hz-level. However, for the most demanding applications, the GPS chain can be replaced with afiber-delivered optical frequency standard, already available in our laboratories28, providing a stability of 1 × 10⁻¹⁴in 1 s, and an accuracy of 2 × 10−1629.
By varying fRF and fLO, a fine tuning of the corresponding
QCL-comb parameters (spacing and offset, respectively) is obtained, as confirmed by the retrieved shifts of the RF-comb frequencies (Fig. 3b). Therefore, the double-locking procedure ensures tuning of the QCL-comb along two independent axes of its two-dimensional parameters space, which is a key requisite for full practical exploitation of this metrological-grade source. Actually, although the two actuators are not perfectly“ orthogo-nal”, since the driving current affects both the spacing and offset frequencies, injection locking acts on the mode spacing only, allowing an independent tuning of the two parameters.
Short and long term stability of the modal phases. The employed FACE technique15enables to retrieve the complete set of the modal phases, allowing to investigate their short-term noise and their long-term stability and reproducibility. To this purpose, several 2-seconds-long acquisitions of the multi-heterodyne sig-nal have been asig-nalyzed. In order to assess the long-term repro-ducibility of the phases, different measurements were performed over different days, power cycling the QCL, changing the injec-tion locking frequency and the device operating parameters (i.e. temperature and driving current). The device shows a quite stable phase pattern (Fig.4a), with a phase reproducibility for individual modes always better than 50°. The retrieved phase relations show a parabolic trend, giving a 6.8(0.5) ps2/rad group delay dispersion (GDD). This value is close to that measured for a QCL-comb operating under comparable band alignment conditions, and without dispersion compensation geometry15. The retrieved
phases and amplitudes of the QCL modes can also be used to reconstruct the QCL electricfield and intensity emission profile, as shown in Fig.4b. These reconstructions confirm that, while the QCL intensity is deeply modulated in time, it is far different from a short-pulse emission, since light is emitted during >40% of the round-trip time.
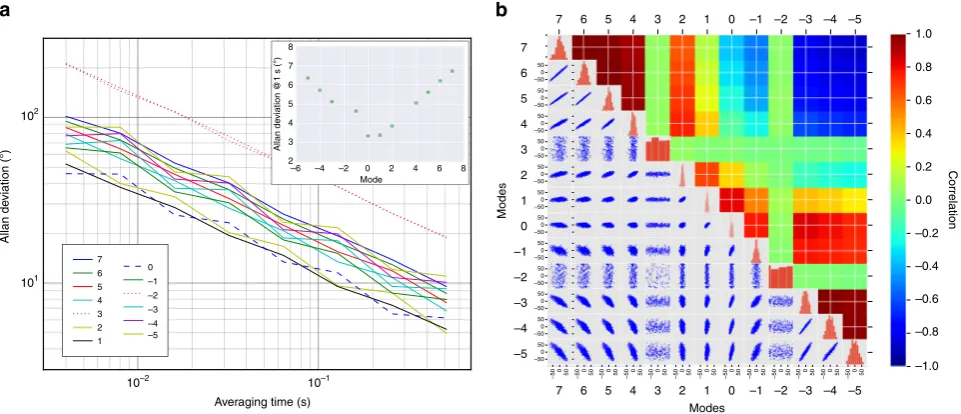
The short-term stability of the phases has been evaluated through calculation of the Allan deviations over a 2-seconds-long measurement for the modes labeled as−5…7, sampled at 4 ms (Fig.5a). Due to the poor S/N of modes−2 and 3 (see Fig. 3a), their phase cannot be determined at short timescales, leading to high values of the Allan deviation, dominated by instrumental noise. We can extrapolate the Allan deviations of the phases at ~1 s, as shown in Fig. 5a inset, and, except from these last two modes, they are all within 7°, which is a remarkable result if compared with the state-of-the-art in other spectral regions30.
Moreover, it is worth noting that the lowest noise level is measured on the phase-locked mode 0 and its neighbors, and progressively increases with the order N. This suggests that the dominant noise source is the residual noise from the spacing locking mechanism (i.e. injection locking), that coherently propagates along the comb. Such effect can be evidenced by calculating the correlation matrix among the modal phases (Fig. 5b). For modes −2 and 3, no correlation with the other modes appears, confirming that theirfluctuations are limited by instrumental noise. At the same time, strong correlations and anti-correlations between modes which are, respectively, adjacent and opposite with respect to mode 0 can be seen. This behaviour
N:
0 –9–8–7
170 175
Frequency (MHz)
Frequency (Hz) +180000000
180 185 190 195
–6 –5
–5
–10
Amplitude (dB) Beat-note frequency (MHz)
–15
–20
–25
–30
–10
–10 –5 0 5 10
Frequency (Hz) +185612500
–10 –5 0 5 10
–20
–30
–35
–4 –3 –2 –1 0
0
200
b a
195 190 185 180 175 170 165 160 155 150
Time (seconds)
0 1 2 3 4 5 6 7 8
182 180 178 176 17,454
17,456
Injection
frequency (GHz)
F
requency
offset (MHz)
–10
–20
–30 0 1 2 3 4 5 6 7 8 910 1112
Fig. 3High-resolution comb spectra and frequency tuning.aRF-comb spectrum measured with 0.5 Hz RBW, limited by the acquisition time of 2 s. Insets:
zoom on two RBW-limited peaks.bFine tuning of the QCL-comb frequencies. First, thefLOfrequency of the PL-loop that stabilizes the comb-offset is
tuned, in steps of 500 kHz, between 183 and 177 MHz. Then, the frequency of the injecting RF-signal (fRF) is tuned by 2.4 MHz, in steps of 200 kHz.
[image:4.595.55.543.543.691.2]can be found in traditional passively mode-locked frequency combs with residual phase noise and confirms the high level of coherence of the QCL-comb. Finally, principal components analysis can be performed on the correlation matrix by its diagonalization. The main eigenvalues normalized to the trace are (0.64, 0.29, 0.035, 0.025, 0.01…), confirming that the residual phase noise affecting the QCL-comb is, in fact, two-dimensional. The larger component is ascribed to comb modes spacing, rather than carrier offset frequency, suggesting that the injection locking mechanism should be improved.
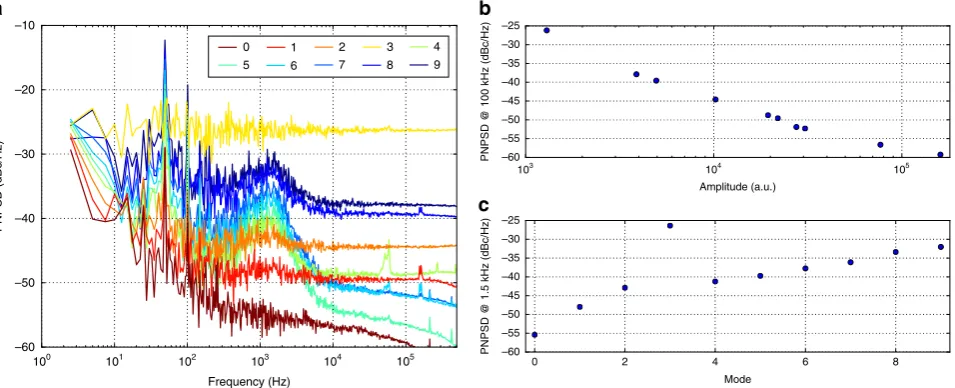
Phase noise power spectral density analysis. The simultaneous retrieval of the Phase Noise Power Spectral Density (PNPSD) of the beat-notes, available from the Fourier-transform spectra of the RF-comb in 2-second-long acquisitions (see Fig. 3a), allows
the analysis of the phase noise at timescales shorter than 4 ms. Figure 6a shows the PNPSD of the modes from 0 to 9. The instrumental noise floor corresponds to the PNPSD flat levels above 10 kHz, that are proportional to the inverse of the ampli-tude of each considered beat-note (see Fig.6b) and set the sen-sitivity limit of the phase-noise measurement. In fact, for the most intense modes (e.g. modes 0 and 5), a higher sensitivity is achieved (lower PNPSD). At frequencies below 10 kHz, the resi-dual phase noise of the modes emerges from the noise floor. Apart from mode 3, with a S/N that is too small, in this range the PNPSD levels are proportional to the order of the modes, instead of being proportional to their amplitude, as shown in Fig.6c. This confirms that the measured excess noise is related to the modes spacing, while its shape suggests a 2 kHz locking bandwidth for the injection locking mechanism. The PNPSD of modes from 0 to−5 is reported in Supplementary Fig. 2, and shows the same
a b
–100 –50 0 50 100
Time (ps) 0.0 0.2 0.4 0.6 0.8 1.0 Normalized intensity
–30 –20 –10 0 10 20 30
0 –40 –30 –20 –10 10 20 30 40
Electric field (a.u.)
–8 –6 –4 –2 0 2 4 6 8 10
Mode order –100 0 100 200 300 400
Mode phase (°)
Time (ps)
Fig. 4Measured phases.aMeasured phases of each emitted mode. Different colors represent sets of measurements collected during different days and
under different operating conditions.bQCL output intensity profile and electricfield, reconstructed through one of the sets of phases shown ina
a b 8 7 50 0 –50 50 0 –50 50 0 –50 50 0 –50 50 0 –50 50 0 –50 50 0 –50 50 0 –50 50 0 –50 50 0 –50 50 0 –50 50 0 –50 –50 0 50 –50 0 50 –50 0 50 –50 0 50 –50 0 50 –50 0 50 –50 0 50 –50 0 50 –50 0 50 –50 0 50 –50 0 50 –50 0 50 –50 0 50 7 6 6 5 5 4 4 3 3 2 2 1 1 Modes Modes 0 0 Correlation 1.0 0.8 0.6 0.4 0.2 0.0 –0.2 –0.4 –0.6 –0.8 –1.0 –1 –1 –2 –2 –3 –3 –4 –4 –5 –5
7 6 5 4 3 2 1 0 –1 –2 –3 –4 –5
7
6
–6 –4 –2 Mode
0 2 4 6 8 5
Allan de
viation @1 s (°)
Allan de viation (°) 4 3 2 102 101
10–2 10–1
Averaging time (s)
0 –1 –2 –3 –4 –5 6 7 5 4 3 2 1
Fig. 5Phase noise analysis.aAllan variance analysis on the phase of each comb mode during a 2-seconds-long acquisition. The characteristic trends
confirm that the measurements are affected by statistical noise. Inset: linear dependence of extrapolated Allan deviation at 1 s on the mode order.
[image:5.595.58.539.52.215.2] [image:5.595.58.539.271.478.2]kind of behaviour. It is worth noting that the Allan deviation analysis presented in Fig. 5a is related to the portion of the PNPSD below 250 Hz, thus further confirming the proportional dependence on the modes order shown in Fig.5a inset.
Discussion
In conclusion, the reported results show that QCL-combs are well suited for the most demanding applications, achieving a Hz-level stabilization of each individual emitted mode, as well as a com-plete and independent control of the two key comb parameters. The retrieved phase relation, that enables reconstruction of the electric field and of the intensity profile, is impressively repro-ducible over different days, power cycles and operating condi-tions. The high degree of coherence induced by the FWM mode-locking mechanism is confirmed by a correlation analysis and PNPSD retrieval, showing a residual collective phase noise, due to an imperfect injection locking mechanism.
In the future, such a double-locking and phase characterization setup will be applied to dispersion-compensated devices, where comb operation at higher operating currents will ensure a broader spectral coverage. Novel comb-based setups will benefit from such fully phase-stabilized QCL-combs, addressing the most demanding metrological and sensing applications with minia-turized devices emitting in key spectral windows difficult to access, so far. Moreover, harnessing QCL nonlinearity, exploiting also novel phenomena, like χ2-cascaded frequency generation31,
and making use of quantum simulation schemes in view of a fully-quantum design, QCL-combs with entangled modes and noise squeezed emission could become available, providing a solid-state miniaturized platform with a huge impact on a wide range of quantum technologies.
Methods
Design and fabrication of the QCL comb. The heterogeneous GaAs/AlGaAs
heterostructure comprises three active modules, grown on a semi-insulating GaAs substrate by molecular beam epitaxy, exploiting alternating photon- and long-itudinal optical (LO) phonon-assisted transitions between inter-miniband22. The
number of periods, the order of the active region modules and the average doping were carefully arranged to give aflat gain and uniform power output across the whole spectrum. The gain medium of each modules is respectively centered at 3.5 THz, 3.0 THz, and 2.5 THz. The average doping was set to 3 × 1016cm−332. Laser
bars were fabricated on a standard metal–metal processing that relies on Au–Au thermo-compression wafer bonding of the 17-μm-thick active region onto a highly doped GaAs substrate. Laser bars were defined using dry-etching, leading to almost
vertical sidewalls narrow laser cavities without any unpumped regions, to favour stable continuous wave (CW) operation. A Cr/Au (8 µm/150 µm) top contact was then deposited on the top surface of the laser bars, leaving thin (5 µm) symmetrical side regions uncovered, to suppress undesired high order lateral modes. Thin (5-nm-thick) lateral nickel side absorbers were then deposited over the uncovered region using a combination of optical lithography and thermal evaporation. Laser bars 60–85 µm wide and 2 mm long werefinally cleaved and mounted on a copper bar on the coldfinger of a helium cryostat.
Supplementary Fig. 1a shows the current–voltage characteristics of the THz QCL-comb used in this work. The intermode beat-note retrieved at 320 mA, where the QCL shows a single narrow signal, is plotted in Supplementary Fig. 1b, while the corresponding in air Fourier transform infrared spectrum is graphed in panel 1c, for reference.
Dual-comb down-conversion. In the dual-comb multi-heterodyne setup, the
repetition ratefrepof the OR-comb is tuned to be close to an integer submultiple of the frequency spacingfsof the QCL modes, with a small detuningfd:
fs¼kfrepþfd ð1Þ In this configuration, the QCL modes at THz frequencies are down-converted to RF beat-note (BN) signals. In fact, considering the electricalfield of theNth mode of the QCL-comb:
EQ;N¼BNei½2πðfoffþNfsÞtþφN ð2Þ
heterodyning it with the Mthmode of the OR-comb:
EO;M¼AMei½2πðMfrepÞtþφM ð3Þ
beingM¼kN, the down-converted signal will carry the term:
AMBNei½2πðfoffþNfsMfrepÞtþðφNφMÞ ¼AMBNei½2πðfoffþNfdÞtþðφNφMÞ ð4Þ In the above equations,foffis the offset frequency of the QCL-comb (the OR-comb is offset-free), whileφNandφMare the Fourier phases of the QCL-comb mode and of the OR-comb mode, respectively.
Iffdis chosen to be in the range of few MHz, the resulting BNs are RF signals, equally spaced byfd, that can be simultaneously analyzed by a spectrum analyzer. The signal in eq. 4 clearly bears information on both the amplitudes and phases of the two parent modes. In particular, the OR-comb phases are constant in time and their phase relation is linear, as for any mode-locked pulsed FC source15, while
their amplitude is expected to be almost constant along the QCL-comb emitted spectrum24. Moreover, the OR-comb is naturally a zero-offset FC, whose modes
can be fully stabilized at a metrological level by phase-locking its repetition rate to a 10 MHz quartz-clock disciplined by a Rb-GPS (global positioning system) clock with a stability of 6 × 10⁻¹³in 1 s, and absolute accuracy of 2 × 10⁻¹². On the other hand, the free-running QCL-comb emission frequencies will oscillate due to both offset and spacingfluctuations, preventing an accurate phase/frequency retrieval from the BN signals, especially for long observation times. Injection locking and phase locking to one OR-comb mode are used to remove thesefluctuations, fully stabilizing the QCL-comb emission.
Moreover, since all the parameters governing the QCL-comb down conversion are referenced to the primary frequency standard, the frequencyfiof the ith
RF-100 101 102 103 104 105 Frequency (Hz)
–60 –50 –40 –30 –20 –10
PNPSD (dBc/Hz)
2 6
3 7
0 4
8 1
5 9
103
104
105
Amplitude (a.u.) –60
–55 –50 –45 –40 –35 –30 –25
PNPSD @ 100 kHz (dBc/Hz)
0 2 4 6 8
Mode –60
–55 –50 –45 –40 –35 –30 –25
PNPSD @ 1.5 kHz (dBc/Hz)
a b
c
Fig. 6Phase Noise Power Spectral Density analysis. Simultaneous retrieval of the PNPSD of the beat-notes from the Fourier-transform spectra of the
[image:6.595.62.540.52.246.2]comb mode can be calculated with this same precision, simply considering that:
fi¼fLOþi kfrepfRF
ð5Þ
and these values can be compared to the ones experimentally retrieved with a 500 mHz accuracy, as reported in the main text.
This accuracy level allows also to simultaneously retrieve all the absolute THz frequencies of the QCL-comb modes with an accuracy limit set by the GPS-Rb-clock chain. In fact, if the RF beat-note at frequencyfiis originated from theNth mode of the QCL comb, beating with theMthmode of the OR-comb, one can write the relation:
fQCL;N¼Mfrep±fi ð6Þ By tuningfrepand leaving all the other parameters unaltered, it is possible to unambiguosly retrieve the orderM(around 12,000), as thoroughly explained in ref.33. Finally, while the accuracy onf
iis 500 mHz, the phase-lockedfrepfollows the GPS-Rb-quartz chain accuracy, that provides the limiting uncertainty factor in the
fQCL,Nmeasurement of about 6 Hz.
Data availability
The data supporting thefindings of this study are available from the corresponding author upon reasonable request.
Received: 10 March 2019 Accepted: 7 June 2019
References
1. Hänsch, T. W. Nobel lecture: passion for precision.Rev. Mod. Phys.78, 1297–1309 (2006).
2. Diddams, S. A. et al. Direct link between microwave and optical frequencies with a 300THz femtosecond laser comb.Phys. Rev. Lett.84, 5102–5105 (2000). 3. Udem, T., Holzwarth, R. & Hänsch, T. W. Optical frequency metrology.
Nature416, 233–237 (2002).
4. Holzwarth, R. et al. Optical frequency synthesizer for precision spectroscopy.
Phys. Rev. Lett.85, 2264–2267 (2000).
5. Savchenkov, A. A. et al. Generation of Kerr combs centered at 45μm in crystalline microresonators pumped with quantum-cascade lasers.Opt. Lett. 40, 3468–3471 (2015).
6. Luke, K., Okawachi, Y., Lamont, M. R. E., Gaeta, A. L. & Lipson, M. Broadband mid-infrared frequency comb generation in a Si3N4 microresonator.Opt. Lett.40, 4823–4826 (2015).
7. Li, H. et al. Dynamics of ultra-broadband terahertz quantum cascade lasers for comb operation.Opt. Express23, 33270–33294 (2015).
8. Wang, F. et al. Generating ultrafast pulses of light from quantum cascade lasers.Optica2, 944–949 (2015).
9. Tzenov, P. et al. Passive and hybrid mode locking in multi-section terahertz quantum cascade lasers.New J. Phys.20, 053055 (2018).
10. Barbieri, S. et al. Coherent sampling of active mode-locked terahertz quantum cascade lasers and frequency synthesis.Nat. Photonics5, 306–313 (2011). 11. Wang, F. et al. Short terahertz pulse generation from a dispersion
compensated modelocked semiconductor laser.Laser Photonics Rev.11, 1–9 (2017).
12. Hugi, A., Villares, G., Blaser, S., Liu, H. C. & Faist, J. Mid-infrared frequency comb based on a quantum cascade laser.Nature492, 229–233 (2012). 13. Burghoff, D. et al. Terahertz laser frequency combs.Nat. Photonics8, 462–467
(2014).
14. Singleton, M., Jouy, P., Beck, M. & Faist, J. Evidence of linear chirp in mid-infrared quantum cascade lasers.Optica5, 948–953 (2018).
15. Cappelli, F. et al. Retrieval of phase relation and emission profile of quantum cascade laser frequency combs.Nat. Photon.(2019, in press).https://doi.org/ 10.1038/s41566-019-0451-1
16. Burghoff, D. et al. Evaluating the coherence and time-domain profile of quantum cascade laser frequency combs.Opt. Express23, 1190–1202 (2015). 17. Coddington, I., Newbury, N. & Swann, W. Dual-comb spectroscopy.Optica3,
414–426 (2016).
18. Villares, G., Hugi, A., Blaser, S. & Faist, J. Dual-comb spectroscopy based on quantum-cascade-laser frequency combs.Nat. Commun.5, 5192 (2014). 19. Hillbrand, J., Maxwell Andrews, A., Detz, H., Strasser, G. & Schwarz, B.
Coherent injection locking of quantum cascade laser frequency combs.Nat. Photonics13, 101–104 (2019).
20. Cappelli, F. et al. Frequency stability characterization of a quantum cascade laser frequency comb.Laser Photonics Rev.10, 623–630 (2016).
21. Vitiello, M. S. et al. Quantum-limited frequencyfluctuations in a terahertz laser.Nat. Photonics6, 525–528 (2012).
22. Garrasi, K. et al. High dynamic range, heterogeneous, terahertz quantum cascade lasers featuring thermally tunable frequency comb operation over a broad current range.ACS Photonics6, 73–78 (2019).
23. De Regis, M., Consolino, L., Bartalini, S. & De Natale, P. Waveguided approach for difference frequency generation of broadly-tunable continuous-wave terahertz radiation.Appl. Sci.8, 2374 (2018).
24. Consolino, L. et al. Phase-locking to a free-space terahertz comb for metrological-grade terahertz lasers.Nat. Commun.3, 1040 (2012). 25. Bartalini, S. et al. Frequency-comb-assisted terahertz quantum cascade laser
spectroscopy.Phys. Rev. X4, 21006 (2014).
26. Consolino, L., Bartalini, S. & De Natale, P. Terahertz frequency metrology for spectroscopic applications: a review.J. Infrared Millim. Terahertz Waves38, 1289–1315 (2017).
27. De Regis, M. et al. Room-temperature continuous-wave frequency-referenced spectrometer up to 7.5THz.Phys. Rev. Appl.10, 064041 (2018).
28. Insero, G. et al. Measuring molecular frequencies in the 1–10μm range at 11-digits accuracy.Sci. Rep.7, 12780 (2017).
29. Calonico, D. et al. High-accuracy coherent optical frequency transfer over a doubled 642-kmfiber link.Appl. Phys. B Lasers Opt.117, 979–986 (2014). 30. Chen, Z., Yan, M., Hänsch, T. W. & Picqué, N. A phase-stable dual-comb
interferometer.Nat. Commun.9, 3035 (2018).
31. Mosca, S. et al. Modulation instability induced frequency comb generation in a continuously pumped optical parametric oscillator.Phys. Rev. Lett.121, 093903 (2018).
32. Li, L. H. et al. Broadband heterogeneous terahertz frequency quantum cascade laser.Electron. Lett.54, 1229–1231 (2018).
33. Consolino, L. et al. Spectral purity and tunability of terahertz quantum cascade laser sources based on intracavity difference-frequency generation.Sci. Adv.3, e1603317 (2017).
Acknowledgements
We acknowledgefinancial support from the EC Project 665158 (ULTRAQCL), the ERC Project 681379 (SPRINT), the Italian ESFRI Roadmap (Extreme Light Infrastructure— ELI), EC–H2020 Laserlab-Europe grant agreement 654148, Ministero dell‘Istruzione, dell’Università e della Ricerca (Project PRIN-2015KEZNYM“NEMO—Nonlinear dynamics of optical frequency combs”). We also acknowledge support from the EPSRC (HyperTerahertz programme, EP/P021859/1). EHL acknowledges support from the Royal Society and Wolfson Foundation.
Author contributions
L.C. and S.B. conceived the experiment, L.C. performed the measurements, L.C., M.N., F. C., and S.B analysed the data, L.C. wrote the manuscript, M.N., F.C., M.S.V., P.D.N., and S.B. contributed to manuscript revision, K.G., F.P.M. and M.S.V. fabricated the QCL device, L.L., A.G.D. and E.H.L. grew the QCL heterostructure, L.C., M.N., F.C., P.D.N., and S.B. discussed the results, M.S.V. supervised the design and development of the THz QCL combs. The work was done under the joint supervision of P.D.N. and S.B.
Additional information
Supplementary Informationaccompanies this paper at https://doi.org/10.1038/s41467-019-10913-7.
Competing interests:The authors declare no competing interests.
Reprints and permissioninformation is available online athttp://npg.nature.com/ reprintsandpermissions/
Peer review information:Nature Communicationsthanks the anonymous reviewers for their contribution to the peer review of this work.
Publisher’s note:Springer Nature remains neutral with regard to jurisdictional claims in published maps and institutional affiliations.
Open AccessThis article is licensed under a Creative Commons Attri-bution 4.0 International License, which permits use, sharing, adaptation, distribution and reproduction in any medium or format, as long as you give appropriate credit to the original author(s) and the source, provide a link to the Creative Commons license, and indicate if changes were made. The images or other third party material in this article are included in the article’s Creative Commons license, unless indicated otherwise in a credit line to the material. If material is not included in the article’s Creative Commons license and your intended use is not permitted by statutory regulation or exceeds the permitted use, you will need to obtain permission directly from the copyright holder. To view a copy of this license, visithttp://creativecommons.org/licenses/by/4.0/.