THE ECONOMIC BACKGROUND
RECENT TRENDS IN SCOTTISH
EXPORTS
Exports are of critical importance to the Scottish Economy. In 1989, Scottish firms sold goods and services worth £64.7bn to final users, of which 21'/2% were to customers in the rest of the UK (RUK) and 14.7% to overseas (ROW) clients. In the case of manufacturing, final sales totalled £25.4bn, of which 35.3% were due to RUK and 32.5% to the ROW. Thus, two thirds of Scottish manufactured goods were sold out with Scotland illustrating the importance of non domestic markets to Scottish incomes and employment.
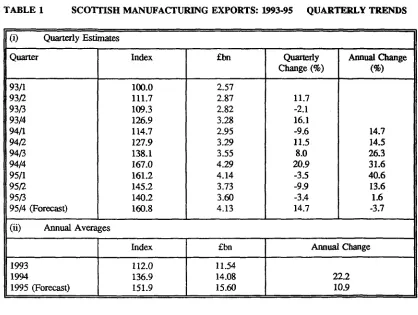
Since 1989, Scotland has become more export oriented. The Quarterly Index of Scottish Manufactured Exports prepared by the SCDI indicates that manufactured exports increased from £HVibn in 1993 to £14.1bn in 1994 and £15.6bn last year. This represents a growth of 22.2% in 1994 and 10.9% in 1995. The latest SCDI quarterly data are set out in Table 1. Examination of the quarterly index compared to the equivalent quarter one year previously indicates that manufactured exports increased sharply in the 2nd half of 1994 and 1st quarter of 1995 at which point exports were 40Vi% higher than 12 months previously. In 1995, export growth slowed to 13.6%pa in the 2nd quarter and 1.6%pa in quarter 3. Economists at the SCDI forecast exports of £4.13bn in the 4th quarter of last year which is 33A% lower than in the 4th quarter of
1994. This may turn out to be a generous assessment.
However, Scottish exports remain at record levels and trade will continue to be of increasing importance to the Scottish economy which continues to experience a strong trend in greenfield and brownfield investment by multinational companies seeking a stable base for export marketing. The latest sectoral and geographical trends for the fiscal year 1994/95 have recently been released by the SCDI. In this period, Scottish manufactured exports totalled £14.3bn or £12.6bn in 1990 prices. In real terms, the SCDI estimate that Scottish manufactured exports grew by 22.8%
between this period and the 1993/4 fiscal year, which compares favourably with a 9Yi% change posted in the UK. Thus, Scotland's share of UK manufacturing exports rose to a record 11.6%, up from 10.1% in 1992/3 and 10.3% in 1993/94.
The Electrical and Instrument Engineering sectors account for exports valued at £7.05bn, which constitutes 49V4% of total overseas sales. Computer exports comprise £4.85bn which represents 69% of electrical and instrument engineering foreign sales and 34% of all Scottish manufactured exports. Whisky exports totalled £2.19bn or 15.4% of all manufactured exports whilst chemicals accounted for £14.65bn or 10.3%. Thus, these 3 activities account for circa % of all Scottish exports with Mechanical Engineering contributing a further £871m or 6.1%. This illustrates that Scottish exports continue to be focused in a relatively small number of industrial sectors.
In the 2 years between 1992/3 and 1994/5, Scottish manufactured exports increased from £9.68bn to £14.26bn, in current prices. This represents a change of £4.58bn or 47.3%. In this period, exports from the electrical and instrument engineering sectors increased by £3.2 lbn which represents 70% of the increase recorded in exports. Chemicals exports grow by £325.lm or 6'/2% of the total change, whisky by £232.4m (5.1%), other transport equipment (ships and aeroplanes) by £220.5m (4.8%), mechanical engineering £136.5 (3%) and paper, printing and publishing £123.5 (2%%). Together the aforementioned activities account for circa 92% of the increase in exports in the 1992-94 period.
production, which indicates that output in electrical and instrument engineering grew by circa 25% in both 1993 and 1994. Clearly, exports have played a significant role in this impressive story.
Table 2 sets out the geographical distribution of Scottish manufactured exports for the period 1992/3 to 1994/95. In 1994/5, the EU accounted for 55% of exports, EFTA 10%%, North America IP/2% and the Far East, including Japan, a further 13.1%. Thus, mainland Europe accounted for circa two thirds of total Scottish exports. The share due to the EU is down from 58%% in 1992/93 but up from the 52.9% posted in 1993/93. In 1993, the EU economy contracted by 0.4% but recovered in 1994 to grow by 2%% and by 2.8% in 1995. Thus, export performance in EU markets follows the pattern of output growth in that area. In addition, the share of manufactured exports shipped to Japan fell from 4J/2% in 1992/3 to 3.4% in 1994/5, again reflecting the sluggish nature of the Japanese economy which grew by 1.1% in 1992, fell by -V*% in 1993 and grew by a Vz% in 1994.
Between 1992/3 and 1994/5, Scottish manufactured exports grew by £4.58bn or 47.3%. The EU accounted for a rise of £2.17bn or 47.1% of the total increase, with EFTA accounting for 17V4% and the Pacific tiger economies a further 17%. Within the EU, France accounted for nearly V* of the total rise in exports and 52% of the rise in shipments to the EU. Across this period, France replaced Germany as the top market for Scottish manufactured exports. Germany remains the 2nd largest destination for Scottish exports accounting for 11% of the total. Between 1992 and 1994, exports to Germany rose £118m which represents 2.6% of the total growth in exports of £4.58bn. The USA remained our 3rd largest export market in the 1992-94 period accounting for 10%% of overseas shipments and 7%% of the total rise in the this period.
Holland ranked as our 4th largest export market with sales of £1.38bn in 1994/5. Dutch sales increased by £444m in the 1992/3 to 1994/5 period, representing 9%% of the total increase. Italy remains Scotland's 5th largest foreign market with sales of £800m or 5.6% of total exports. In the 1992-94 period, sales to the Italian market increased by £193m which accounts for 4V4% of the total rise in manufactured exports. Exports to the EFTA countries rose by £794m or 108.2% to comprise 10.7% of overseas sales and account for 17.3% of the growth in exports. Exports to the orient, excluding Japan, rose by £778m or 128% which
represents 9.7% of Scottish exports and 17% of the increase in overseas trade in manufactures. Although small in terms of the share of Scottish export sales, shipments to Australasia rose by
105.8% and to Eastern Europe by 162.2%.
PROSPECTS FOR SCOTTISH
EXPORT MARKETS
The world economy slowed in 1995 following strong growth in 1994. In 1994, world output rose sharply following a period of weak growth and recession. Thus G7 GDP grew by \Vi% in 1992, 1.1% in 1993 before advancing by 2.9% in 1994, whilst EU income rose by 1% in 1992, declined by 0.4% in 1993 before rising strongly by 2%% in 1994. In the case of the OECD industrialised countries, GDP grew by Wi.% in 1992, 1% in 1993 and 2.8% in 1994. In 1993, Japan, Germany, France and Italy all experienced recessions which lagged behind those experienced by the US in 1991 and the UK in 1990 to 1992. With the exception of Japan, all the major economies recovered strongly in 1994.
In this period, consumer price inflation fell across the industrialised world. In the OECD, inflation fell from 3.5% in 1992 to 2.3% in 1994 whilst in the EU inflation tumbled from 4.9% in 1992 to 3»/2% 2 years later. Similarly, G7 inflation tumbled from 3.2% in 1992 to 2% in 1994. The falls in inflation reflect the fiscally induced slowdown across the industrialised world and are evident in most countries in Europe, North America and Asia. However inflation has continued to abate as growth has resumed reflecting sizeable output gaps in most countries.
This year we expect growth to slow further. The situation is particularly worrying in Scotland's 3 largest export markets. In France, consumer and business sentiment has collapsed on the back of considerable disillusion with the stance of the Chirac administration. We expect French GDP to grow by under 2%, constrained by modest growth in both public and private consumption. Although French interest rates are expected to fall, there remains a substantial premium compared with other countries which will serve to stem an run on the franc. We expect French GDP to increase by 2V*% next year as consumers expenditure recovers modestly and investment grows more strongly. However, the former will be constrained by ongoing rises in unemployment which is expected to average 12V2% in 1997. As elsewhere inflation is forecast to remain subdued.
The German economy faced a difficult period in the 2nd half of 1995 and commentators have been busy scaling down forecasts for German activity. At the time of writing, business and consumer sentiment is weakening rapidly. We expect further falls in German interest rates which will help stabilise output at a time of ongoing fiscal tightening designed to keep Germany on track relative to the EMU convergence criteria. This suggests a slackening of the growth in public consumption to under 1*4%. The DM will remain strong restricting the scope for export growth, whilst investment is likely to increase only modestly with a firm trend in plant and equipment offset by a torrid outlook for construction. We expect that private consumption growth will fall to under 2% this year and that stockbuilding will resume extremely modestly. Thus, we expect the German economy to grow by a little under 2% this year.
The outlook for Germany in 1997 is better. We expect that public consumption will be reined back further and grow by less than Vi%. However, private consumption will recover firmly and investment growth will average 2lA% on the back of
a 5% increase in spending on plant and equipment and a modest recovery in the housing market. German GDP is forecast to grow by 2.3% next year whilst German unemployment is expected to fall slightly in 1997 to 9% from 9.4% in 1996. In the next two years we expect average earnings to rise by under 4% pa and German inflation to rise slightly next year.
A strong recovery is expected in Japan following a period of weakness. Growth in the Japanese economy is expected to be 2.7% both this year and
next whilst growth in the rest of Asia is likely to increase from 8% this year to %Vi% in 1997. In America, fiscal policy remains tight and real interest rates high. US growth is likely to abate from 3*4% last year to 2% this year before recovering to 2*4% in 1997. The slowdown in the US is due to faltering private consumption and expected cuts in public consumption, at a time when the fast growth in capital formation is likely to fall sharply from the 12*4% evident in 1994 and the 10*4% posted last year. The slowdown is evident in all sectors but likely to be particularly strong in residential construction.
CONCLUDING REMARKS
World growth is generally expected to further weaken in 1996 before recovering in 1997. In the G7, GDP is forecast to rise by 2.1% in 1996, by 2.3% in the EU and by 2*4% across the OECD. In 1997, G7 growth is projected at 2*4% whist output is expected to rise at a similar rate in the EU. The OECD industrial economies are forecast to advance by 2.6%. As an exercise, we have constructed a GDP growth measure for Scottish export markets. This is derived by weighting overseas countries growth rates by the Scottish export shares posted in 1994/5. This indicates that Scottish export markets grew by 3.3% in 1994 and by 3% in 1995 which is consistent with the export slowdown expected last year.
This year, we expect GDP in Scottish export markets to rise by 2.6% before growing by 3% in
1997. Ceteris paribus, this suggests that Scottish export growth should slow further this year compared with 1995 before accelerating again in
1997.
TABLE 1 SCOTTISH MANUFACTURING EXPORTS: 1993-95 QUARTERLY TRENDS
(i) Quarterly Estimates
I Quarter 93/1 93/2 93/3 93/4 94/1 94/2 94/3 94/4 95/1 95/2 95/3 95/4 (Forecast)
(ii) Annual Avera
[image:4.527.51.482.70.688.2]1993 1994 1995 (Forecast) Index 100.0 111.7 109.3 126.9 114.7 127.9 138.1 167.0 161.2 145.2 140.2 160.8 ges Index 112.0 136.9 151.9 £bn 2.57 2.87 2.82 3.28 2.95 3.29 3.55 4.29 4.14 3.73 3.60 4.13 £bn 11.54 14.08 15.60 Quarterly Change (%) 11.7 -2.1 16.1 -9.6 11.5 8.0 20.9 -3.5 -9.9 -3.4 14.7 Annual Change (%) 14.7 14.5 26.3 31.6 40.6 13.6 1.6 -3.7 Annual Change 22.2 10.9
TABLE 2 SCOTTISH MANUFACTURING EXPORTS: 1992/93 - 1994/95 GEOGRAPHICAL DISTRIBUTION EU France Germany Holland Italy Spain North America USA EFTA