TREE VOLUME AND INCREMENT MODELS
FOR
RADIATA PINE THINNINGS
by
J.W.LEECH
I n /.n
' ) <iiT h e s i s s u b m i t t e d f o r t h e d e g r e e o f M a s te r o f S c ie n c e i n t h e
joint study with Dr. I.S. Ferguson. Except for this section
of chapter IV, and where recognised, this thesis is my own
original work.
ACKNOWLEDGEMENTS
This study was undertaken under the supervision of
Dr. I.S. Ferguson initially at the University of Melbourne and
later at the Australian National University, Canberra. His
constructive criticism and support has been greatly appreciated.
The encouragement and assistance of Messrs. N.B. Lewis,
Chief, Forest Management Division, and A. Keeves, Working Plans
Officer, of the Woods and Forests Department is gratefully
acknowledged.
Permission to use data was given by the Conservator
Woods and Forests Department. Without this permission the
TABLE OF CONTENTS
ACKNOWLEDGEMENTS (i)
TABLE OF CONTENTS (ii)
LIST OF TABLES (vi)
LIST OF FIGURES (ix)
ABSTRACT (x)
I. INTRODUCTION 1
Metrication 3
Notation 4
II. YIELD PREDICTION: PRACTICE AND PROBLEMS 5
CURRENT PRACTICE 6
Stratification 6
Permanent Sample plots 8
Inventory data 9
Short term yield prediction 12
DISCUSSION OF THE PROBLEM . 14
III. STATISTICAL ANALYSIS 16
ASSUMPTIONS IN LEAST SQUARES LINEAR REGRESSION ANALYSIS 17
Homogeneity of the variance 18
Measurement error 20
Serial correlation 21
Normality of residuals 23
TECHNIQUE USED 24
Choice of the level of significance to be used 24
Summary 25
PART 1 A CONSIDERATION OF STAND DENSITY 27
IV. STAND DENSITY INDICES 28
NUMBER OF TREES AS AN INDEX OF DENSITY 31
REINEKE'S STAND DENSITY INDEX 31
The data 33
Growth 36
Mortality 39
A simple model of stand dynamics 42
Stand density index 44
OTHER INDICES USING NUMBER OF TREES AND DIAMETER 47
Basal area 48
Crown competition factor 48
Tree area ratio 54
INDICES USING NUMBER OF TREES AND HEIGHT 55
Hart's Index 55
Hummel's Height/Spacing ratio 56
INDICES USING NUMBER OF TREES, DIAMETER AND HEIGHT 56
Volume 56
Bole area , 57
Schumacher and Coile's stocking percent 57
SUMMARY 58
PART 2 VOLUME AND INCREMENT MODELS FOR RADIATA PINE THINNINGS 60
V. SELECTION OF VARIABLES TO BE USED 61
VOLUME 64
DIAMETER 64
RELATIVE TREE SIZE 64
HEIGHT 65
SITE POTENTIAL 71
Discussion of site potential measures 71
Definition of site potential measures 72
Thinning type 74
Thinning intensity 76
Thinning interval 77
AGE 77
STAND DENSITY 78
VI. DATA PREPARATION 79
CULLING THE DATA 80
DATA EXTRACTION 88
DISTRIBUTION OF THE DATA 90
VII. MODEL FORMULATION 103
VOLUME MODELS 104
Choice of the dependent variable 104
The combined variable equation 105
Models using diameter and height 106
Models using other variables 110
Combined models 115
Summary .116
INCREMENT MODELS 116
Choice of the dependent variable 118
Increment period 118
Annual increment 121
Summary 124
V U I . MODEL EVALUATION AND DEVELOPMENT 127
WEIGHTING FUNCTION FOR THE VOLUME MODELS 128
VOLUME MODELS 135
Testing the volume model 143
WEIGHTING FUNCTION FOR THE INCREMENT MODELS 146
INCREMENT MODELS 153
METRIC MODELS 163
IX. CONCLUSIONS 165
BIBLIOGRAPHY 170
APPENDIX 1 Punch card and magnetic tape file layout for data 176
APPENDIX 2 Regression statistics for volume and increment models 180
L I S T OF T A B L E S
IV. 1 IV. 2 IV. 3
V.l
V.2
V. 3
V I . 1 VI. 2
V I . 3
VI. 4 V I . 5
V I . 6
VI. 7 .
VI. 8
V I . 9
VI. 10
Re g r e s s i o n stati s t i c s e q u a t i o n I V . 4 R e g r e s s i o n st a t i s t i c s equa t i o n I V . 8 R e g r e s s i o n stati s t i c s e q u a t i o n I V . 12
38 41 52
P r e d o m i n a n t h e i g h t - t h i n n i n g study, first t h i n n i n g s 68
P r e d o m i n a n t h e i g h t - t h i n n i n g study, h e a v y t h i n n i n g s to
low stockings 69
P r e d o m i n a n t h e i g h t - t h i n n i n g study, late t h i n n i n g s to
a s t o c k i n g of a p p r o x i m a t e l y 30 t rees p e r acre 70
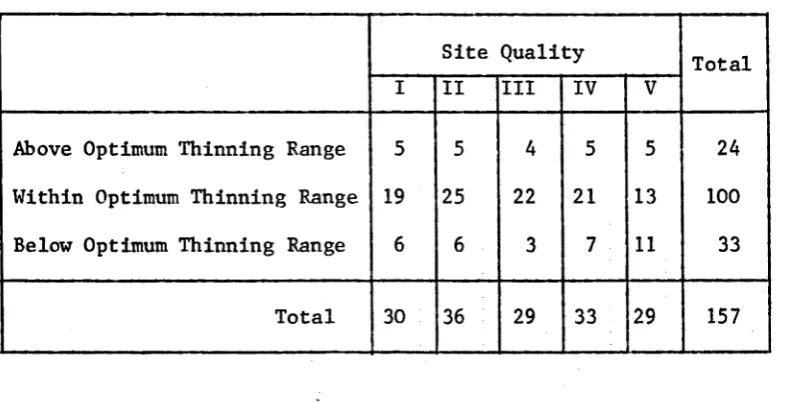
N u m b e r of plot thinn i n g s b y site q u a l i t y and d e n s i t y 85 N u m b e r of plot t h innings b y site q u a l i t y and t h i n n i n g
o p e r a t i o n 86
N u m b e r of plot thinnings b y site q u a l i t y a nd p r e d o m i n a n t
h e i g h t 87
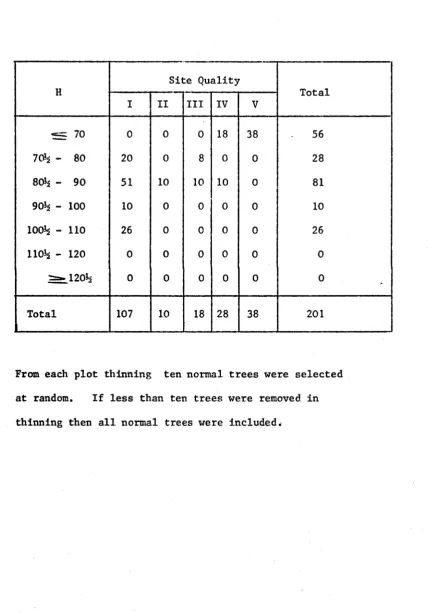
N u m b e r of trees b y site qua l i t y and p r e d o m i n a n t h e i g h t 91 N u m b e r of trees m e a s u r e d one y e a r b e f o r e t h i n n i n g b y
site q u a l i t y and p r e d o m i n a n t h e i g h t 94
N u m b e r of trees m e a s u r e d two y ears b e f o r e t h i n n i n g b y
site q u a l i t y a n d p r e d o m i n a n t h e i g h t 95
N u m b e r of trees m e a s u r e d three y e a r s b e f o r e t h i n n i n g
b y site q u a l i t y and p r e d o m i n a n t h e i g h t 96
N u m b e r of trees m e a s u r e d four y e a r s b e f o r e t h i n n i n g b y
site q u a l i t y and p r e d o m i n a n t h e i g h t 97
N u m b e r of trees m e a s u r e d five y ears b e f o r e t h i n n i n g b y
site q u a l i t y and p r e d o m i n a n t h e i g h t 98
N u m b e r of trees m e a s u r e d six y ears b e f o r e t h i n n i n g b y
V I.11 Number of trees measured in all years before thinning
by site quality and predominant height 100
V I . 12 Number of trees measured in each year before thinning
by site quality 101
VII. 1 Volume models to be evaluated 117
VII.2 Definition of dummy variables 122
VII. 3 Increment models to be evaluated 126
VIII. 1 Class variance, volume 129
VIII.2 Variance estimation models, volume 132
VIII.3 Variance estimation models, volume, summary of re
gression statistics 133
VIII.4 Regression statistics, volume models 136
VIII.5 Volume models evaluated 139
VIII.6 Comparison of alternative forms of site potential,
stand density and age based on equation VIII.24 142
VIII.7 Class variance, increment 148
VIII.8 Variance estimation models, increment ■ 150
VIII.9 Variance estimation models, increment, summary of
regression statistics 151
VIII.10 Regression statistics, increment models 154
VIII.11 Comparison of alternative variables of site potential,
age and stand density based on equation VII.15 156
VIII.12 Comparison of alternative forms of site potential and
stand density, based on equation VII.15 157
VIII.13 Regression statistics, increment models 159
A2.1 Correlation coefficients between independent variables
in equations VII.1-VII.6 181
A2.2 Correlation coefficients between independent variables
A2.3 Regression statistics volume models 183
A2.4 Regression statistics volume models 184
A2.5 Correlation coefficients between independent variables
in accepted volume model 185
A2.6 Correlation coefficients between independent variables
in increment models 186
A2.7 Increment models evaluated 187
LIST OF FIGURES
IV.1 Plot data demonstrating selection of point of onset
of maximum density 35
IV.2 Example of the dynamic relationship between number
of trees per acre and mean diameter A3
IV.3 Comparison of estimated and actual plot trends 45
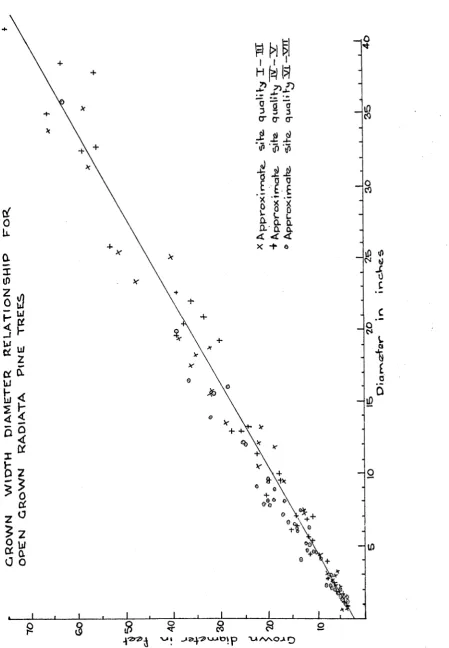
IV.A Crown width diameter relationship for open grown
trees 50
VI.1 Number of trees in each strata, ten randomly
selected trees per plot at thinning 92
VIII.1 Variance of volume estimated from diameter and
predominant height 13A
VIII.2 Variance of increment estimated from diameter and
ABSTRACT
Linear regression analysis is used to estimate models suit
able for predicting the volume and increment of trees to be
thinned from radiata pine stands in the south east of South
Australia.
The volume model predicts the volume of the trees selected
for removal in thinning, from measurements made at time of
thinning. The model is an extension of the combined variable
equation including stand density, site potential, age and
thinning variables.
The increment model predicts the increment that the tree
will put on between inventory and time of thinning between one
and six years later. The model predicts increment from relat
ive tree size, site potential age, stand density and thinning,
variables, and the estimated volume of the tree at time of
inventory.
Data were derived from 157 thinning operations, the volume
model being based on 1418 observations, the increment model 3035.
The models are biologically sound and have been extensively
tested to ensure that the assumptions underlying linear regression
analysis are met; and have been tested against independent test
data.
A number of indices of stand density were evaluated, basal
the maximum basal area the site can sustain, as derived from a
model of stand dynamics.
A site potential measure in South Australia, based on
volume production, site quality, was marginally better than
X. INTRODUCTION
Metrication
I . INTRODUCTION
S outh A u s t r a l i a i s th e d r i e s t s t a t e i n th e Commonwealth, w ith o n ly 1.2% o f th e a r e a r e c e i v i n g o v e r 25 in c h e s (635 mm)
o f r a i n f a l l p e r y e a r ( B e d n a ll, 1 9 5 7 ). I n t e n s i v e p l a n t a t i o n f o r e s t r y i s g e n e r a l l y li m i t e d t o t h e s e h i g h e r r a i n f a l l a r e a s , th e l a r g e s t zone o f w hich i s i n th e s o u t h - e a s t o f t h e s t a t e .
The main p l a n t a t i o n a r e a i s s i t u a t e d i n th e s o u t h - e a s t o f th e s t a t e and h a s b een d e s c r ib e d b y D ou g las (1970) and B e d n a ll (1 9 5 7 ). The r e g i o n a l r e s o u r c e ( in c l u d i n g a d j a c e n t V i c t o r i a n p l a n t a t i o n s ) c o n s i s t s o f some 2 3 2 ,0 0 0 a c r e s
(9 3 ,9 0 0 h a ) o f so ftw o o d p l a n t a t i o n s and i s m a in ly c o n t r o l l e d by f o u r o r g a n i z a t i o n s . The Woods and F o r e s t s D ep artm en t o f
South A u s t r a l i a c o n t r o l s 59%, Softw ood H o ld in g s L td . 16%, S o u th e rn A u s t r a l i a P e r p e t u a l F o r e s t s L td . 16%, and th e F o r e s t Commission o f V i c t o r i a 9%. The Woods and F o r e s t s p l a n t a t i o n s a r e p r i m a r i l y (90%) r a d i a t a p i n e , P in u s r a d i a t a (D .D o n ), and t h i s a r e a c u r r e n t l y p r o v id e s a b o u t 75% o f t h e raw m a t e r i a l su p p ly f o r th e r e g io n s i n t e g r a t e d wood b a s e d i n d u s t r i e s . The in d u s t r y in th e r e g io n i s f u l l y u t i l i z i n g th e p r e s e n t a llo w a b le c u t from th e r a d i a t a p in e p l a n t a t i o n s o f th e Woods and F o r e s ts D e p a rtm e n t. To e n a b le management t o make sound p o l i c y
T h is t h e s i s i s c o n c e rn e d w ith th e s h o r t te rm volum e and in c re m e n t p r e d i c t i o n te c h n iq u e s n e c e s s a r y to e n a b le s i l v i c u l t u r a l o p e r a t io n s t o be s c h e d u le d f o r a f i v e y e a r p la n n in g h o r iz o n .
M e tr i c a ti o n
A ll c a l c u l a t i o n s and r e s u l t s a r e r e p o r t e d in i m p e r ia l u n i t s . A ll th e d a t a u sed a r e c u r r e n t l y r e c o r d e d in i m p e r ia l u n i t s . M e tric c o n v e r s io n o f t h e s e d a t a f o r t h i s s tu d y was n o t u n d e r ta k e n , as c o n v e r s io n w ould o n ly b e p r a c t i c a l a f t e r a com puter b a s e d d a t a s t o r a g e and r e t r i e v a l sy ste m h a s b een d e s ig n e d and im plem ented^ t h a t w i l l in c lu d e a l l p erm an en t sam ple p l o t d a t a .
To f a c i l i t a t e a p p l i c a t i o n o f t h e r e s u l t s t o m e tr ic f i e l d d a t a w hich w i l l b e c o l l e c t e d in f u t u r e i n v e n to r y w o rk , th e m e tr ic e q u i v a l e n t s o f some o f th e more im p o r ta n t e q u a tio n s a r e r e p o r t e d b u t w ith th e a d d i t i o n o f s u b s c r i p t (m) t o th e e q u a tio n number t o show t h a t i t i s m e t r i c .
W ith in th e t e x t some o f th e more im p o r ta n t d e f i n i t i o n s and m easurem ents a r e c o n v e r te d to th e m e t r i c e q u i v a le n t
Notation
The more commonly used variables and parameters have been
abbreviated when used in the text and in equations. Definitions
of these have been summarised in Appendix 3. Abbreviations of
less common variables are defined below the relevant equations
in the text.
II. YIELD PREDICTION: PRACTICE AND PROBLEMS
CURRENT PRACTICE
Stratification
Permanent Sample plots
Inventory data
Short term yield prediction
I I . YIELD PREDICTION: PRACTICE AND PROBLEMS
CURRENT PRACTICE
The m e n s u r a t i o n and management p r a c t i c e i n S o u t h A u s t r a l i a h a s b e e n d e s c r i b e d b y L ew is ( 1 9 5 7 ) and R e e v e s ( 1 9 7 0 ) . However i t i s n e c e s s a r y t o r e i t e r a t e t h e m a j o r p o i n t s s o t h a t t h e
p r o b le m t o b e i n v e s t i g a t e d c a n b e s e t o u t c l e a r l y .
S t r a t i f i c a t i o n
I n S o u t h A u s t r a l i a i t h a s b e e n f o u n d t h a t s t r a t i f i c a t i o n o f t h e f o r e s t i n t o volum e p r o d u c t i v i t y c l a s s e s i s m ore e f f e c t i v e t h a n s t r a t i f i c a t i o n b a s e d s o l e l y on some c o n v e n i e n t m e a s u r e o f u p p e r s t a n d h e i g h t ( R e e v e s , 1 9 7 0 ) . T h i s h a s l e d t o t h e d e v e lo p m e n t o f a S i t e Q u a l i t y a s s e s s m e n t t e c h n i q u e , b a s e d cn t o t a l volum e p r o d u c t i o n t o a A i n c h t o p d i a m e t e r u n d e r b a r k a t a g e 9 h . T h i s t e c h n i q u e d e s c r i b e d b y L e w is i n 1954 a n d b y R e e v e s ( 1 9 7 0 ) p r o v i d e s a d e t a i l e d s t r a t i f i c a t i o n o f t h e f o r e s t t h a t c an b e u s e d a t t h e t i m e o f s u b s e q u e n t i n v e n t o r y .
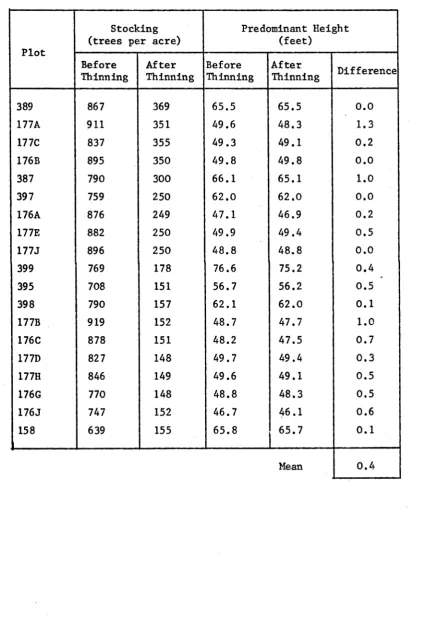
measured for predominant height and tree diameter, the height
to the base of the green crown being measured on 12 randomly
selected sample trees. From these measurements volume to a
four inch top diameter underbark is estimated through a predom
inant height tarif relationship. A number of useful indices
such as mean diameter, stocking, average height to the base of
the green crown, the range of tree diameters, basal area and
predominant height are also calculated.
These plots are inspected before assessment commences in
each area and this inspection ensures that the assessment is
consistent between assessors. Reference to the yield table
at age 9 h ensures consistency between widely separated areas,
and between plantations with different years of planting.
Assessment is by parallel strips 3 chains (60 m) apart,
with each assessor mapping V i chains (30 m) on either side of
his strip. A considerable amount of accessory information on
live stocking, mortality, initial planting spacing and the
proportion of ineffective trees is obtained from a systematic
3x5 chain (60x100 m) grid system of .05 acre (.02 ha) plots
superimposed on these strips.
Following the assessment, site quality maps are prepared
by joining the strip maps together and copies are provided for
the District Forester of each Forest Reserve and for Head Office.
Reports are also prepared giving for each area details of
o th e r in f o r m a tio n c o n s id e r e d r e l e v a n t . The s i t e q u a l i t y p la n s form th e b a s i s o f any s t r a t i f i c a t i o n f o r in v e n to r y p u r p o s e s .
P erm anent Sample P l o t s
The f i r s t f o r e s t in v e n to r y was made i n th e s o u t h - e a s t u n d e r th e d i r e c t i o n o f E .H .F . Swain in 1934. F o llo w in g t h i s work th e D epartm ent e s t a b l i s h e d and m a in ta in e d a s e r i e s o f perm an en t sam ple p l o t s w hich h ave b een g r a d u a l ly augm ented so t h a t a t p r e s e n t t h e r e a r e some 320 p l o t s in r a d i a t a p in e p l a n t a t i o n s in th e s o u t h - e a s t o f S outh A u s t r a l i a . The p l o t s h av e b e e n r e m easured a t v a r io u s i n t e r v a l s and p r o v id e a b a s i c p o o l o f d a ta u n p a r a l l e l e d i n A u s t r a l i a . The p rim a ry o b j e c t i v e o f th e s e p l o t s i s to d e te rm in e th e f o llo w in g in f o r m a tio n .
(1) The th i n n i n g tr e a tm e n ts t h a t w i l l p r o v id e a maximum s u s t a i n e d y i e l d o f tim b e r .
(2) The t h i n n i n g tr e a tm e n ts t h a t w i l l p r o v id e th e p ro d u c t mix in te rm s o f pulpwood and saw lo g s o f v a r io u s s i z e s and ty p e s t h a t i s d e s i r e d by th e i n t e g r a t e d i n d u s t r y in th e r e g io n .
(3) The t h i n n in g tr e a tm e n ts t h a t y i e l d th e h i g h e s t m o n e tary r e t u r n c o n s i s t e n t w ith (1 ) and (2) ab o v e.
o f th e R e g io n a l Volume T a b le (Lew is and M c I n ty r e , 1 9 6 3 ). The number o f t r e e s m easured i s d e te rm in e d from a g rap h d e r iv e d by K eeves (1961) w hich aim s t o k eep t h e c o n f id e n c e l i m i t s o f th e
e r r o r i n volum e due t o sam p lin g to w i t h i n 3%. Work by K eeves (1961) and J o l l y (1950) d e m o n s tra te d th e r e l a t i o n s h i p b etw een volum e and b a s a l a r e a o f t r e e s i n r a d i a t a p in e s ta n d s i n S outh A u s t r a l i a t o b e l i n e a r o v e r a w ide ra n g e o f c o n d i t i o n s , and i t i s th ro u g h th e u se o f t h i s r e l a t i o n s h i p t h a t s ta n d i n g p l o t
volum es a r e com puted. Lew is (1963) h a s u se d th e p erm an en t p l o t d a ta to d e v e lo p a f l e x i b l e th i n n in g g u id e , w h ich d e f i n e s th e ra n g e o f t h i n n in g t r e a tm e n ts w hich w i l l s a t i s f y t h e management o b j e c t i v e s o f th e Woods and F o r e s t s D e p a rtm e n t.
Lew is and K eeves h av e p r e p a r e d a y i e l d t a b l e , a s y e t u n p u b lis h e d , f o r th in n e d s ta n d s o f r a d i a t a p in e b a s e d on th e d a t a from th e p erm a n en t p l o t s show ing t h e a v e ra g e y i e l d s p e r a c r e in v a r io u s s i z e a s s o r tm e n t s , t h a t may b e e x p e c te d from th e th i n n in g s and c l e a r f a l l i n g g iv e n th e s i t e q u a l i t y and th e th i n n in g re g im e .
I n v e n to r y d a ta
In S outh A u s t r a l i a f i v e y e a r p la n s a r e p r e p a r e d p r e s c r i b i n g w here lo g g in g o p e r a t io n s a r e to b e c a r r i e d o u t , and th e r e s i d u a l
s to c k in g s to be m a in ta in e d a f t e r t h i n n i n g . T hese p la n s a r e p r e p a r e d by th e W orking P la n s B ranch a f t e r c o n s u l t a t i o n w ith th e f o r e s t e r s s t a t i o n e d on th e F o r e s t R e s e rv e . T hese p la n s a r e b a s e d on an in v e n to r y g e n e r a l l y c a r r i e d o u t i n t h e y e a r p r e c e d
W ith in eac h y e a r o f p l a n t i n g on a F o r e s t R e s e rv e t h e a r e a i s d i v i d e d i n t o a number o f l o g g i n g c l a s s e s . Each l o g g i n g c l a s s i s a group o f com partm ents o r s u b -c o m p a rtm e n ts t h a t h av e r e c e i v e d s i m i l a r s i l v i c u l t u r a l t h i n n i n g t r e a t m e n t i n t h e p a s t and w hich can r e c e i v e s i m i l a r t r e a t m e n t i n t h e f u t u r e . I t i s t h e r e f o r e a u n ifo rm a r e a f o r lo g g i n g p u r p o s e s b u t n o t n e c e s s a r i l y f o r y i e l d p r e d i c t i o n p u r p o s e s .
Logging c l a s s e s a v e r a g e a p p r o x i m a t e l y 65 a c r e s i n a r e a and a r e f u r t h e r s t r a t i f i e d by s i t e q u a l i t y and i f n e c e s s a r y by
s t o c k i n g . Randomly l o c a t e d o n e - f i f t h a c r e p l o t s a r e e s t a b l i s h e d such t h a t on th e a v e r a g e lo g g i n g c l a s s f i v e p l o t s a r e e s t a b l i s h e d , t h e number o f p l o t s i n each s t r a t a b e i n g p r o p o r t i o n a l t o t h e
a r e a o f each s t r a t a . U n p u b lis h e d work by Dundon (K eev es, 1970) i n d i c a t e s t h a t t h i s i s a minimum s a m p lin g i n t e n s i t y and e x t r a p l o t s a r e g e n e r a l l y e s t a b l i s h e d i n l o g g i n g c l a s s e s w i t h a w id e ran g e o f s t r a t a o r which a r e due to b e c l e a r f e l l e d .
T h is i n v e n t o r y i s c a r r i e d o u t i n a l l a r e a s due t o r e c e i v e a seco n d o r s u b s e q u e n t t h i n n i n g , o r w hich a r e due t o b e c l e a r f e l l e d d u r in g t h e f i v e y e a r Working P la n p e r i o d . Y i e l d s from a r e a s to be f i r s t t h i n n e d a r e e s t i m a t e d by i n t e r p o l a t i o n w i t h i n t h e u n p u b li s h e d t h i n n e d s t a n d y i e l d t a b l e p r e p a r e d by L ew is. No p l o t s a r e e s t a b l i s h e d i n t h e n .
F o r each p l o t a number o f b a s i c p a r a m e t e r s a r e e i t h e r measured o r d e r i v e d from r e c o r d s .
(2) E x t r a c t i o n row fr e q u e n c y ; th e r a t i o b etw ee n th e number o f e x t r a c t i o n rows removed from th e p l o t and th e number o f rows i n th e p l o t , in c lu d in g e x t r a c t i o n row s.
(3) Age; th e c u r r e n t y e a r of m easurem ent m inus t h e y e a r o f p l a n t a t i o n e s t a b l i s h m e n t .
(4) S i t e Q u a li ty ; d e r iv e d from t h e s i t e q u a l i t y a s s e s s m e n t c a r r i e d o u t a t age 9 ^ .
(5) P red o m in an t h e i g h t ; d e r iv e d from L e w is 's u n p u b lis h e d y i e l d t a b l e f o r a g iv e n age and s i t e q u a l i t y . I f t h i s does n o t a p p e a r t o b e c o r r e c t from f i e l d o b s e r v a ti o n th e n th e p re d o m in a n t h e i g h t i s e s ti m a t e d from t h e mean h e i g h t o f th e s i x l a r g e s t t r e e s on th e o n e - f i f t h a c r e p l o t u s in g an u n p u b lis h e d r e l a t i o n s h i p d e v e lo p e d by K eeves.
(6) D iam eter b r e a s t h e i g h t o v e r b a r k ; m easured on a l l t r e e s on th e p l o t .
The number o f t r e e s t o b e l e f t a f t e r th e n e x t t h i n n i n g i s th e n e s tim a te d from th e t h i n n i n g ra n g e o f Lew is (1963) and th e t r e e s to be removed a r e m arked on th e g ro u n d . The th i n n in g s e l e c t a r e s e l e c t e d on p r a c t i c a l s i l v i c u l t u r a l c o n s i d e r a t i o n s w hich may v a r y from l o c a l i t y t o l o c a l i t y a lth o u g h th e t h i n n in g
mark th e th i n n in g s e l e c t in th e in v e n to r y p l o t , and th e s t a f f who i n p r a c t i c e mark th e t r e e s t o b e removed in com m ercial
th i n n i n g , e n s u r e s t h a t th e y a r e c o n s i s t e n t one w ith th e o t h e r and w ith d e s i r e d p r a c t i c e .
S h o rt Term Y ie ld P r e d i c t i o n
From t h e s e d a t a th e volum e o f th e t h i n n i n g s t o b e removed i s e s tim a te d th ro u g h t h e volum e - b a s a l a r e a l i n e o f th e
th i n n i n g s . P red o m in an t h e i g h t , age and th e p e r c e n ta g e number o f t r e e s to be removed a r e th e in d e p e n d e n t v a r i a b l e s u sed to e s ti m a t e th e c o e f f i c i e n t s o f th e v o lu m e -b a s a l a r e a l i n e (K eev es, 197 0 ). An e x p r e s s io n o f t h i n n in g ty p e was t r i e d in th e
o r i g i n a l c a l c u l a t i o n o f th e r e g r e s s i o n s , b u t was found to b e n o t s i g n i f i c a n t , p r o b a b ly due to th e n a rro w ra n g e o f t h i n n i n g ty p e i n th e d a t a u s e d . F o r p l o t s t o b e c l e a r f e l l e d th e volume- b a s a l a r e a l i n e c o e f f i c i e n t s a r e r e l a t e d t o p re d o m in a n t h e i g h t
a lo n e .
S iz e a s s o r tm e n ts a r e e s tim a te d from u n p u b lis h e d t r e e s i z e a s s o r tm e n t t a b l e s w hich show th e p e r c e n ta g e o f th e volum e to f o u r in c h e s to p d ia m e te r t h a t i s w i t h i n v a r i o u s to p d ia m e te r l i m i t s , g iv e n th e tre e d ia m e te r a t b r e a s t h e i g h t . The r e l a t i o n s h ip was d e v e lo p e d by L ew is who found t h a t th e p e r c e n ta g e was in d e p e n d e n t o f th e t r e e h e i g h t .
the thinnings elect sub-population. As the stands may grow
from one to six years before they are felled it has been found
essential to incorporate an estimate of this increment in the
calculations.
In the case of stands due to be clear felled this increment
is estimated from the unpublished thinned stand yield table of
Lewis and Keeves. This approach cannot be used for the thin
nings elect sub-population because the thinnings elect will have a lower increment than the main crop, being predominantly
a thinning from below.
Leech has developed an unpublished increment function
which estimates the current annual increment percent for the
thinnings elect sub-population. This function uses predominant
height, thinning intensity and a measure of stand density, as
the independent variables. The function does not include a
measure of site potential and in fact assumes an average site
quality for each logging class. This leads to some anomalous
results which although of little consequence in the estimation
of the increment on the thinnings elect from a Forest Reserve,
should be investigated.
The calculations of volume and increment are incorporated
in a computer system which processes the inventory plot data
to the stage where a proposed list of logging operations is
prepared by logging classes, for each year of the Working Plan
DISCUSSION OF THE PROBLEM
The s t r e n g t h o f t h e S o u t h A u s t r a l i a n p r a c t i c e c u r r e n t l y l i e s i n t h e m a r k i n g on t h e g r o u n d o f t h e t r e e s t h a t a r e c o n s i d e r e d l i k e l y t o b e rem oved i n t h e n e x t t h i n n i n g . T h i s a v o i d s t h e n e c e s s i t y f o r a v e r a g i n g s t a n d s t o d e t e r m i n e an
a v e r a g e t h i n n i n g i n t e r v a l , t h i n n i n g t y p e a n d t h i n n i n g i n t e n s i t y and e n a b l e s t h e s t a n d t o b e t r e a t e d i n t h e m a n n e r w h ic h p a s t e x p e r i e n c e h a s shown t o b e t h e m o st e f f e c t i v e . E a c h s t a n d i s m arked f o r t h i n n i n g on i t s m e r i t s w i t h i n t h e f ra m e w o rk o f
L e w i s ' s t h i n n i n g r e g i m e ( 1 9 6 3 ) . By u s i n g t h i s r e g i m e a l l o w a n c e c a n b e made f o r c h a n g e s i n s t a n d c o n d i t i o n s b e t w e e n i n v e n t o r y and t h i n n i n g , a s t h e s t o c k i n g a f t e r t h i n n i n g i s d e t e r m i n e d fro m e s t i m a t e d p r e d o m i n a n t h e i g h t a t t i m e o f t h i n n i n g .
The t r e e s t o b e t h i n n e d , o r t h i n n i n g s e l e c t , h a v i n g b e e n i d e n t i f i e d i n d i v i d u a l l y , a r e t h e n a g g r e g a t e d w i t h i n t h e p l o t and w i t h i n t h e s t a n d t o p r o v i d e a n e s t i m a t e o f t h e s t a n d i n g volume o f t h e t r e e s t o b e t h i n n e d . The i n c r e m e n t on t h e s e t r e e s , b e tw e e n t i m e o f i n v e n t o r y a n d t i m e o f t h i n n i n g , m ust t h e n b e e s t i m a t e d s o t h a t an u n b i a s s e d e s t i m a t e o f t h e v o lum e o f t h i n n i n g s c an b e u s e d i n t h e c o m p i l a t i o n o f t h e f i v e y e a r p l a n .
be ignored if a high standard of management is to be attained
and maintained.
In an average five year Working Plan the volume currently
estimated as available from thinnings from the combination of
all the logging classes during the plan period is approximately
15% higher than the standing volume of these thinnings elect
at time of inventory, further emphasizing the need for an
accurate estimate of increment.
The aim of this thesis is to develop models for radiata
pine that will predict volume and short term increment on the
individual trees of the thinnings elect sub-population.
It is desirable that the increment model be redeveloped
along sound biological and statistical lines and that the increment model be developed along lines compatible with the
volume model (Clutter, 1963).
Only parameters currently available from inventory plot
measurements are to be used. The models should estimate tree
volume and tree increment so that later estimation of assortments
is facilitated, the estimates for the subpopulation of thinnings
III. STATISTICAL ANALYSIS
ASSUMPTIONS IN LEAST SQUARES LINEAR REGRESSION ANALYSIS
Homogeneity of the variance
Measurement error
Serial correlation
Normality of residuals
TECHNIQUE USED
Choice of the level of significance to be used
I I I . STATISTICAL ANALYSIS
The e s t i m a t i o n o f th e r e l a t i o n s h i p b etw ee n one v a r i a b l e and a num ber o f o th e r s i s a common p ro b le m i n f o r e s t r y t o w hich th e te c h n iq u e o f m u l t i p l e l i n e a r r e g r e s s i o n a n a l y s i s can b e a p p l ie d . L in e a r r e g r e s s i o n r e f e r s to t h e l i n e a r i t y o f th e c o e f f i c i e n t s o f th e in d e p e n d e n t v a r i a b l e s and c o n t r a s t s w ith n o n - l i n e a r r e g r e s s i o n a n a l y s i s in w hich th e c o e f f i c i e n t s to be e s tim a te d may b e th e pow er to w h ich a v a r i a b l e i s r a i s e d .
The a n a l y t i c a l te c h n iq u e s u s e d i n n o n - l i n e a r r e g r e s s i o n a n a l y s i s a r e s t i l l b e in g d e v e lo p e d and e v a l u a t e d and s t a t i s t i c a l
i n f e r e n c e i s s t i l l in a p r i m i t i v e s t a t e .
On th e o t h e r h and th e th e o r y u n d e r ly i n g l i n e a r r e g r e s s i o n a n a l y s i s i s w e l l e s t a b l i s h e d ( J o h n s to n , 1 9 6 0 ). F r e e s e (1964) c o n t a in s a c o n c is e dev elop m en t o f th e te c h n iq u e w ith s p e c i f i c r e f e r e n c e t o f o r e s t r y a p p l i c a t i o n s . J o h n s to n (1 9 6 0 ), A cton (1959) and S o k al and R o h lf (1969) c o n t a in a more g e n e r a l dev elo p m en t o f b o th th e th e o r y and th e a p p l i c a t i o n . B ecause n o n - l i n e a r te c h n iq u e s a r e n o t w e ll d e v e lo p e d i t was d e c id e d
to u s e l i n e a r r e g r e s s i o n a n a l y s i s i n t h i s s tu d y .
ASSUMPTIONS IN LEAST SQUARES LINEAR REGRESSION ANALYSIS
H om ogeneity o f th e v a r ia n c e
The v a r ia n c e o f th e r e s i d u a l o r e r r o r te rm o f th e r e g r e s s i o n i s assumed t o b e c o n s ta n t o v e r th e ra n g e o f th e r e g r e s s i o n d a t a and t h e r e f o r e in d e p e n d e n t o f th e m a g n itu d e o f t h e d e p e n d e n t o r in d e p e n d e n t v a r i a b l e s .
I f th e v a r ia n c e i s h e te r o g e n e o u s th e n th e e s t i m a t e s o f t h e c o e f f i c i e n t s i n th e r e g r e s s i o n w i l l be n o t a s p r e c i s e a s th e y w ould have b e e n i f th e v a r ia n c e was hom ogeneous. N e v e r th e le s s th e e s ti m a t e s w i l l s t i l l be u n b ia s s e d ( J o h n s to n , 1 9 6 0 ).
T h ere a r e t h r e e commonly u se d t e s t s o f h o m o g e n eity o f th e v a r i a n c e . In a l l t h e s e t e s t s th e d a t a i s p a r t i t i o n e d o v e r t h e ra n g e o f th e d ep en d e n t v a r i a b l e and th e v a r i a n c e o f t h e r e s i d u a l s w ith i n each o f t h e s e c e l l s i s c a l c u l a t e d . The s t a t i s t i c s u s e d
in th e t h r e e d i f f e r e n t t e s t s can th e n b e c a l c u l a t e d from th e c e l l v a r i a n c e s . H a r t l e y 's (1950) maximum F - r a t i o t e s t s th e r a t i o o f th e l a r g e s t c e l l v a r ia n c e to t h e s m a l l e s t c e l l v a r i a n c e . C ochrans t e s t (1941) u s e s th e r a t i o o f t h e l a r g e s t c e l l v a r i a n c e t o th e p o o le d v a r i a n c e s f o r a l l c e l l s . B oth t h e s e t e s t s a r e o n ly a p p l i c a b l e i f t h e number o f o b s e r v a ti o n s u se d t o com pute th e v a r ia n c e i s th e same f o r eac h c e l l . H ow ever, H a r tle y b e l i e v e s t h a t th e s e n s i t i v i t y o f th e t e s t i s n o t s e r i o u s l y d ep en d e n t on t h i s a ss u m p tio n and s u g g e s ts t h e u s e o f th e
f o r d e t a i l s ) w hich i s t e s t e d a g a i n s t th e s t a t i s t i c C h i- s q u a r e .
A cton (1959) c o n s id e r s t h a t no n e o f t h e s e t h r e e t e s t s a r e r o b u s t , a l l b e in g s e n s i t i v e to n o n - n o r m a lity i n th e u n d e r ly i n g d i s t r i b u t i o n s . However t h e r e a p p e a r s t o b e g e n e r a l a g re e m e n t (A c to n , 1959; S o k a l and R o h lf , 1969) t h a t B a r t l e t t ’ s t e s t i s th e m ost r o b u s t and m ost a p p r o p r i a t e o f t h e s e t e s t s f o r t e s t i n g f o r h o m o g en eity o f t h e v a r i a n c e .
I f B a r t l e t t ' s t e s t i n d i c a t e s t h a t th e v a r i a n c e i s n o t homogeneous th e n w e ig h tin g (C u n i^ 1964; F ra y e i; 1966; F r e e s e ,
1964) can b e u se d to e l i m i n a t e h e t e r o g e n e i t y o r r e d u c e i t t o a c c e p ta b l e l e v e l s . I n some c a s e s t h i s may a l s o b e a c h ie v e d by tr a n s f o r m in g t h e d e p e n d e n t v a r i a b l e .
G e rra rd (1966) p a r t i t i o n e d h i s t r e e d a t a i n t o c e l l s o f one in c h d ia m e te r and f i v e f e e t in h e i g h t , c a l c u l a t e d th e v a r ia n c e o f each c e l l and th e n e s ti m a t e d th e f u n c t i o n r e l a t i n g th e lo g a r ith m o f v a r ia n c e t o th e mean t r e e d ia m e te r and mean t r e e h e i g h t o f each c e l l . The w e ig h tin g f u n c t i o n u s e d was th e r e c i p r o c a l o f th e e x p e c te d v a lu e o f th e v a r i a n c e . H owever, C unia (1964) c o n s id e r e d t h a t p a r t i t i o n i n g th e d a t a on D2Ht was s a t i s f a c t o r y and found t h a t v a r i a n c e c o u ld b e s a t i s f a c t o r i l y e s tim a te d as a f u n c ti o n o f (D2H t) 2 .
model has been formulated the data is ordered according to the
expected value of the dependent variable, partitioned into
approximately equal cells and the variance of each cell tested
using Bartlett’s test (1937). If the weighting function is
adequate then Bartlett’s test should be non-significant. If
however the test indicates significant heterogeneity of the
variance, then a better weighting function should be estimated
and the cycle of operations continued until Bartlett’s test is
non-significant.
Measurement error
In linear regression analysis one of the assumptions that
must be met if efficient estimates are to be made of regression
coefficients and confidence limits is that the variables are
measured without error.
If the dependent variable is measured with error, but the
error is unbiassed, then the mean square residual will be
inflated resulting in a. reduced level of significance in the
analysis of variance. Provided that the regression explains
a large amount of the variation then this problem is relatively
minor.
The dependent variable, volume of the tree to four inches
top diameter underbark, includes errors caused by faulty use of
the girth tape and the bark guage and by technique errors
associated with the use of the ten foot sectional method. The
consistent in all data used in South Australia. Errors due to
the incorrect use of the girth tape are biassed but seem likely
to be less than the other errors associated with the measurement
of volume, which are generally unbiassed.
If the independent variables are measured with error then
there is little effect provided that they are unbiassed and
provided that the completed regression model will be applied to
data measured with the same source, frequency and degree of error
as the data used to develop the model.
The independent variables are, with the exception of errors
in diameter through faulty use of the girth tape, estimated
without bias. They are all consistent in that similar errors
are included in the basic data as are likely to be included in
the measurement of inventory plots. This is because the same
operators are responsible for both measurements, working to
essentially the same procedures.
The effect of measurement errors on this analysis can be
considered to be of little consequence.
Serial correlation
If correlation exists between the residuals when a regression
model is fitted to successive observations then serial correlation
or auto-correlation is said to exist. If serial correlation
exists then although the estimates of the regression coefficients
b e i n e f f i c i e n t and w i l l h ave n e e d l e s s l y l a r g e sa m p lin g v a r i a n c e s ( J o h n s to n , 196 0 ).
The volum e and in c re m e n t m odels d e v e lo p e d may be e x p e c te d t o s u f f e r from s e r i a l c o r r e l a t i o n b e c a u s e t h e r e a r e a num ber o f t r e e s ch o sen from eac h p l o t f o r eac h t h i n n i n g , and t h e s e t r e e s w i l l s h a r e th e same v a l u e s o f th e s ta n d p a r a m e te r s . To
f a c i l i t a t e th e t e s t i n g o f th e more im p o r ta n t m odels th e d a ta w ere a rr a n g e d in o r d e r .
F or th e volum e m odel a l l th e t r e e s from each th i n n i n g i n each p l o t w ere grouped t o g e t h e r .
F or th e in c re m e n t m o d e l, a l l th e t r e e s from eac h p l o t w ere grou ped t o g e t h e r . A lso a l l th e m easu rem en ts from th e same t r e e ( d i f f e r e n t num ber o f y e a r s b e f o r e t h i n n i n g ) w ere g ro u p ed to g e t h e r .
To t e s t w h e th e r s e r i a l c o r r e l a t i o n was a p ro b le m , th e D urbin-W atson Md" s t a t i s t i c (D u rbin and W atson , 1950, 1951; T h e i l and N a g a r, 1961) w as c a l c u l a t e d . B ecau se o f th e l a r g e number o f o b s e r v a tio n s th e "d " s t a t i s t i c o f T h e i l and N agar
(1961) u s in g th e Von Neumann r a t i o had t o b e u s e d .
and d e g r e e s o f freedom a r e a v a i l a b l e .
N o r m a lity o f r e s i d u a l s
I n l i n e a r r e g r e s s i o n a n a l y s i s t h e r e s i d u a l o r e r r o r te rm o f t h e r e g r e s s i o n i s assumed t o be n o r m a l l y d i s t r i b u t e d .
However i t i s r a r e t o f i n d i n t h e l i t e r a t u r e c o v e r i n g t h e
d e r i v a t i o n o f m a th e m a tic a l models o f f o r e s t g r o w th , s t a t i s t i c a l t e s t s u s e d t o p ro v e t h a t t h e r e s i d u a l s a r e n o r m a l l y d i s t r i b u t e d , a l th o u g h J o h n s t o n (1960) c o n s i d e r s s u ch a t e s t s h o u ld b e made. S o k al and R o h lf (1969) c o n s i d e r t h a t t h e c o n s e q u e n c e s o f n o n - n o r m a l i t y a r e n o t to o s e r i o u s . Only a v e r y skewed d i s t r i b u t i o n would have a marked e f f e c t on t h e s i g n i f i c a n c e l e v e l o f t h e a n a l y s i s o f v a r i a n c e , b u t S o k al and R o h lf r e c o g n i s e t h a t i t s h o u ld b e t e s t e d and c o r r e c t e d w here p o s s i b l e by s u i t a b l e
t r a n s f o r m a t i o n o f t h e d a t a .
Cochran and Cox (1957) s u g g e s t t h a t t h e n o r m a l i t y o f t h e r e s i d u a l s s h o u ld be t e s t e d by a C h i - s q u a r e t e s t , a l t h o u g h t h e y p o i n t o u t t h a t t h i s t e s t i s n o t s p e c i f i c and d o es n o t i n d i c a t e w h e th e r skew ness o r k u r t o s i s i s t h e p r o b le m . They and o t h e r s (S o k a l and R o h lf , 1969; S n ed eco r and C o c h ra n , 1967) d e s c r i b e t e c h n i q u e s f o r e s t i m a t i n g moment s t a t i s t i c s o f k u r t o s i s and sk ew n ess. These two s t a t i s t i c s a r e t h e n compared w i t h " t "
(two t a i l e d t e s t ) f o r i n f i n i t e d e g r e e s o f freed o m . The l a t t e r t e s t i s r e a d i l y a p p l i e d and as i t i n d i c a t e s t h e ty p e o f
TECHNIQUE USED
A co m puter program REX w r i t t e n by G rosenbaugh (1967) was u sed t o c a l c u l a t e th e l i n e a r r e g r e s s i o n s . T h is pro gram
i s e x tre m e ly f l e x i b l e and p ro d u c e s a l l n e c e s s a ry 7 s t a t i s t i c s t o e n a b le an a n a l y s i s o f v a r ia n c e t o b e c a l c u l a t e d . W eig hted r e g r e s s i o n s can b e c a l c u l a t e d and r e g r e s s i o n s can b e c o n d i tio n e d t o p a s s e i t h e r th ro u g h th e o r i g i n o r t h e mean. A c o r r e l a t i o n m a tr ix f o r a l l v a r i a b l e s u sed i n a m odel can a l s o be c a l c u l a t e d .
C hoice o f th e l e v e l o f s i g n i f i c a n c e to b e u sed
In c l a s s i c a l th e o r y o f s t a t i s t i c s i t i s d i f f i c u l t to d e r iv e q u a n t i t a t i v e l y t h e l e v e l o f s i g n i f i c a n c e t h a t sh o u ld b e u s e d in th e s t a t i s t i c a l t e s t s a s s o c i a t e d w ith m odel d e v e lo p m e n t. Two ty p e s o f e r r o r s m ust b e c o n s id e r e d . Type I e r r o r s a r e o c c u r i n g , when a t r u e n u l l h y p o th e s i s i s r e j e c t e d ; ty p e I I e r r o r s a r i s e when a f a l s e n u l l h y p o th e s i s i s a c c e p te d (S o k a l and R o h lf , 1969; D ixon and M assey, 1 9 5 7 ). I t i s d e s i r a b l e t h a t b o th ty p e I and ty p e I I e r r o r s s h o u ld b e re d u c e d to t h e minimum. H owever, s in c e r e d u c in g th e p r o b a b i l i t y o f a ty p e I e r r o r i n c r e a s e s t h e p r o b a b i l i t y o f a ty p e I I e r r o r i t i s more a p p r o p r i a t e to s t r i v e f o r a compromise b etw ee n each ty p e .
F or th e volum e m odel d ev elopm en t i t was e x p e c te d t h a t r e g r e s s i o n s w ould e x p l a i n a h ig h p r o p o r t i o n o f t h e v a r i a b i l i t y o f th e d a t a , e s p e c i a l l y a s t h e r e a r e 1418 o b s e r v a ti o n s from
F or th e in c re m e n t m odel d e v e lo p m e n t, a lth o u g h t h e r e w ere more o b s e r v a t i o n s , 3035, th e r e g r e s s i o n m odels w ere n o t c o n s id e r e d
l i k e l y t o e x p l a in a s h ig h a p r o p o r t i o n o f th e v a r i a t i o n as th e volum e m o d e ls. W hereas e r r o r s o f m easurem en t a r e s m a ll r e l a t i v e to volum e, th e y a r e l a r g e r e l a t i v e to in c r e m e n t. S e a s o n a l
f l u c t u a t i o n s i n grow th a r e a l s o l i k e l y to a f f e c t in c re m e n t more th a n volum e. B ecause o f t h i s a lo w e r s i g n i f i c a n c e l e v e l was more a p p l i c a b l e f o r t h e in c re m e n t m o d e l, t h e l e v e l s e l e c t e d b e in g p = .0 5 .
Summary
The p ro c e d u re a d o p te d can b e sum m arised a s f o ll o w s :
(1) F o rm u la te th e l i n e a r m odels t o b e t e s t e d .
(2) Examine th e v a r ia n c e o f th e d e p e n d e n t v a r i a b l e .
(3) I f n e c e s s a r y , d e v e lo p an e q u a tio n t o p r e d i c t v a r ia n c e and d e r iv e a w e ig h tin g f u n c t i o n .
(4) F i t th e m odels t o t h e d a t a , u s in g w e ig h ts i f n e c e s s a r y .
(5) E v a lu a te th e m od els c h o s in g th e m ost a c c e p ta b l e m odel on s t a t i s t i c a l and b i o l o g i c a l g ro u n d s .
(7) Test for normality of the residuals. If significant
non-normality then transform the dependent variable,
recalculate the regressions and retest.
(8) Test for serial correlation. If there is significant
serial correlation then fit the accepted model to a
reduced data base and re-evaluate. Repeat until serial
correlation is not significant.
(9) When all tests are satisfactorily completed test the
IV. STAND DENSITY INDICES
INTRODUCTION
NUMBER OF TREES AS AN INDEX OF DENSITY
REINEKES STAND DENSITY INDEX
The data
Growth
Mortality
A simple model of stand dynamics
Stand density index
OTHER INDICES USING NUMBER OF TREES AND DIAMETER
Basal area
Crown competition factor
Tree area ratio
INDICES USING NUMBER OF TREES AND HEIGHT
Harts Index
Hummels Height/Spacing ratio
INDICES USING NUMBER OF TREES, DIAMETER AND HEIGHT
Volume
Bole area
Schumacher and Coiles stocking percent
IV . STAND DENSITY INDICES
INTRODUCTION
" F o r e s t r y i s b e d e v i l l e d by a w ide ra n g e o f p a r a m e te r s o f d e n s i t y , th e o n ly common f e a t u r e among them b e in g t h e i r g e n e r a l i n e f f e c t i v e n e s s . " B a s k e r v i l l e (1962) i n n o t i n g t h i s f o c u s e s a t t e n t i o n on one o f th e p e r p le x in g p ro b lem s o f f o r e s t m en su ra t i o n and m anagem ent, f o r i f a m e a n in g fu l in d e x o f t h e l e v e l o f c o m p e titio n o r d e n s i t y o f th e s ta n d can b e e v o lv e d th e n i t i s l i k e l y to be a s i g n i f i c a n t v a r i a b l e in any m odel p r e d i c t i n g grow th o r y i e l d .
For a v a r i a b l e to b e in c lu d e d i n a h y p o th e s iz e d m odel i t - m ust be c a p a b le o f b e in g m easu red w ith some d e g re e o f a c c u r a c y . The c o n c e p t o f s ta n d d e n s i t y o r c o m p e titio n i s an a b s t r a c t q u a l i t y t h a t seems in c a p a b le o f p r e c i s e d e f i n i t i o n , so i t i s l o g i c a l t h a t a l l so c a l l e d m e asu re s o f d e n s i t y b e re g a r d e d sim p ly as i n d i c e s . A lth o u g h some i n d i c e s a r e c a p a b le o f p r e c i s e u n b ia s s e d m easurem ent th e y a r e o n ly a p ro x y f o r th e i n t a n g i b l e c o n c e p t r e f e r r e d t o a s s ta n d d e n s i t y .
d e n s i t y as th e d e n s i t y o f s to c k in g e x p r e s s e d in num ber o f t r e e s , b a s a l a r e a , volume o r o t h e r c r i t e r i a , on a p e r a c r e b a s i s , (S o c. A m .F o r., 1958; Em pire F o r e s t r y A s s o c i a t i o n , 1 9 5 3 ). C u r tin
(1968) p r e s e n t s a n o th e r d e f i n i t i o n i n w hich s ta n d d e n s i t y i s d e f in e d as th e a v e ra g e i n t e n s i t y o f c o m p e titio n w h ich i s o c c u r r in g b etw een i n d i v i d u a l t r e e s w i t h i n a s t a n d .
A ltho ugh i t seems u n l i k e l y t h a t a u n i v e r s a l and p r e c i s e d e f i n i t i o n o f s ta n d d e n s i t y w i l l e v e r b e a c h ie v e d t h e r e a r e some g e n e r a l r e q u ir e m e n ts t h a t a r e c o n s id e r e d d e s i r a b l e .
W hatever th e p rim e d e f e c t s th e in d e x s h o u ld be c l e a r , c o n s i s t e n t , o b j e c t i v e and e a s y to a p p ly ( B ic k f o r d , B ak er and W ilso n , 1 95 7 ). S p u rr (1952) c o n s id e r s t h a t i t s h o u ld n o t b e r e l a t e d t o age o r s i t e p r o d u c t i v i t y and t h i s t e s t h a s o f t e n b een u sed as one o f th e c r i t e r i a f o r e v a l u a t i n g th e e f f e c t i v e n e s s o f a s ta n d d e n s i t y in d e x . As n o te d b e f o r e , C u r tin (1968) c o n s id e r s t h a t th e prim e re q u ire m e n t o f a m easu re o f d e n s i t y i s t h a t i t s h o u ld e x p r e s s th e i n t e n s i t y o f c o m p e titio n . B a s k e r v i l l e (1962) s t a t e s t h a t " . . . any m e a n in g fu l m easu re o f d e n s i t y m ust a s s e s s s i z e and
number s im u lta n e o u s ly and r e l a t e t h i s t o a ra n g e w hich c o n s t i t u t e s f u l l occupancy f o r a g iv e n s i t e " , a p o i n t o f view t h a t i s a l s o h e ld by B aker (1 9 5 0 ).
The common i n d i c e s o f s ta n d d e n s i t y can b e c l a s s i f i e d a c c o r d in g t o th e v a r i a b l e s u sed i n t h e i r e s t i m a t i o n i n t o one o f f o u r c a t e g o r i e s ( C u r t i n , 1968; V e z in a , 1 9 6 4 ).
(1) Number o f T r e e s .
(2) Number o f T re e s and D ia m e te r.
(3 ) Number o f T re e s and H e ig h t.
(4 ) Number o f T r e e s , D iam eter and H e ig h t.
NUMBER OF TREES AS AN INDEX OF DENSITY
The s im p le s t in d e x o f s ta n d d e n s i t y i s num ber o f t r e e s p e r u n i t a r e a b u t i t s e f f e c t i v e n e s s i s l i m i t e d u n le s s mean d ia m e te r , h e i g h t o r age a r e h e ld c o n s ta n t and t h e r e f o r e by i n f e r e n c e , ta k e n i n t o a c c o u n t. The use o f th e s i n g l e p a r a m e te r number o f t r e e s was found by N elso n and B re n d e r (1963) t o b e to o i n e f f i c i e n t t o b e s e r i o u s l y c o n s id e r e d as an in d e x o f d e n s i t y . A lth o u g h ig n o r e d by most w o rk e rs i t i s th e s i m p l e s t in d e x to m easu re and s h o u ld be a t l e a s t t e s t e d .
REINEKE'S STAND DENSITY INDEX( l )
R ein ek e (1933) exam ined d a t a from evenaged s ta n d s o f f u l l d e n s i t y and c o n c lu d e d t h a t th e number o f t r e e s p e r a c r e N was a f u n c tio n o f th e q u a d r a t i c mean d ia m e te r , th e d ia m e te r
c o rre s p o n d in g to th e mean b a s a l a r e a p e r t r e e .
N = b Q Di b l ... E q u a tio n IV . 1
The c o n s ta n t s bo and b j i n e q u a t io n I V . 1 w ere e s ti m a t e d by r e g r e s s i o n a n a l y s i s f o llo w in g a lo g a r i t h m i c tr a n s f o r m a t i o n
to c o n v e rt th e e q u a tio n to a l i n e a r fo rm .
lo g (N) = lo g (b ) + b lo g (D .) ... E q u a tio n I V .2
10 10 0 1 10 1
The s lo p e c o e f f i c i e n t b^ a p p e a re d to b e c o n s ta n t ( - 1 .6 0 5 ) f o r 12 o f th e 14 s p e c ie s exam in ed .
R eineke u sed e q u a tio n I V .2 t o d e f i n e an in d e x o f s ta n d d e n s it y on th e assu m p tio n t h a t th e same s lo p e w ould h o ld f o r th e r e l a t i o n s h i p betw een th e lo g a r ith m s o f th e number o f stem s p e r a c r e (N^) and q u a d r a t i c mean d ia m e te r (D^) i n s ta n d s w hich had n o t re a c h e d f u l l d e n s i t y . The s ta n d d e n s i t y in d e x SDI was a r b i t r a r i l y d e f in e d as th e number o f t r e e s p e r a c r e in a s ta n d h a v in g a q u a d r a t i c mean d ia m e te r o f 1 0 .0 in c h e s w hich was o f e q u a l d e n s it y to th e s ta n d in q u e s t i o n . T h is l a t t e r f i g u r e red u ce d th e c o m p u ta tio n in v o lv e d i n c a l c u l a t i n g th e s ta n d d e n s it y in d e x w here lo g a r ith m s t o b a s e 10 w ere u s e d .
lo g (B) = lo g (N .) - b lo g (D .) + b ...E q u a tio n IV. 3
10 10 1 1 10 1 1
T h is e x p r e s s io n h a s b een u sed w id e ly to e s t i m a t e s ta n d d e n s i t y , o f te n u s in g th e same c o n s ta n t ( - 1 .6 0 5 ) w hich R ein ek e e s t a b l i s h e d f o r most o f th e s p e c ie s h e exam in ed .
In view o f th e u se o f t h i s in d e x i t i s s t r a n g e t h a t th e a s s u m p tio n s u n d e r ly in g t h e b i o l o g i c a l p r o c e s s e s in v o lv e d h av e l a r g e l y b een ig n o r e d . The in d e x s h o u ld t h e r e f o r e b e c r i t i c a l l y exam ined i n r e l a t i o n t o s ta n d dynam ics in p l a n t a t i o n s o f
r a d i a t a p in e .
The d a t a
In s e l e c t i n g s ta n d s w hich h ad r e a c h e d " f u l l d e n s i t y " , R ein ek e sim p ly p l o t t e d a l l th e a v a i l a b l e d a t a (m a in ly from te m p o rary p l o t s ) on d o u b le - lo g g rap h p a p e r and c o n f in e d h i s r e g r e s s io n a n a l y s i s t o th o s e p o i n t s w h ich f e l l on th e e x tre m e r i g h t o f th e s c a t t e r . T h is i s u n s a t i s f a c t o r y s i n c e t h e r e i s no g u a r a n te e t h a t th e p l o t s s e l e c t e d w ere u n if o r m ly o f th e same d e n s i t y .
C u r tin (1 9 6 8 ), in d e f i n i n g d e n s i t y a s t h e a v e ra g e i n t e n s i t y o f c o m p e titio n b etw een th e i n d i v i d u a l t r e e s in th e s t a n d , p o in te d o u t t h a t s u b s t a n t i a l n a t u r a l m o r t a l i t y p r o v id e d a c l e a r i n d i c a t i o n o f when a s ta n d h ad re a c h e d maximum d e n s i t y . A d m itte d ly ,
a c c o rd w ith th e c l i m a t e . N e v e r t h e l e s s , t h i s c o n c e p t o f maximum d e n s it y i s p ro b a b ly as u n ifo rm a c o n d i tio n as one can hope to a c h ie v e .
The e x i s t e n c e o f n a t u r a l m o r t a l i t y , h o w ev er, may n o t b e a s u f f i c i e n t c o n d i tio n t o i d e n t i f y s ta n d s w hich h av e re a c h e d maximum d e n s i t y . M o r t a l i t y can a r i s e from c a u s e s o t h e r th a n in t e n s e c o m p e titio n . T hese o t h e r c a u s e s , su ch a s i n s e c t and p a th o g e n a t t a c k , a r e o f t e n su p erim p o sed o n , o r i n t e r a c t w i t h , c l i m a t i c f l u c t u a t i o n s and th u s m o r t a l i t y can n e v e r p r o v id e a c o m p le te ly unam biguous c r i t e r i o n o f maximum d e n s i t y . N e v e r th e l e s s th e e x i s t e n c e o f s u b s t a n t i a l and c o n tin u in g m o r t a l i t y
p r o v id e s a r e a s o n a b ly c o n s i s t e n t and o b j e c t i v e means o f e n s u r in g t h a t s ta n d s have re a c h e d e q u i v a l e n t c o n d i t i o n s o f c o m p e titio n and d e n s i t y .
As n o te d in c h a p t e r I I t h e r e a r e some 320 p erm an en t sam ple p l o t s in r a d i a t a p in e p l a n t a t i o n s and among th e s e a r e a number o f u n th in n e d p l o t s t h a t p r o v id e an o p p o r tu n i ty to s e l e c t s ta n d s w hich have re a c h e d maximum d e n s i t y . To t h i s d a t a w ere added
d a ta from a number o f p l o t s t h a t a r e n o t p erm a n en t sam p le p l o t s , b u t w hich h av e b e e n l e f t u n th in n e d .
The d a t a shown i n f i g u r e I V . 1 h av e b e e n ch o sen to i l l u s t r a t e th e s e l e c t i o n o f th e s e o b s e r v a ti o n s w hich had re a c h e d maximum d e n s i t y .
0 %
1
0 5cr
H i/)
z
0 2 u
F I G U R E I V
w
0 H" z > ^ h <0
z
( j a j ' S D jk -a d <?>'z>3j>^ -j o -> ^ a \ix * n fs4 ^ ° ' £ o - ^
^
J
^
T
I
U
U
O
I
Q
^
°
i
G
o
“
l i k e P l o t 513 p r o v id e d some d i f f i c u l t y in d e c id in g w hich o f th e o b s e r v a tio n s r e p r e s e n t e d th e s t a r t o f maximum d e n s i t y by th e c r i t e r i o n o f s u b s t a n t i a l m o r t a l i t y . I n su ch c a s e s , w h ich w ere t y p i c a l o f t h e m a jo r it y o f t h e d a t a ex am in ed , a c o n s e r v a t iv e ap p ro ac h was a d o p te d and th e e a r l i e r o b s e r v a t i o n s w ere e x c lu d e d . F or a few p l o t s , such a s P l o t EP24C, t h e r e was much g r e a t e r u n c e r t a i n t y b u t a g a in a c o n s e r v a t iv e a p p ro a c h was a d o p te d in s e l e c t i n g o b s e r v a t i o n s .
Some 160 o b s e r v a ti o n s from 34 p l o t s w ere s e l e c t e d as c l e a r l y r e p r e s e n t i n g c o n d i tio n s o f maximum d e n s i t y . T hese d a t a w ere f u r t h e r c u l l e d by s e l e c t i n g o n ly t h e f i r s t and l a s t o b s e r v a ti o n s i n each p l o t . T hese m e a su re s re d u c e d th e
c o r r e l a t i o n b etw ee n s u c c e s s iv e m easu rem en ts and t h e s t a t i s t i c a l problem s w hich o th e r w is e a r i s e . The 59 o b s e r v a ti o n s in th e f i n a l s e t o f d a t a w ere u sed t o exam ine t h e e m p i r i c a l n a t u r e o f s ta n d dynam ics u n d e r c o n d i tio n s o f maximum d e n s i t y .
Growth
As many p r e v io u s s t u d i e s h av e show n, th e b a s a l a r e a p e r a c r e o f " f u l l y s to c k e d " s ta n d s i s a f u n c t i o n o f a g e , a lo n g w ith o th e r v a r i a b l e s . H o p e f u lly , th e d a t a u sed i n t h i s s tu d y a r e b a s e d on a more p r e c i s e and c o n s i s t e n t d e f i n i t i o n o f d e n s i t y
th a n th e h i g h l y s u b j e c t i v e d e f i n i t i o n s w hich c h a r a c t e r i z e d many o f th e s e s t u d i e s .
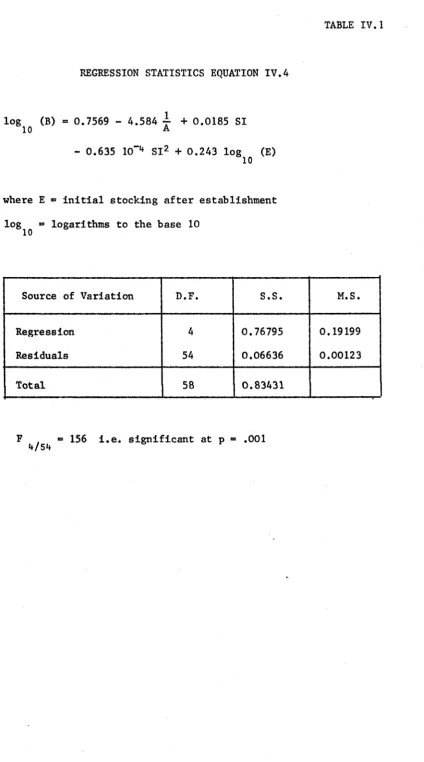
potential SI and initial stocking after establishment E,
(table IV.1).
log (B) = 0.7569 - 4.584 i + 0.0185 SI
10 A
- 0.635 10“4 SI2 + 0.243 log (E) .... Equation IV.4
10
The multiple coefficient of determination of 0.92 indicates
that the model is satisfactory. Several other models with
different curvilinear forms in SI were tested but equation IV.4
was significantly better. Basal area reaches a maximum
corresponding to a site index of 148 feet which is well above
the best site found in South Australian radiata pine plantations.
The Durbin-Watson "d" statistic was computed and the test was
inconclusive, but it seems likely that the effect of any serial
correlation would be small and would have little impact on the
estimated regression coefficients and their standard errors.
It is proposed to examine the data further using other
non-linear models and non-linear regression techniques.
However, this model is adequate to examine the dynamic aspects
of stand behaviour which underlie Reinekefs index.
Basal area per acre is related to the number of stems per
acre and quadratic mean diameter as in the indentity, equation
IV.5.
B s
'
Ni
V
576
log (B)
10
= log (N.) - 2.0 log (D.) + log( 7T /576)
10 i 10 i