R E S E A R C H A R T I C L E
Open Access
Supporting the implementation of stroke
quality-based procedures (QBPs): a mixed
methods evaluation to identify knowledge
translation activities, knowledge translation
interventions, and determinants of
implementation across Ontario
Julia E. Moore
1,7*, Christine Marquez
1, Kristen Dufresne
1, Charmalee Harris
1, Jamie Park
1, Radha Sayal
1,
Monika Kastner
1,2, Linda Kelloway
3, Sarah E. P. Munce
4, Mark Bayley
4, Matthew Meyer
5and Sharon E. Straus
1,6Abstract
Background:In 2013, Health Quality Ontario introduced stroke quality-based procedures (QBPs) to promote use of evidence-based practices for patients with stroke in Ontario hospitals. The study purpose was to: (a) describe the knowledge translation (KT) interventions used to support stroke QBP implementation, (b) assess differences in the planned and reported KT interventions by region, and (c) explore determinants perceived to have affected outcomes.
Methods:A mixed methods approach was used to evaluate: activities, KT interventions, and determinants of stroke QBP implementation. In Phase 1, a document review of regional stroke network work plans was conducted to capture the types of KT activities planned at aregionallevel; these were mapped to the knowledge to action framework. In Phase 2, we surveyed Ontario hospital staff to identify the KT interventions used to support QBP implementation at an organizationallevel. Phase 3 involved qualitative interviews with staff to elucidate deeper understanding of survey findings.
Results:Of the 446 activities identified in the document review, the most common were ‘dissemination’ (24.2%; n= 108), ‘implementation’ (22.6%; n= 101), ‘implementation planning’ (15.0%; n= 67), and ‘knowledge tools’(10.5%;n= 47). Based on survey data (n= 489), commonly reported KT interventions included: staff educational meetings (43.1%;n= 154), champions (41.5%;n= 148), and staff educational materials (40.6%;n= 145). Survey participants perceived stroke QBP implementation to be successful (median = 5/7; interquartile range = 4–6; range = 1–7;n= 335). Forty-four people (e.g., managers, senior leaders, regional stroke network representatives, and frontline staff) participated in interviews/focus groups. Perceived facilitators to QBP implementation included networks and collaborations with external organizations, leadership engagement, and hospital prioritization of stroke QBP. Perceived barriers included lack of funding, size of the hospital (i.e., too small), lack of resources (i.e., staff and time), and simultaneous implementation of other QBPs.
(Continued on next page)
* Correspondence:[email protected]
1
Li Ka Shing Knowledge Institute, St. Michael’s Hospital, 30 Bond Street, Toronto, ON M5B 1W8, Canada
7The Center for Implementation, 20 Northampton Dr, Toronto, ON M9B 4S6,
Canada
Full list of author information is available at the end of the article
(Continued from previous page)
Conclusions:Information on the types of activities and KT interventions used to support stroke QBP implementation and the key determinants influencing uptake of stroke QBPs can be used to inform future activities including the
development and evaluation of interventions to address barriers and leverage facilitators.
Keywords:Knowledge translation activities, Implementation, Stroke guidelines, Knowledge to action, KT interventions, Quality-based procedures, Mixed-methods evaluation
Background
In 2012, Ontario’s Action Plan for Health Care was
launched to transform how health care was delivered by ad-dressing the province’s demographic and fiscal challenges [1]. To support this plan, the Health System Funding Reform (HSFR) was introduced to change how hospitals were funded, with the goal of aligning health spending with quality and sustainability. A major component of the HSFR was the development of evidence-informed quality-based procedures (QBPs), which were identified using expert panels convened by Health Quality Ontario (HQO), and the ADAPTE guidelines adaptation approach [2, 3]. The goal of QBPs is to promote the use of evidence-based prac-tices within targeted clinical groups that require similar care, thereby standardizing care, improving quality, and re-ducing system inefficiencies. By the end of 2015, HQO had developed 20 QBPs, including a clinical handbook for each.
The current study focuses on the implementation of stroke QBPs, which are evidence-based guidelines for stroke. Stroke care costs the Ontario economy over $1.1 billion annually [4]. Stroke QBPs include best practices in early assessment procedures (e.g., using a standard-ized stroke scale), acute care (e.g., determining eligibility for treatment with intravenous tissue plasminogen acti-vator), and rehabilitation (e.g., receiving at least 3 h of direct task-specific therapy per day). It was anticipated that standardization of these procedures (i.e., implemen-tation of QBPs) would improve the quality of stroke care that an estimated 25,500 patients receive each year [4].
To effectively implement QBPs (i.e., evidence-based stroke guidelines) and produce desired best practices, changes at multiple levels in the health care system are re-quired including, clinician practice changes, organizational changes, and system/structural changes. In 2013, HQO provided hospitals with the Clinical Handbook for Stroke to support stroke guideline implementation [5]. The hand-book includes recommended groupings of patients defined by stroke severity, and clinical best practice recommenda-tions. The implementation of stroke QBPs was unique compared with other QBPs because it is supported by the Ontario Stroke Network (OSN). The province of Ontario consists of 14 Local Health Integration Networks (LHINs), which provide planning and support to regional health care organizations. The province’s stroke system has been sub-divided into 11 Regional Stroke Networks (RSNs). The
RSNs provides leadership, development, implementation, and integration of stroke care across the regions and along the continuum of stroke care. The OSN supports the RSNs and LHINs in measuring and reporting on performance, driving continuous improvement, partnering to achieve best practices, and creating innovations for stroke preven-tion, care, recovery, and reintegration. The OSN also serves as a hub for knowledge exchange and best practice imple-mentation. Unfortunately, even when evidence-based guidelines and knowledge tools are available, this does not necessarily result in a change in practice or outcomes. Knowledge translation (KT) provides guidance on how to support the implementation of guidelines in practice [6]. KT involves doing a series of process steps and using inter-ventions to change behavior [7]. Specifically, process models describe the iterative steps (i.e., KT activities) to use research in practice (see Table1); examples ofKT activities include conducting a needs assessment, assessing barriers and facilitators to evidence implementation, disseminating the handbook, and developing partnerships.KT
interven-tionsare the interventions (e.g., education, reminders, audit and feedback) used to change behaviour to align with the best practices (e.g., the stroke QBP). Selecting and delivering KT interventions are examples of KT activities. Research has been conducted on the barriers and facilita-tors to implementing stroke guidelines [8–10] and as well as the evaluation of the implementation of stroke guidelines
[11], but to our knowledge, no research has used KT
models and frameworks.
The purpose of this study was to understand the impact of stroke QBP implementation in hospitals across Ontario, including factors that may have affected successful imple-mentation. In particular, we aimed to describe the KT ac-tivities and KT interventions used to support stroke QBP implementation, to assess differences in the planned and reported KT interventions by region, and to explore the determinants perceived to have affected the success of implementation.
Methods
Design/approach
Table 1Definitions of KT activities [6] and KT interventions [8]
Definitions
KT Activities [6] KT activities are those used in the process of using research evidence (stroke recommendations) in practice such as conducting a needs assessment, assessing barriers and facilitators, disseminating the handbook and, developing partnerships.
Knowledge tools Refining knowledge for decision-making (e.g., clinical practice guidelines, decision aids, algorithms)
Identify problem/ identify, review, select knowledge
Identification of the knowledge-to-action gaps (knowledge needs) as a starting point of knowledge implementation. Involves rigorous methods and engagement with relevant stakeholders
Adapt knowledge to local context Adapting the knowledge to the local settings to make sure it is relevant and feasible (e.g., customizing clinical practice guideline for a particular organization)
Assess barriers/facilitators to knowledge use
Assessing areas that impede and facilitate the uptake of knowledge
Select, tailor, implement interventions -implementation planning
Plans to select and tailor interventions to the identified barriers and facilitators
Select, tailor, implement interventions -implementation
Selecting and tailoring interventions to the identified barriers and facilitators
Monitor knowledge use Defining what constitutes knowledge use so it can be measured (i.e., conceptual, instrumental, strategic)
Determining the extent to which the interventions have been successful in bringing about change
Evaluate outcomes Determining the impact of using the knowledge using explicit, rigorous methods
Sustain knowledge use Continued implementation of evidence over time, can include
assessing barriers to knowledge sustainability; tailoring interventions to these barriers; monitoring ongoing knowledge use; evaluating initial and sustained use
Other–dissemination The purposeful spreading or distribution of knowledge or research to a specific audience, such as is done in scientific journals and at scientific conferences.
Other–stakeholder engagement Actively engaging key stakeholders throughout the implementation process, and forming and sustaining positive and productive collaborations.
KT interventions [8] KT interventions are the interventions (e.g. education, reminders, audit and feedback) used to change behaviour to align with the best practices (e.g., the QBP).
Accreditation Process of review to demonstrate the ability to meet predetermined criteria and standards of accreditation established by a professional accrediting agency (e.g., Stroke Distinction)
Changes in physical structure, facilities, and equipment
A change of location of clinical work stations, inclusion of equipment where technology in question is used in a wide range of problems and is not disease specific
Changes in quality monitoring system Presence and organization of quality monitoring mechanisms
Changes in setting/site of delivery A change in care delivery location (e.g., moving a family planning service from a hospital to a school)
Skill mix changes Changes in numbers, types or qualifications of staff
Audit and feedback Any summary of clinical performance of health care over a specified period of time. The summary may also have included recommendations for clinical action. The information may have been obtained from medical records, computerized databases, or observations from patients
Champion/opinion leader Use of providers nominated by their colleagues as being influential in changing behaviour
Continuity of stroke care An intervention which includes one or many episodes of care for inpatients or outpatients. Continuity of care also includes arrangements for follow-up and case management, including co-ordination of assessment, treatment and arrangement for referrals
Educational meetings Participation in conferences, lectures, workshops or traineeships
Local consensus processes Inclusion of participating providers in discussion to ensure that they agreed that the chosen clinical problem was important and the approach to managing the problem was appropriate
Multidisciplinary teams Creation of a new team of health professionals of different disciplines or additions of new members to the team who work together to care for patients
Patient educational materials Distribution of published or printed recommendations for patients, including clinical practice guidelines, audio-visual materials and electronic publications.
action (KTA) framework was used to guide our under-standing of the types of KT activities and KT interventions that were planned. The KTA is a process model based on a systematic review of over 30 planned action theories that outlines the process involved in implementing evidence in
practice [6]. The Cochrane Effective Practice and
Organization of Care (EPOC) Group’s taxonomy of KT
interventions framework was used to evaluate QBP imple-mentation activities [12]. This taxonomy was used to categorize KT interventions; there are accompanying systematic reviews for the categories describing their ef-fectiveness at changing practice [13]. To guide our analysis and understanding of the determinants perceived to have influenced the success of stroke QBP implementation, we used the consolidated framework for implementation re-search (CFIR) and the theoretical domains framework (TDF). The TDF addresses individual level barriers and facilitators shown to influence behaviour; the CFIR inner and outer setting domains describe organizational level barriers [14,15].
In Phase 1, a review of RSN work plan documents was conducted to capture the types of KT activities and interventions planned at aregionallevel. In Phase 2, sur-vey data from hospital staff across the province were used to describe the KT interventions and resources
used to support QBP implementation at an individual
and organizationallevel. Survey data from Phase 2 were also used to gain a broad understanding of stakeholders’ perception of the success of stroke QBP implementation and the factors that may have affected implementation
outcomes at an individual and organizational level.
Phase 3 involved qualitative interviews and focus group sessions with staff to help elucidate deeper descriptions of survey findings. Data triangulation involved compa-ring the KT interventions described at anorganizational
level to those planned at a regional level (Phases 1 and 2), with Phase 3 interviews used to explore key findings.
Phase 1: Document review
Document review data abstraction
A document review was conducted on the regional work plans (i.e., work plans that summarize the actions to be taken to implement QBPs) from each of the 11 RSNs. The data abstraction template was piloted by three reviewers who independently used the template to review work
plans from one region selected at random; the reviewers then deliberated and refined the template based on usabil-ity of the template and emerging data. Data were then ab-stracted in duplicate by two members of the study team on the following categories: strategic priorities, objectives and goals, deliverables (planned or completed), deliverable target dates, notes on completion of deliverables, specific implementation site, and department. If the information was not available that element was left blank.
Each deliverable from the work plan was mapped to one of 12 KT activities (see Table1 for definitions). The KTA model was the basis for this mapping as it presents iterative stages used to move evidence into practice (knowledge synthesis; knowledge tools; identify prob-lem/identify, review, select knowledge; adapt knowledge to local context; assess barriers/facilitators to knowledge use; select, tailor, implement; monitor knowledge use; evaluate outcomes; and sustain knowledge use). Two KT activities not explicitly presented as KTA stages were
added: dissemination and stakeholder engagement.
Using an integrated KT approach, stakeholders are
engaged throughout the process [16]; dissemination
activities may be included in the “implement” stage or following the development of knowledge tools. Addition-ally, the “select, tailor, implement interventions” stage was split into two activities: implementation planning and implementation execution to differentiate between future and current activities. A second mapping activity was conducted on the “select, tailor, implement inter-ventions- implementation” stage of the KTA. These de-liverables were further sub-coded into categories of KT interventions based on the EPOC taxonomy [12].
Document review data analysis
All documents were independently coded by two coders. Any discrepancies were reconciled through deliberation until consensus was reached. The research team used de-scriptive statistics (i.e., counts and proportions) to analyze categorical data and conducted subgroup comparisons for descriptive analyses between regions, as appropriate.
Phase 2: Survey
Survey development
[image:4.595.56.539.101.179.2]The development of our survey was guided by the Checklist for reporting Results of Internet e-Surveys
Table 1Definitions of KT activities [6] and KT interventions [8](Continued)
Definitions
Revision of professional roles Also known as‘professional substitution’, specialist role’or‘boundary encroachment’, this includes the shifting of roles among health professionals and expansion of role to include new tasks. See also revision of professional roles–nursing and revision of professional roles–pharmacy intervention categories for specified nursing or pharmacy led care
(CHERRIES) [17]. Survey questions were developed in an iterative manner whereby the project team (i.e., KT Program research team and Project Working Group members from the OSN, HQO, RSNs and LHINs) en-sured that the items were aligned with the project objec-tives. Questions were piloted with 5 stakeholders representing OSN, HQO, and RSN to verify face validity, content sensibility (i.e., comprehensiveness and clarity), survey flow, and timing. After the survey was developed (see Additional file 1), it was translated into French and
distributed online in English and French using
FluidSurveys™.
Participants and recruitment
A purposive sampling strategy was used to identify a wide range of key stakeholders (i.e., LHIN members, stroke program managers, medical directors, hospital chief executive officers (CEOs), hospital chief financial officers (CFOs), organizational administration leads, other senior leaders and teams within hospitals, RSN members, and frontline clinicians and staff (i.e., nurses, physiotherapists, occupational therapists, pharmacists,
and speech-language pathologists)) across Ontario.
These stakeholders were identified based on input from the Project Working Group. Initial email invitations were sent to stakeholders from someone within their circle of contact (e.g., members of our working group, regional program managers, and senior leaders) along with a link to the online survey. To facilitate recruit-ment, a briefing note about the evaluation project and survey was distributed to stakeholders via email and during monthly stakeholder meetings. To optimize the survey response rate and the representation of different
stakeholder groups, Dillman’s reminder strategy was
used to send 3 follow-up email reminders to stake-holders at 1-, 3- and 7 week intervals after the initial
survey launch [18]. Data were collected between May
12, 2015 and July 31, 2015.
Survey data analysis
Analyses of quantitative survey data (e.g., Likert scale questions) were performed using SPSS version 22.0 to calculate descriptive statistics for all survey items (i.e., proportions for categorical items, means with standard deviations for continuous items, and medians with inter-quartile ranges for ordinal items). In order to consider the largest possible sample size for the analyses, we included all available data from complete and incomplete surveys. For this reason, the denominators vary by survey item and gradually declined toward the end of the survey. A chi-square test was used to compare the differences between participants who completed the survey and those who did not. Results demonstrated that there were no differences between participants who completed or did
not complete the survey by perceived organizational prior-ity or awareness of the handbook. French responses were translated and then merged with the English survey data for analysis. All text responses to open-ended survey items were exported from FluidSurveys™ for qualitative data analysis. This was performed manually whereby responses were grouped into categories using a content analysis approach [19]. Analysis was performed by one member of the study team (KD) and the final results reviewed for validity by a second member (CM).
Phase 3: Interviews and focus groups
Interview and focus group guide
The TDF and CFIR were used to develop
framework-informed interview and focus group questions aimed at eliciting data on behaviours, perceptions, and im-plementation context for stroke QBPs. Findings from the survey data (e.g., broader themes that emerged) also helped to inform the development of the interview guide (see Additional file 2). The guide was adapted for five stakeholder groups (i.e., LHIN, decision support team, clinical team, CEO/CFO, and administrative staff (i.e., ad-ministrative director, vice-president, chief of staff, and se-nior leadership)). An iterative approach to data collection was employed, whereby data from completed interviews were used to revise the guide to ensure it met study objectives.
Participants and recruitment
A sequential purposive quota sampling approach was employed whereby only participants from Phase 2 who indicated a desire to participate in Phase 3 were invited to participate [20, 21]. In consultation with the Project Working Group, an anonymized list of eligible Phase 3 participants (identified only by their professional roles) was reviewed and participants were purposively selected to cover a range of roles and regions across the province (e.g. LHIN region, hospital and hospital characteristics (QBP hospital size, stroke distinction, and presence of a stroke unit)). For convenience, regional program direc-tors and district stroke coordinadirec-tors (RSN staff ) were given the option of participating in focus group sessions prior to their monthly Advisory Meetings. Interviews and focus group sessions were conducted between September 2015 and February 2016.
Interview data collection and analysis
and were audio recorded and transcribed verbatim. We used a framework approach to analyze the data while focusing on specific areas of interest. Key steps to frame-work analysis include: familiarization of the data, identi-fication of a thematic framework, indexing, charting, and mapping and interpretation [22]. Two qualitative analysts (CM, RS) independently reviewed the tran-scripts to develop an initial coding framework, which was piloted on a small number of transcripts. The framework was then further refined and modified and applied to the remaining transcripts using a modified audit, consensus coding approach [23]. Initially tran-scripts were divided into groups and coded by two ana-lysts in sequential rounds using NVivo 10 [24]. At the end of each round, inter-rater reliability (IRR) between analysts was calculated using the Kappa coefficient and any discrepancies were discussed and resolved during consensus meetings. Once the number of discrepancies decreased (i.e., Kappa coefficients ≥0.6) the remaining transcripts were coded in further rounds by one analyst, and coding verified on one randomly selected transcript per round by the secondary analyst. IRR was calculated for the audit transcript and if any discrepancies arose, the analysts discussed and resolved themes until the Kappa coefficient was ≥0.6. Reporting of the data was guided by the consolidated criteria for reporting qualita-tive research (COREQ) [25].
Triangulation
The document review and surveys provide complementary information about the types of KT interventions used at a re-gional and organizational level. The document review data presented work plans specifically for eachregion, but did not provide data at an organizational level. The surveys were completed by members of the RSN, LHIN, clinical team, hospital leadership, decision support, and clinical team. Therefore, the surveys primarily capturedorganizational -le-vel data, but the information were aggregated by stroke re-gion to compare the OSN work plans to see whether the organizational activities reflected regional work plans. Inter-views and focus groups provided individuals’ views on the planning for and implementation of stroke QBPs and were used to explore implementation at the organization level more deeply. A multi-source (i.e., document review, surveys, interviews, and focus groups) mixed-method triangulation technique was applied to analyze the data. We used concur-rent data triangulation to seek convergence, inconsistency, or contradiction between two data sources, surveys and OSN work plans [26–28]. All data collected were combined and analyzed using a meta-matrix [29]. The use of a meta-matrix facilitated a strong visual anchor for pattern recognition and for confirming, elaborating, and identifying contradicting/dis-crepant views between data types within a single case and across all cases.
Ethics and consent
Ethical approval was obtained from St. Michael’s
Hospital Research Ethics Board (REB #15-.
062). Informed consent was obtained from all partici-pants prior to the survey and interviews/focus groups.
Results
Phase 1: Document review
Eight work plans were received (i.e., seven work plans from seven RSNs and one combined work plan from three RSNs), representing 10 of the 11 regional networks. Through data abstraction, we identified a total of 446 deliv-erables. Each deliverable was mapped to one of the 12 KT activities (see Table2). The number of deliverables in each work plan varied by region from 12 to 175, with a mean of 55.8 (standard deviation [SD] = 58.6). The most common deliverables were categorized as ‘other – dissemination’ (24.2%; n= 108),‘select, tailor, implement interventions –
implementation’ (22.6%; n= 101),‘select, tailor, implement interventions – implementation planning’ (15.0%; n= 67), or‘knowledge tools’(10.5%;n= 47). Few deliverables were identified for each of the following KT activities:‘assessing barriers/facilitators to knowledge use’(0%;n= 0),‘adapting knowledge to local context’(0.1%;n= 4),‘sustain knowledge use’(2.7%;n= 12), or‘evaluate outcomes’(3.1%;n= 14).
We categorized each deliverable from the ‘select,
tailor, implement interventions – implementation’ ac-tivity using the EPOC taxonomy for KT interventions (see Table 3).
Phase 2 and 3: Surveys, interviews, and focus groups
Participant demographics
Four hundred and eighty-nine staff members responded to the survey and were included in the analysis. Due to the sampling method, we were not able to collect an ac-curate response rate. We had representation from every
[image:7.595.59.539.98.295.2]LHIN, but not from every hospital within each LHIN. Among the respondents, 66 (13.5%) were from the se-nior leadership team, 22 (4.5%) were CEOs/CFOs, 38 (7.8%) were from the decision support team, 291 (59.5%) were from the clinical team, 49 (10.0%) were from the RSNs, and 23 (4.7%) were from LHINs. For this analysis
Table 2KT activities by region from work plans
KT activities OSN region # KT activities % of total (%)
A B C D E F G H
Knowledge tools 3 1 1 1 2 21 17 1 47 10.5%
Identify problem/ identify, review, select knowledge 0 0 1 0 1 14 3 1 20 4.5%
Adapt knowledge to local context 1 0 0 0 1 1 1 0 4 0.9%
Assess barriers/facilitators to knowledge use 0 0 0 0 0 0 0 0 0 0.0%
Select, tailor, implement interventions - implementation planning 6 3 1 3 10 12 29 3 67 15.0%
Select, tailor, implement interventions - implementation 8 2 6 5 5 28 30 17 101 22.6%
Monitor knowledge use 0 1 5 1 5 6 16 4 38 8.5%
Evaluate outcomes 3 0 0 0 1 3 7 0 14 3.1%
Sustain knowledge use 2 3 0 0 0 0 7 0 12 2.7%
Other–dissemination 16 3 0 1 2 23 55 8 108 24.2%
Other–stakeholder engagement 4 2 0 1 4 7 10 7 35 7.8%
TOTAL # deliverables per region 43 15 14 12 31 115 175 41 446 100.0%
e.g.,To preserve anonymity, each region has been assigned a letter
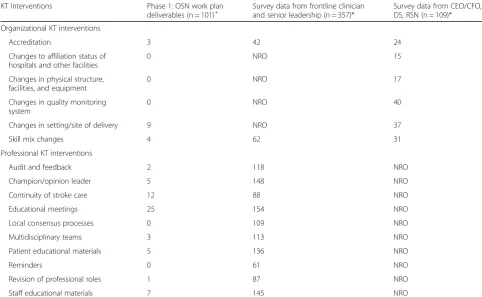
Table 3KT interventions
KT interventions Phase 1: OSN work plan deliverables (n = 101)+
Survey data from frontline clinician and senior leadership (n = 357)*
Survey data from CEO/CFO, DS, RSN (n = 109)*
Organizational KT interventions
Accreditation 3 42 24
Changes to affiliation status of hospitals and other facilities
0 NRO 15
Changes in physical structure, facilities, and equipment
0 NRO 17
Changes in quality monitoring system
0 NRO 40
Changes in setting/site of delivery 9 NRO 37
Skill mix changes 4 62 31
Professional KT interventions
Audit and feedback 2 118 NRO
Champion/opinion leader 5 148 NRO
Continuity of stroke care 12 88 NRO
Educational meetings 25 154 NRO
Local consensus processes 0 109 NRO
Multidisciplinary teams 3 113 NRO
Patient educational materials 5 136 NRO
Reminders 0 61 NRO
Revision of professional roles 1 87 NRO
Staff educational materials 7 145 NRO
NRO = not a response option;+
[image:7.595.56.539.414.711.2]focused at a regional/hospital level, responses at the
LHIN level were removed (n= 23). As participants
received different questions based on their role, the number of responses by question varied. There were a total of 44 interview/focus group participants; six LHIN representatives, one CFO, nine senior leadership mem-bers, two decision support memmem-bers, 17 clinical team members, and nine RSN members.
KT interventions
Based on their roles, respondents were asked about the types of KT interventions they were aware of in
their organization (see Table 3). The most common
KT interventions reported by frontline staff and
se-nior leadership team (n= 357) included: educational
meetings (43.1%; n= 154), presence of a leader to cham-pion improvements (41.5%; n= 148), and distribution of staff educational materials (40.6%; n= 145). Similar find-ings emerged from the interviews, for example a member from the senior leadership team cited:
“An interesting fact came up with some solutions of having some champions on the floor available to con-tinue meeting this QBP target for our patients, and we’ve actually improved getting to that on the quality, on the day needed, within the first twenty-four hours about sev-enty per cent of the time, which was a lot different than hitting and missing it about thirty per cent of the time.”
–Senior leadership 015.
At an organizational level, respondents (n= 109) re-ported making changes to the setting/site of service deliv-ery (e.g., moving a service from one location to another) (33.9%;n= 37); changes to the organization’s quality mon-itoring system (e.g., how decision support data is used for quality improvement) (36.7%; n= 40); changes to staff organization (e.g., relocation/restructuring of staff within organization) (28.4%; n= 31); changes in the physical structure, facilities, and equipment (15.6%; n= 17); Ac-creditation Canada’s Stroke Distinction program (22.0%;n = 24); and changes to affiliation status of hospitals and other facilities (13.8%;n= 15).
Resources developed for stroke QBP implementation and dissemination
As part of stroke QBP implementation and to support the dissemination of information about stroke care in the prov-ince, hospitals were provided access to three reports, the On-tario Stroke Report Card, the OnOn-tario Stroke Evaluation Report, and the QBP baseline report. Respondents were asked whether or not they had reviewed each of the reports. Less than half of respondents for this question (n= 467) re-ported reviewing the 2012/2013 Ontario Stroke Report Card (43.5%;n =203) and the 2014 Ontario Stroke Evaluation Re-port (37.9%; n = 177). Approximately 17.3% (n = 81) had reviewed the QBP baseline report, and 21.4% (n= 100) had
not reviewed any of the reports. During interviews, partici-pants provided further details regarding the report, such as:
“We created a scorecard, which is kind of like a report card, and we report every month, and we actually send that to the team. So, the team is able to monitor their own performance, and…that’s something we recently im-plemented a few months ago, and it’s still very fresh, and very new, but we’re trying to use that as a way to kind of measure, you know, what we’re doing on a monthly basis, and it helps us guide where our priority work is.” – Senior leadership 039.
Additionally, hospitals had access to several other resources to support stroke QBP implementation, for ex-ample clinical pathways and checklists. The majority of respondents for this question (n= 444) reported using at least one resource (63.1%; n= 280), specifically: order sets (56.1%;n =249), clinical pathways (52.9%;n =235),
protocols (38.1%; n = 169), process improvement
ap-proaches (32.2%; n = 143), medical directives (16.7%; n
=74), QBP checklists (15.8%; n = 70), and management
tools (15.8%; n = 70). Moreover, participants spoke of the importance of these resources during interviews and focus group sessions.
“We viewed, at the LHIN level, various order sets, be-cause of the different types of strokes: ischemia, hemorrhagic, and also the TIA, and the work that was being developed there was also brought in internally here in the organization, in order for us to modify our order sets to align with the stroke pathway. So, that’s what we did in order to get the unit ready in implementing the QBP, as well as the organization.”- Clinical Team 022.
Perceived level of success with stroke QBP implementation
Respondents perceived their organizations to be moder-ately successful (providing ratings from 4 to 6 on a scale from 1 to 7) in implementing the stroke QBPs by their responses to the survey question (median = 5; interquar-tile range = 4–6;n= 335, Likert 1 to 7) and feedback re-ceived during the interviews.
“I think we’ve been a hundred per cent successful on the parts that we’ve implemented. I think there’s still, you know, a lot of work to do to maintain 1) some parts that we haven’t, and 2) to maintain and sustainability of the stroke QBP, and keeping it to the forefront, but I envision after the end of this, if you do this for sustainability for the next five, or ten years it becomes inherent practice. We no longer call it a stroke QBP handbook. It’s just best practice.”- Senior leadership 015.
Perceived determinants influencing stroke QBP implementation
that were perceived to have influenced the effectiveness
of the implementation. Specifically, respondents
expressed that key facilitators in advancing the uptake of stroke QBPs were: ‘the implementation climate – rela-tive priority’,‘readiness for implementation – leadership engagement & available resources’and ‘cosmopolitanism (i.e., networks with external organizations)’. For example, respondents reported that stroke QBPs were seen as a priority in their organization (median = 6; interquartile range = 5–7; n= 458, Likert 1 to 7). Respondents also indicated the importance of engaging leaders and man-agers early on in the implementation and that this early commitment was beneficial in shaping the implementa-tion plan, and ensuring accountability within the organization. Furthermore, respondents said that it was valuable to have networks with well-established organi-zations such as the OSN and RSNs to leverage their existing structures and resources.
“We [the RSN] play a big support role…specifically, supporting business cases to drive forward quality-based procedures. For example, for integrated stroke units, and that’s not only within our own organization, but support-ing our partner community organizations, providsupport-ing them with information, with statistics, with all of those types of things, and we also drive collaboration across the continuum.” –RSN member 001.
Additionally, several respondents expressed that the LHIN’s involvement was key in information-sharing and fostering collaborations between stakeholders and other institutions. Respondents identified CFIR constructs di-rected to the individual level such as the‘knowledge and beliefs about the intervention’,‘self-efficacy’, and the TDF construct ‘skills’ as facilitators to implementation. Respondents reported that they that were aware of the rationale for stroke QBPs (median = 6; interquartile range = 6–7; n= 252), they recognized the benefits of stroke QBPs (median = 6; interquartile range = 6–7; n= 248),and that they had the skills to implement stroke QBPs (median = 6; interquartile range = 5–6;n= 249).
Barriers Perceived barriers to implementation at an organizational level included the CFIR construct and sub-construct ‘readiness for implementation - available resources’and the TDF domain ‘environmental context and resources’. Specifically, most respondents (62.9%;
n= 110) reported a lack of funding to fully implement stroke QBPs and 56.0% (n= 98) of respondents cited re-source implications for supporting multiple QBPs as a barrier. Furthermore, respondents perceived that they had not been adequately trained on how to carry out the recommended stroke QBPs (median = 4; interquartile range = 3–5;n= 239). The key barrier to implementation at an individual level was the CFIR construct ‘knowledge and beliefs about the intervention’. Several interview
respondents described their concerns about the funding formula associated with stroke QBPs, specifically, con-cerns over organizations that were not included as part of the HSFR model (i.e., where costs could not be extricated) and where funding was based on volumes, and not based on quality outcomes.
“I think for some hospitals they don’t necessarily have the resources to implement QBPs – and we certainly don’t either but I think that’s becoming difficult as you’re getting more and more of them [QBPs]. How do you find the resources to start to implement all this change simul-taneously?” –Senior leadership 013.
Triangulation
Triangulation of work plans and survey data indicated a mix of consistencies and inconsistencies in what was re-ported at the regional, organizational, and frontline level. At an organizational level, there were a similar number of frontline staff and leaders reporting the use of ac-creditation and skill mix changes at their hospitals. However, most regional work plans did not report on the use of accreditation and skill mix changes. A large proportion of the leaders reported in the survey that they made changes to their organization’s setting/site of delivery while this was underreported in the work plans. Major discrepancies occurred between frontline staff and RSN work plans where frontline staff reported frequent use of audit and feedback, champions, local consensus processes, and multidisciplinary teams, while these were infrequently mentioned in work plans.
There were some consistencies across work plans and survey responses from frontline staff; specifically, both frequently mentioned the use of KT interventions such
as continuity of care and educational meetings.
Additionally, both work plans and frontline staff rarely reported the use of reminders as KT interventions. The difference between reported use of patient and staff edu-cation materials between work plans and surveys is likely because most educational materials in the work plans were coded as “dissemination” activities in the KTA, so not mapped to the EPOC taxonomy.
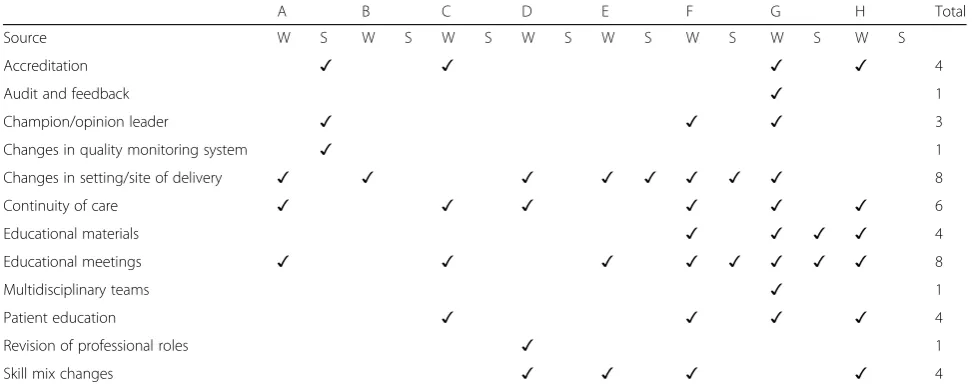
from surveys, there were five out of a possible 37 in-stances that they overlapped with KT interventions from three regions’work plans. The irregular overlaps indicate variability between frontline clinicianswithinregions. In instances when KT interventions did align, they included KT interventions such as ‘changes in setting/site of de-livery,‘educational materials’and‘educational meetings’.
Discussion
Overall, stroke QBP implementation in Ontario was per-ceived to be moderately successful (ratings of 4–6 on a scale from 1 to 7). A variety of KT interventions were used at the individual level with frontline clinicians to align their practice with QBP recommendations, at the
organizational level with senior leaders and QBP
imple-menters, and at a regional level through the LHINs,
OSN, and RSNs. Through this evaluation, a common theme has been the large variability between health care organizations and RSNs. For example, some organiza-tions focused almost exclusively on organizational-level changes, others on individual-level changes, and others on both. Noted barriers to implementation included lack of organizational readiness, and contextual issues such as lack of funding and training, limited knowledge of QBPs, and not believing in their value. Key facilitators were the relative priority of stroke QBPs, leadership en-gagement, and connections with other organizations and the OSN/RSNs.
Our findings are similar to other published studies on the implementation of stroke best practice guidelines and evidence-based care [9,30] in related settings. These stud-ies described practice changes implemented at either the
organizational or individual level. While findings from these studies showed improvements in patient outcomes,
the studies reported that implementing major practice changes in health care organizations is complex and changes need to occur at all levels across the system [31].
At a regional level, RSNs conducted a range of ac-tivities to support QBP implementation, providing hospitals with resources, leadership, and guidance throughout implementation. When KT activities were
mapped onto the KTA, we were able to identify ‘what
was implemented’. The most common activities
reported in work plans were ‘using dissemination
strategies’,‘KT interventions’, and ‘creating tools’ (e.g., sharing educational tools with clinicians across hospi-tals) indicating where efforts were focused. As such, most regions did not emphasize implementation but rather focused on dissemination. We were unable to categorize approximately 30% of the KT interventions due to insufficient detail. This finding underscores the importance of specifying KT interventions both from an operationalization perspective and from a research perspective to enable measurement and replicability. KT interventions targeted to clinicians were the pri-mary approach used to implement stroke QBPs. There was a general underreporting of KT interven-tions in work plans, indicating that work plans may have been further tailored by each organization and clinical leader. However, it may also indicate a lack of clarity or fit of the original work plans to the QBP imple-mentation process, which perhaps could have been
pre-vented by providing organizations with additional
[image:10.595.55.544.100.293.2]operationalized details onhowto implement QBPs. When comparing regional work plans to survey re-sponses within a region, there were large discrepancies between the regions and between the RSN team and frontline clinicians. Not surprisingly, no work plans were
Table 4KT interventions by regions
A B C D E F G H Total
Source W S W S W S W S W S W S W S W S
Accreditation ✓ ✓ ✓ ✓ 4
Audit and feedback ✓ 1
Champion/opinion leader ✓ ✓ ✓ 3
Changes in quality monitoring system ✓ 1
Changes in setting/site of delivery ✓ ✓ ✓ ✓ ✓ ✓ ✓ ✓ 8
Continuity of care ✓ ✓ ✓ ✓ ✓ ✓ 6
Educational materials ✓ ✓ ✓ ✓ 4
Educational meetings ✓ ✓ ✓ ✓ ✓ ✓ ✓ ✓ 8
Multidisciplinary teams ✓ 1
Patient education ✓ ✓ ✓ ✓ 4
Revision of professional roles ✓ 1
Skill mix changes ✓ ✓ ✓ ✓ 4
the same for any region, and the number of different types of KT interventions reported varied from one to nine, which could have impacted on how effectively and efficiently implementation was achieved. Additionally, of the 37 KT interventions identified in work plans, five were reported by both RSNs and clinicians. Though vari-ations could mean that a flexible and tailored approach was considered in implementing stroke QBPs, it is not clear what impact the tailoring had on implementation and outcomes.
A key stage in the KTA cycle that was underrepre-sented in regional work plans is assessing barriers and facilitators to change. Behaviour change is a complex process, further complicated when multiple people, organizations, and systems need to change. In order to effectively support behaviour change, it is imperative to
understand why people are/are not changing.
Conduct-ing a barriers and facilitators assessment is one way to accomplish this task, which can serve as the basis for selecting KT interventions that support behaviour change [31]. Alternatively, barriers and facilitators can be identified from existing studies [8–10] and prioritized for the local context; this process saves time and would allow the regions to focus on linking barriers and facili-tators to behaviour change theory to understand the mechanism of change that is likely to result in practice change. Once the barriers and facilitators are linked to behaviour change theory, appropriate dissemination and KT interventions can be selected that are based on
high-quality evidence and address the underlying
mechanisms of change [31]. For instance, several bar-riers and facilitators to stroke QBP implementation were identified in both the survey and interviews/focus group sessions. Key barriers were lack of resources (e.g., fund-ing and trainfund-ing) to properly implement stroke QBPs, simultaneous implementation of multiple QBPs, and knowledge and beliefs about the intervention. Key facili-tators were the presence of supportive networks, the perception that stroke QBP implementation was a priority among staff, the availability of certain resources, and leadership engagement. Leadership engagement may have been enhanced by linking QBP implementation to funding. Funding and leadership engagement are key facilitators to implementation [32,33].
A second gap from the KTA framework noted in the work plans was evidence of planning for sustainability. Sustainability is the continued delivery of KT interven-tions and the maintenance of stroke best practices and outcomes [34]. Since planning for sustainability is re-lated to actual sustainability [35], there is an opportunity to explicitly plan for the sustainability of the KT strat-egies and the QBP changes. Unfortunately there is very little guidance available on how to sustain the delivery of KT interventions, behavior change, and outcomes [36].
There are a number of measures and tools available and emerging research to show that the use of these that could support local sustainability efforts [37–39].
To support others implementing stroke guidelines, four recommendations were provided to increase the effective-ness of QBP implementation strategies: 1) assess barriers and facilitators to clinician, organization, and system changes; 2) use theory and evidence to drive implementa-tion and disseminaimplementa-tion strategy selecimplementa-tion; 3) maximize on economies of scale in tool development, develop centra-lized tools that can be adapted regionally and share re-gionally developed tools and allow for adaptation; and 4) plan for sustainability (see Additional file3for the ration-ale and considerations for each recommendation).
This study has several limitations. First, we were unable to determine survey response rate due to the sampling strategy. However, participants who responded represent the different LHINs and stakeholder groups. Second, we do not have data on outcomes from the QBP implementa-tion. Outcome data analysis is underway; in the future these results will be used in conjunction with those out-comes. Third, the interviews and survey responses may not be generalizable to all health care providers and leaders in Ontario. However, this was a relatively large sample size for both the survey and interviews/focus groups and the participant demographics are representa-tive of the target population.
Conclusion
Frontline clinicians, senior leaders, and RSNs are all work-ing to implement QBPs across the province of Ontario. We identified the types of activities and KT interventions used to support stroke QBP implementation and the key determinants that influenced their uptake. While there is some consistency across levels, there is also a large amount of variability. Additionally, there are gaps in some of the key steps or stages, such as assessing barriers and facilitators and planning for sustainability. These present opportunities to streamline future implementation efforts.
Additional files
Additional file 1:Phase 2 Master list of survey questions (PDF 265 kb)
Additional file 2:Phase 3 Interview Guide (PDF 465 kb)
Additional file 3:Recommendations for QBP Implementation Strategies (DOCX 30 kb)
Abbreviations
Acknowledgements
We would like to thank members of our project advisory group: Daniel Brouillard, Brian David Clark, Thomas Custers, Linda Dykes, Paula Gilmore, Sholom Glouberman, Ruth Hall, Deborah Hammons, Erik Hellsten, Cally Martin, Linda Nutbrown, Chris O’Callaghan, Susan Pilatzke; members of our research team: Julie Bain, Nadia Bashir; and patient representative: Alies Maybee for their contributions and support of our study.
Funding
The project was funded by the Ontario SPOR SUPPORT Unit and the Ontario Ministry of Health and Long-Term Care. SES is funded by a Tier 1 Canada Re-search Chair in Knowledge Translation. MK is funded by a Canadian Institutes of Health Research New Investigator Award. SM is/has been supported by a Heart and Stroke Foundation of Canada Focus on Stroke Fellowship, Toronto Rehabilitation Institute-University Health Network, Canadian Institutes of Health Research Fellowship, and a European Stroke Research Foundation In-vestigator Award.
Availability of data and materials
Due to confidentiality and challenges around de-identifying the data, the qualitative data cannot be shared.
Authors’contributions
JEM, MK, SES conceived the study. CM, KD, LK, SM, MB, MM provided input into the study design. CM, KD, CH, JP, RS completed the data collection and analysis. JM, CM drafted the manuscript. KD, CH, JP, RS, MK, LK, SM, MB, MM, SES provided input and revised the manuscript. All authors reviewed and approved the final manuscript. This manuscript represents the views of the named authors only, and not of their organizations or institutions.
Ethics approval and consent to participate
Ethical approval was obtained from St. Michael’s Hospital Research Ethics Board (REB#15–062). Informed consent was obtained from all participants. Survey participants provided consent by the voluntary completion and submission of the survey. Interview/focus group participants provided consent verbally which was documented by the facilitator.
Competing interests
The authors declare no competing interests.
Publisher’s Note
Springer Nature remains neutral with regard to jurisdictional claims in published maps and institutional affiliations.
Author details
1Li Ka Shing Knowledge Institute, St. Michael’s Hospital, 30 Bond Street,
Toronto, ON M5B 1W8, Canada.2North York General Hospital, 4001 Leslie St,
Toronto, ON M2K 1E1, Canada.3Cardiac Care Network of Ontario, 4100 Yonge Street, Toronto, ON M2P 2B5, Canada.4Toronto Rehabilitation
Institute, University Health Network, 550 University Avenue, Toronto, ON M5G 2A2, Canada.5Cardiac Care Network, Department of Epidemiology and
Biostatistics, Western University, 1151 Richmond St, Ontario, London N6A 5C1, Canada.6Department of Medicine, Faculty of Medicine, University of
Toronto, 1 King’s College Circle, Medical Sciences Building, Toronto, ON M5S 1A8, Canada.7The Center for Implementation, 20 Northampton Dr, Toronto,
ON M9B 4S6, Canada.
Received: 4 July 2017 Accepted: 22 May 2018
References
1. Ontario’s Action Plan For Health Care 2012.http://health.gov.on.ca/en/ms/ ecfa/healthy_change/docs/rep_healthychange.pdf. Accessed 18 Dec 2014. 2. Health Quality Ontario Evidence to Improve Care.http://www.hqontario.ca/
Evidence-to-Improve-Care/Evidence-and-Health-Quality-Ontario. Accessed 18 Dec 2014.
3. The ADAPTE Collaboration (2009). The ADAPTE Process: Resource Toolkit for Guideline Adaptation Version 2.0. https://www.g-i-n.net/document- store/working-groups-documents/adaptation/adapte-resource-toolkit-guideline-adaptation-2-0.pdf/view?searchterm=ADAPTE. Accessed 18 Dec 2014.
4. Stroke Stats and Facts 2016. https://www.corhealthontario.ca/data-&-reporting/stroke-report-cards. Accessed 18 Dec 2014.
5. Quality-based Procedures Clinical Handbook for Stroke Ministry of Health and Long-Term Care 2013.http://www.health.gov.on.ca/en/pro/programs/ ecfa/docs/qbp_stroke.pdf. Accessed 18 Dec 2014.
6. Graham ID, Logan J, Harrison MB, Straus SE, Tetroe J, Caswell W, et al. Lost in knowledge translation: time for a map? J Contin Educ Heal Prof. 2006;1: 13–24.https://doi.org/10.1002/chp.47.
7. Nilsen P. Making sense of implementation theories. models and frameworks Implement Sci. 2015;10(1):1–13.https://doi.org/10.1186/s13012-015-0242-0.
8. Donnellan C, Sweetman S, Shelley E. Implementing clinical guidelines in stroke: a qualitative study of perceived facilitators and barriers. Health Policy. 2013;111(3):234–44.https://doi.org/10.1016/j.healthpol.2013.04.002. 9. Bayley MT, Hurdowar A, Richards CL, Korner-Bitenssky N, Wood-Dauphinee
S, Eng JJ, et al. Barriers to implementation of stroke rehabilitation evidence: findings from a multi-site pilot project. Disabil Rehabil. 2012;34(19):1633–8.
https://doi.org/10.3109/09638288.2012.656790.
10. Munce SEP, Graham ID, Salbach NM, Jaglal SB, Richards CL, Eng JJ, et al. Perspectives of health care professionals on the facilitators and barriers to the implementation of a stroke rehabilitation guidelines cluster randomized controlled trial. BMC Health Serv Res 2017; 26;17(1):440.https://doi.org/10. 1186/s12913-017-2389-7.
11. Salbach N, Wood-Dauphinee S, Desrosiers J, Eng JJ, Graham ID, Jaglal SB, et al. Facilitated interprofessional implementation of a physical rehabilitation guideline for stroke in inpatient settings: process evaluation of a cluster randomized trial. Implement Sci. 2017;12:100.https://doi.org/10.1186/ s13012-017-0631-7.
12. Weir MC, Ryan R, Mayhew A, Worswick J, Santesso N, Lowe D, et al. The Rx for change database: a first-in-class tool for optimal prescribing and medicines use. Implement Sci. 2010;5(1):1–9.https://doi.org/10.1186/1748-5908-5-89.
13. CADTH. Rx for Change.https://www.cadth.ca/rx-change. Accessed 07 March 2016.
14. Cane J, O’Connor D, Michie S. Validation of the theoretical domains framework for use in behaviour change and implementation research. Implement Sci. 2012;7:37.https://doi.org/10.1186/1748-5908-7-37. 15. Damschroder LJ, Aron DC, Keith RE, Kirsh SR, Alexander JA, Lowery JC.
Fostering implementation of health services research findings into practice: a consolidated framework for advancing implementation science. Implement Sci. 2009;4:50.https://doi.org/10.1186/1748-5908-4-50. 16. Gagliardi AR, Berta W, Kothari A, Boyko J, Urquhart R. Integrated knowledge
translation (IKT) in health care: a scoping review. Implement Sci. 2016;11:38.
https://doi.org/10.1186/s13012-016-0399-1.
17. Eysenbach G. Improving the quality of web surveys: the checklist for reporting results of internet E-surveys (CHERRIES). J Med Internet Res. 2004; 6(3):e34.https://doi.org/10.2196/jmir.6.3.e34.
18. Dillman DA. Mail and telephone surveys. The total design method. In: Hoboken (NJ): john Wiley & sons; 1978.
19. Elo S, Kyngas H. The qualitative content analysis process. J Adv Nurs. 2008; 62(1):107–15.https://doi.org/10.1111/j.1365-2648.2007.04569.
20. Kemper EA, Stringfield S, Teddlie C. Mixed methods sampling strategies in social science research. In: Tashakkori A, Teddlie C, editors. Handbook of mixed methods in social and behavioral research. Thousand Oaks, CA: Sage Publications; 2003. p. 273–96.
21. Teddlie C, Yu F. Mixed methods sampling: a typology with examples. Journal of Mixed Methods Research. 2007;1(1):77–100.
22. Ritchie J, Lewis J, Nicholls CM, Ormston R. Qual Res practice: a guide for Soc Sci students and researchers. Thousand Oaks, CA: SAGE Publications Inc; 2013.
23. Schreier M. Qualitative content analysis. In: Flick U, editor. The SAGE Handbook of Qualitative Data Analysis. Thousand Oaks, CA: SAGE Publication Limited; 2014. p. 170–83.
24. NVivo qualitative data analysis Software. QSR international Pty ltd. Version. 2012:10.
25. Tong A, Sainsbury P, Craig J. Consolidated criteria for reporting qualitative research (COREQ): a 32-item checklist for interviews and focus groups. Int J Qual Health Care. 2007;19(6):349–57.https://doi.org/10.1093/intqhc/ mzm042.
26. Creswell JW. Qualitative inquiry and research design: choosing among five approaches: Sage; 2013.
28. Denzin NK, Lincoln YS. Introduction: The discipline and practice of Qual Res. In: Denzin NK, Lincoln YS, editors. The Sage handbook of Qual Res. 3rd ed. Thousand Oaks: Sage Publication; 2005.
29. Miles MB, Huberman AM, Saldana J. Qualitative data analysis: a methods sourcebook: SAGE publications, Incorporated; 2013.
30. Fulop NJ, Ramsay AI, Perry C, Boaden RJ, McKevitt C, Rudd AG, et al. Explaining outcomes in major system change: a qualitative study of implementing centralised acute stroke services in two large metropolitan regions in England. Implement Sci 2016; 3;11(1):80.https://doi.org/10.1186/ s13012-016-0445-z.
31. Michie S, van Stralen MM, West R. The behaviour change wheel: a new method for characterising and designing behaviour change interventions. Implement Sci. 2011;6:42.https://doi.org/10.1186/1748-5908-6-42. 32. Aarons GA, Sommerfeld DH, Willging CE. The soft underbelly of system
change: the role of leadership and organizational climate in turnover during statewide behavioral health reform. Psychol Serv 2011;8(4):269–281. 281.
https://doi.org/10.1037/a002619.
33. Chaudoir SR, Dugan AG, Barr CH. Measuring factors affecting implementation of health innovations: a systematic review of structural, organizational, provider, patient, and innovation level measures. Implement Sci. 2013;8:22.https://doi.org/10.1186/1748-5908-8-22.
34. Moore JE, Mascarenhas A, Bain J, Straus SE. Developing a comprehensive definition of sustainability. Implement Sci. 2017;12(1):110.https://doi.org/10. 1186/s13012-017-0637-1.
35. Shelton RC, Cooper BR, Stirman SW. The sustainability of evidence-based interventions and practices in public health and health care. Annu Rev Public Health. 2018;39:55–76. https://doi.org/10.1146/annurev-publhealth-040617-014731.
36. Proctor E, Luke D, Calhoun A, McMillen C, Brownson R, McCrary S, et al. Sustainability of evidence-based healthcare: research agenda,
methodological advances, and infrastructure support. Implement Sci. 2015 Jun 11;10:88.https://doi.org/10.1186/s13012-015-0274-5.
37. Maher L, Gustafson DH, Evans A. 2010.NHS sustainability model. NHS Inst. Innov. Improv., London. https://improvement.nhs.uk/resources/Sustainability-model-and-guide/. Accessed 7 Mar 2016.
38. Hodge LM, Turner KM, Sanders MR, Filus A. Sustained implementation support scale: validation of a measure of program characteristics and workplace functioning for sustained program implementation. J Behav Health Serv Res. 2017;44(3):442–64.https://doi.org/10.1007/s11414-016-9505-z.
![Table 1 Definitions of KT activities [6] and KT interventions [8]](https://thumb-us.123doks.com/thumbv2/123dok_us/8274486.281626/3.595.68.529.84.733/table-definitions-kt-activities-kt-interventions.webp)
![Table 1 Definitions of KT activities [6] and KT interventions [8] (Continued)](https://thumb-us.123doks.com/thumbv2/123dok_us/8274486.281626/4.595.56.539.101.179/table-definitions-kt-activities-kt-interventions-continued.webp)