RESEARCH ARTICLE
Factors associated with glycemic control
among adult patients with type 2 diabetes
mellitus: a cross-sectional survey in Ethiopia
Tefera Kassahun
1, Tesfahun Eshetie
2and Hailay Gesesew
3,4*Abstract
Background: Even though the prevalence of type 2 diabetes mellitus is swelling rapidly in Ethiopia, data regarding glycemic control, a key strategy for marked reduction of diabetes mellitus complications, is scant. We have assessed the status of glycemic control and its contributing factors among adult patients with type 2 diabetes mellitus. Methods: This was a facility based cross-sectional survey of 325 adults with type 2 diabetes mellitus attending in Jimma University Teaching Hospital, South west Ethiopia. Data from all the patients were collected between Febru-ary and April 2014. Glycemic level was assessed by using fasting blood glucose level, and ‘poor glycemic control’ was defined when fasting blood glucose level was above 130 mg/dL (7 mm/L). Analysis included both descriptive and inferential statistics, and SPSS version 20.0 was used for all analysis.
Results: 309 respondents were included in the survey. More than two-third (70.9 %) of the patients had poor blood glycemic control. Patients who were illiterate (AOR = 3.46, 95 % CI 1.01–11.91) and farmer (AOR = 2.47, 95 % CI 1.13–5.39) had high odds of poor glycemic control. In addition, taking combination of insulin and oral medication (AOR = 4.59, 95 % CI 1.05–20.14) and poor medication adherence (AOR = 5.08 95 % CI 2.02–12.79) associated statisti-cally with poor glycemic control.
Conclusion: Majority of patients had poor glycemic control. Patients with low level of education, being employed, on combinations of insulin and oral medication, and lower adherence to their medication were likely to have poor glycemic control. Education and awareness creation could be a cross cutting intervention for the significant factors. Keywords: Glycemic control, Fast blood glucose, Cross-sectional, Type 2 diabetic mellitus, Ethiopia
© 2016 Kassahun et al. This article is distributed under the terms of the Creative Commons Attribution 4.0 International License (http://creativecommons.org/licenses/by/4.0/), which permits unrestricted use, distribution, and reproduction in any medium, provided you give appropriate credit to the original author(s) and the source, provide a link to the Creative Commons license, and indicate if changes were made. The Creative Commons Public Domain Dedication waiver (http://creativecommons.org/ publicdomain/zero/1.0/) applies to the data made available in this article, unless otherwise stated.
Background
Diabetes mellitus (DM) [1] has been ravaging millions of people from all over the world. Globally, diabetes has killed 4.6 million people in 2013 alone [2]. More than 77 % of morbidity [3] and 88 % of mortality [4] due to DM occur in low- and middle-income countries. In Ethiopia, the prevalence of diabetes was 3.5 % in 2011 [5]. Type 2 diabetes mellitus (T2DM) is the most common form of DM, accounting for more than 90 % of cases [2]. Con-trol of diabetes is more than just taking medicine; other aspects of self-management such as self-monitoring of
blood glucose, dietary restrictions, regular foot care and ophthalmic examination have all been shown to mark-edly reduce the incidence and progression of diabetes complications [2]. Previous studies have reported that suboptimal glycemic control could cost diabetes patients more care requirement, associated health-care costs, and loom the complications [6, 7].
The prevalence of poor glycemic control is paramount. A study done in Malaysia [8], 2015 showed that 72 % of patients had poor glycemic control, and two third of DM patients in Ethiopia [9] also had poor control. Pre-vious studies assured that poor glycemic control cor-related with enlarged risk of visual impairment [10], enlarged risk of kidney failure [11], and enlarged risk of cardiovascular disease [12]. In addition, the possible
Open Access
*Correspondence: hailushepi@gmail.com
3 Department of Epidemiology, College of Health Sciences, Jimma University, Jimma, Ethiopia
reasons included lack of awareness, time constraint, lack of adequate human power, poor adherence, and most importantly lack of appropriate guidelines and diabe-tes education for both care givers and patients [9, 13]. Therefore, it is easy to understand that adequate glycemic control among T2DM patients prevents short-term com-plications, decrease the risk of long-term comcom-plications, and decrease health care resource use and costs [14–16]. This figure indicted the need to give an attention for gly-cemic control. The Healthy People 2020 aimed a 10 % reduction in the proportion of DM patients with poor glycemic control as a target [17].
But despite the swift growth of prevalence of T2DM in Ethiopia, data regarding glycemic control, the key strat-egy for marked reduction of acute and chronic complica-tions of DM, is scant. Such data are noteworthy for the overall diabetic health care delivery services. We have assessed the status of glycemic control and its contribut-ing factors among adult patients with T2DM.
Methods
Study design, settings and participants
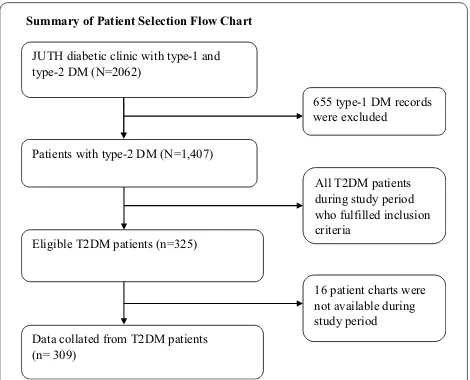
A facility based cross-sectional study was carried out in diabetic clinic at Jimma University Teaching Hospital (JUTH), Southwest Ethiopia from February 14 to April 9, 2014. The hospital serves the rural, urban and semi-urban areas. Drug Administration and Control Authority of Ethiopia Contents [18], a guideline similar with Inter-national Diabetes Federation clinical guideline [3] were followed for diagnosis and classification of DM. The study was conducted among T2DM adult patients (≥18 years) who were on active follow up for at least four visits. The required sample size was calculated via OpenEpi soft-ware using single population proportion calculation for-mula using the following assumptions: 58.2 % prevalence rate of poor glycemic control [19], 95 % confidence level, 5 % margin of error and 10 % non-response rate. Consid-ering a correction formula, the total calculated sample yielded 325. Using sampling frame of DM records, simple random sampling technique was used to recruit the study participants (Fig. 1).
Variables of the study and measurement
Glycemic level was the response variable that was coded as poor or good. Poor glycemic control was operationally defined if fasting blood glucose (FBG) level was above 130 mg/dl. Patients FBG reading for at least 4 months were recorded and computed the mean blood glucose level [20]. The explanatory variables included: socio-demographic and economic data (age, sex, level of edu-cation, marital status, occupation, income, ethnicity and religion), history of smoking, history of alcohol con-sumption, family history of DM, medication adherence,
duration of therapy, body mass index (BMI) and number of diabetic medication.
Level of education was classified as illiterate (could not read and write their local language—‘Afan Oromo’ or ‘Amharic’), literate (could read and write but received no formal education), primary (received education up to class eight), secondary (received education class 9–12), and college/university (joined college or university). His-tory of smoking and hisHis-tory of alcohol consumption has been assessed as during lifetime. Family history of DM was measured if any family member (mother or father) had DM. Morisky adherence score [21], eight-item yes/ no questionnaire, was used to assess the self-reported measures of adherence to medications. For all ques-tions, responses were coded 1 if patients responded ‘yes’ otherwise 0 if not, except one question that was coded reverse. The total score of adherence was classified into low adherence if the score was >2, medium adherence if between 1 and 2, and high adherence if 0.
Demographic and clinical characteristics were assessed via face-to-face interview and the average glycemic levels were reviewed from their chart. To ensure quality of data, the tool was developed in English, translated to local lan-guage (Amharic and Afan-Oromo) and back translated into English to check its consistency.
Statistical analysis
Descriptive statistics included mean, median, stand-ard deviations, and range values for continuous data; percentage and frequency tables for categorical data. Bivariate logistic regression analysis was conducted to see the existence of crude association and select candi-date variables (with P value below 0.25 were considered)
Summary of Patient Selection Flow Chart
JUTH diabetic clinic with type-1 and type-2 DM (N=2062)
Patients with type-2 DM (N=1,407)
Eligible T2DM patients (n=325)
Data collated from T2DM patients (n= 309)
655 type-1 DM records were excluded
All T2DM patients during study period who fulfilled inclusion criteria
16 patient charts were not available during study period
[image:2.595.305.540.89.279.2]to multivariable logistic regression. We checked multi-collinearity among selected independent variables via variance inflation factor (VIF) and none was found. P
value ≤0.05 was considered as a cut point for statistical significance in the final model. Fitness of goodness of the final model was checked by Hosmer and Lemeshow and was found fit. The Data was summarized using odds ratio (OR) and 95 % confidence interval. The analysis was done in Statistical Package for the Social Sciences (SPSS) 20 version software [22].
Ethical considerations
Informed consent was obtained from study participants before the commencement of each interview, and no personal identification was registered. There was no any financial compensation or provision for the study partici-pants. Permission was obtained from JUSH and the study was approved by institutional review board (IRB) of col-lege of health sciences at Jimma University, Southwest Ethiopia.
Results
Socio‑demographic and clinical characteristics of respondents
Three hundred and twenty-five DM patients were con-sidered eligible, whereof 16 were excluded since their chart were not available (Fig. 1). In total, 309 patients included in the analysis making 95 % response rate. Table 1 shows demographic and economic characteristics of the respondents. Males were over-represented (61.8 %) and almost two-fifth (36.9 %) of the respondents repre-sented the age group 51–60 years. Nearly half (46.6 %) of the respondents followed Muslim religion and four out of five (81.2 %) respondents were married. Two fifth (36.2 %) respondents attained grades (1–8), and 30.4 % of respondents were farmers.
Table 2 shows clinical characteristics of the respond-ents. Mean BMI of the respondents was 24.4(±4.39) kg/ m2, and 33 % of the respondents had overweight. Great
majority of the respondents had not access for self-moni-toring blood glucose (SMBG). About half of the respond-ents had not get social support, and one fourth (24.6 %) of the respondents had family history of DM. The preva-lence of smoking and alcohol, respectively, was 3 and 5 %. DM patients were followed for an average of 7.2 (±5.8) years with a minimum of 4 months and a maximum of 40 years. Diabetic neuropathy was the most common DM complication accounting for 41.5 %. Regarding dia-betic medications, 63.1 % of respondents were taking oral medication only followed by insulin (25.6 %). The respondents took a mean of 3.66 (±1.60) medications ranged between 1 and 7 medications.
Glycemic control level and its contributing factors among T2DM patients
Poor glycemic control was seen in 219 (70.9 %) respond-ents. Age, sex, education, occupation, BMI, anti-diabet-ics, number of medications and adherence to medication were the candidate variables for multiple logistic regres-sion. The following factors were statistically significant in bivariate logistic analysis: being illiterate, being achieved grades 1–8, being employed, being farmer, being under weight, taking combinations of insulin and oral medica-tion, taking 2–4 drugs and >4 drugs, medium medication adherence and low medication adherence. In multiple logistic regression, statistically significant difference was found in poor glycemic control to education, occupation, anti-diabetics and level of medication adherence.
Table 3 presents the multiple logistic regression analysis with demographic and clinical characteristics, and poor glycemic control. The association of poor glycemic control among illiterate respondents was three times (AOR = 3.46,
95 % CI 1.01–11.92) greater than among those who were in college/university. The relative probability of poor glyce-mic control among farmers was higher than (AOR = 2.47,
95 % CI 1.14–5.39) unemployed ones. Compared to respondents who took oral medication, respondents who took combinations of insulin and oral medication were five times (AOR = 4.59, 95 % CI 1.05–20.14) more
likely to have poor glycemic control. On the other hand, the odds of poor glycemic control among patients who had medium and low adherence to their medication were three (AOR = 3.49, 95 % CI 1.72–7.09) and five times
(AOR = 5.08, 95 % CI 2.02–12.79) more than patients who
had high adherence to their medication respectively.
Discussion
Significant difference of poor glycemic control was observed among illiterates than college/university gradu-ates. Consistent with this, studies from Jordan [27] and China [28] reported the correlation of lower level of education and poor glycemic control. This could indi-cate illiterate patients had low diabetes knowledge, low self-management behaviors, lower self-efficacy and lower continuity of care. Thus, we are recommending investment on getting rid of illiteracy as it has a signifi-cant impact on the reduction of diabetic morbidity and mortality [29, 30]. Poor glycemic control appeared to be greater among farmers compared to unemployed
respondents. This, however, might be due to allocating less time for self-management. Majority of the farmers in this study were also illiterate compared to unemployed respondents implying that farmers might have poor awareness of self-care of DM.
It was also likely that the difference in glycemic control might result from differences in anti-diabetic treatment. Compared to respondents on oral medication, respond-ents who were on combinations of insulin and oral medi-cation were five times more likely to have poor glycemic control. This association was corroborated by study done in Malaysia [31]. The poor control among patients receiv-ing a combination of insulin and oral anti-diabetic drugs shows that multi therapy might challenge satisfactory glycemic control. There was a strong inverse associa-tion between adherence level and poor glycemic control as supported by the previous studies [32]. Showing very poor outcomes among respondents who fail to comply with the prescribed clinical regimen is not surprising
Table 1 Socio-demographic characteristics of T2DM patients on follow up at JUTH, 2014
a Tigre, Wolayita b Catholic, Jehovah witness
Socio‑demographic
characteristics (n = 309) Categories n (%)
Sex Male 189 (61.8)
Female 120 (38.2)
Age 18–32 5 (1.6)
33–41 30 (9.7)
42–50 72 (23.3)
51–60 114 (36.9)
≥61 88 (28.5)
Marital status Married 251 (81.2)
Single 9 (2.9)
Divorce 12 (3.9) Widow/er 37 (12.0)
Ethnicity Oromo 170 (55.1)
Amhara 78 (25.2)
Keficho 21 (6.8)
Gurage 10 (3.2)
Dawero 8 (2.6)
Yem 8 (2.6)
Othera 14 (4.5)
Educational level Illiterate 87 (28.2) Read & write 22 (7.1)
1–8 112 (36.2)
9–12 44 (14.3)
College/University 44 (14.2) Religion of respondents Muslim 144 (46.6) Orthodox 138 (44.7) Protestant 23 (7.4) Othersb 4 (1.3)
Occupation Farmer 94 (30.4)
No job 78 (25.2)
Employed 72 (23.3) Merchant 29 (9.4) Daily labor 36 (11.7)
Table 2 Clinical characteristics of T2DM patients on follow up at JUTH, 2014
Clinical characteristics (n = 309) Category n (%)
Body mass index Under weight 17 (5.5) Normal weight 161 (52.1) Over weight 102 (33.0)
Obese 29 (9.4)
Family/social support Yes 175 (56.6)
No 134 (43.4)
Family history Yes 76 (24.6)
No 233 (75.4)
Habit of smoking Smoker 9 (2.9)
Non-smoker 287 (92.9) Ex-smoker 13 (4.2) Alcohol drinking Non-drinker 293 (94.8)
Drinker 16 (5.2) Access for self-monitoring blood
glucose YesNo 279 (90.3)30 (9.7) Duration of treatment <5 145 (46.9)
5–10 105 (33.9)
[image:4.595.296.536.115.479.2] [image:4.595.55.297.115.531.2][33]. Accordingly, counseling and improving adherence rather than changing medication or altering the dose has been suggested [33]. It is plausible to have an endeavor to tackle non-adherence by designing strategies encom-passing cost, health belief, dosing frequency, personality disorders and patient provider relationship.
Worth noting limitations should have noted in this study. The use of FBS over HbA1c my under estimate the prevalence of poor glycemic control even though FBS was found more reliable than HbA1c [34]. The institu-tional based nature of the study might not infer for other diabetic patients. The nature of cross-sectional study design does not show temporal relationship or causality. Recall bias might also be there during measuring self-report of medication to adherence.
Conclusion
In summary, the findings from the current study agree in many points with the findings of previous publications. Significant number of DM patients did not achieve the recommended glucose level. This was affected by educa-tion, occupaeduca-tion, anti-diabetic treatment and adherence status of the patients. Education and awareness crea-tion could be a cross cutting intervencrea-tion for the signifi-cant factors. We recommend further population based research.
Abbreviations
BMI: body mass index; DM: diabetes mellitus; FBG: fasting blood glucose; HbA1c: glycosylated hemoglobin; IDFA: International Diabetes Federation Atlas; JUSH: Jimma University Specialized Hospital; OHA: oral hypoglycemic agent; SMBG: self-monitoring blood glucose; SDSCA: summary of diabetes self-care activities; T2DM: type-2 diabetes mellitus.
Authors’ contributions
TK involved in designing of the study, data collection, data analysis, drafting and critically reviewing the manuscript. Likewise, TE and HG involved in designing of the study, analysis of the data and critically reviewing the manu-script. All authors read and approved the final manumanu-script.
Author details
1 Dilchora Hospital, Dire Dawa, East Ethiopia. 2 Department of Clinical Phar-macy, College of Health Sciences, Jimma University, Jimma, Ethiopia. 3 Depart-ment of Epidemiology, College of Health Sciences, Jimma University, Jimma, Ethiopia. 4 Discipline of Public Health, Faculty of Medicine, Nursing and Health Sciences, Flinders University, Adelaide, Australia.
Acknowledgements
The authors are grateful to the data collectors who gathered the data. This research was funded by Jimma University.
Competing interests
The authors declare that they have no competing interest. This research was funded by Jimma University. The funders had no role in study design, data col-lection and analysis, decision to publish, or preparation of the manuscript.
Received: 19 November 2015 Accepted: 31 January 2016
Table 3 Factors independently associated with poor glycemic level among T2DM patients JUTH, 2014
a Statistically significant at P value <0.05
Variables (n = 309) Glycemic level Crude OR (95 % CI) Adjusted OR (95 % CI) P value
Good, n (%) Poor, n (%)
Education
Illiterate 18 (20.7 %) 69 (79.3 %) 2.65 (1.20–5.87)a 3.46 (1.01–11.91) 0.049a
Read & write 10 (45.5 %) 12 (54.5 %) 0.83 (0.29–2.33) 0.81 (0.20–3.26) 0.766 1–8 31 (27.7 %) 81 (72.3 %) 1.81 (0.87–3.75) 2.45 (0.85–7.03) 0.095 9–12 13 (29.5 %) 31 (70.5 %) 1.65 (0.68–3.99) 1.97 (0.69–5.55) 0.202
College/University 18 (40.9 %) 26 (59.1 %) 1 1
Occupation
No job 31 (39.7 %) 47 (60.3 %) 1 1
Employed 21 (29.2 %) 51 (70.8 %) 1.60 (0.81–3.16) 2.65 (0.96–7.24) 0.048a
Merchant 6 (20.7 %) 23 (79.3 %) 2.53 (0.92–6.91) 2.69 (0.86–8.37) 0.086 Farmer 19 (20.2 %) 75 (79.8 %) 2.60 (1.32–5.12)a 2.47 (1.13–5.39) 0.023a
Daily labor 13 (36.1 %) 23 (63.9 %) 1.17 (0.51–2.64) 2.22 (0.80–6.11) 0.124 Anti-diabetics
Insulin 21 (26.6 %) 58 (73.4 %) 1.38 (0.77–2.47) 1.77 (0.60–5.19) 0.298
Oral medication 65 (33.3 %) 130 (66.7 %) 1 1
Insulin and oral medication 4 (11.4 %) 31 (88.6 %) 3.88 (1.31–11.45)a 4.59 (1.05–20.14) 0.043a
Medication adherence
High 52 (45.2 %) 63 (54.8 %) 1 1
Medium 25 (21.4 %) 92 (78.6 %) 3.04 (1.71–5.43)a 3.49 (1.72–7.09) 0.001a
[image:5.595.59.537.103.385.2]• We accept pre-submission inquiries
• Our selector tool helps you to find the most relevant journal
• We provide round the clock customer support
• Convenient online submission
• Thorough peer review
• Inclusion in PubMed and all major indexing services
• Maximum visibility for your research
Submit your manuscript at www.biomedcentral.com/submit
Submit your next manuscript to BioMed Central
and we will help you at every step:
References
1. Islam SM, Niessen LW, Seissler J, Ferrari U, Biswas T, Islam A, Lechner A. Diabetes knowledge and glycemic control among patients with type 2 diabetes in Bangladesh. SpringerPlus. 2015;4:284
2. Aschner P, Beck-Nielsen H, Bennett P, Boulton A, Colagiuri R. Diabetes and impaired glucose tolerance. 5th ed. Brussels: IDF Diabetes Atlas; 2012. 3. IDF. Diabetes and impaired glucose tolerance. 6th ed. Brussels: Diabetes
Atlas; 2013.
4. Mathers CD, Loncar D. Projections of global mortality and burden of disease from 2002 to 2030. PLoS Med. 2006;3(11):e442.
5. Whiting DR, Guariguata L, Weil C, Shaw J. IDF diabetes atlas: global esti-mates of the prevalence of diabetes for 2011 and 2030. Diabetes Res Clin Pract. 2011;94(3):311–21.
6. Harris MI. Racial and ethnic differences in health care access and health outcomes for adults with type 2 diabetes. Diabet Care. 2001;24(3):454–9. 7. Ali MK, Bullard KM, Imperatore G, Barker L, Gregg EW. Characteristics
associated with poor glycemic control among adults with self-reported diagnosed diabetes—National Health and Nutrition Examination Survey, United States, 2007–2010. MMWR Morb Mortal Wkly Rep. 2012;61(2):32–7.
8. Firouzi S, Barakatun-Nisak MY, Azmi KN. Nutritional status, glycemic control and its associated risk factors among a sample of type 2 diabetic individuals, a pilot study. J Res Med Sci. 2015;20(1):40–6.
9. Abebe SM, Berhane Y, Worku A, Alemu S, Mesfin N. Level of sustained glycemic control and associated factors among patients with diabetes mellitus in Ethiopia: a hospital-based cross-sectional study. Diabet Metab Synd Obes. 2015;8:65–71.
10. Colagiuri S, Lee CM, Wong TY, Balkau B, Shaw JE, Borch-Johnsen K. Glycemic thresholds for diabetes-specific retinopathy: implications for diagnostic criteria for diabetes. Diabet Care. 2011;34(1):145–50. 11. Lachin JM, Genuth S, Nathan DM, Zinman B, Rutledge BN. Effect of
glyce-mic exposure on the risk of glyce-microvascular complications in the diabetes control and complications trial–revisited. Diabetes. 2008;57(4):995–1001. 12. Selvin E, Marinopoulos S, Berkenblit G, Rami T, Brancati FL, Powe NR,
Golden SH. Meta-analysis: glycosylated hemoglobin and cardiovascular disease in diabetes mellitus. Ann Intern Med. 2004;141(6):421–31. 13. Gudina EK, Amade ST, Tesfamichael FA, Ram R. Assessment of
qual-ity of care given to diabetic patients at Jimma Universqual-ity Specialized Hospital diabetes follow-up clinic, Jimma. Ethiopia. BMC Endocr Disord. 2011;11:19.
14. Fiallo-Scharer R. Eight-point glucose testing versus the continuous glucose monitoring system in evaluation of glycemic control in type 1 diabetes. J Clin Endocrinol Metab. 2005;90(6):3387–91.
15. JDRF. Randomized clinical trial to assess the efficacy of real-time continu-ous glucose monitoring in the management of type 1 diabetes: research design and methods. Diabet Technol Ther 2008; 10(4):310–21.
16. Tamborlane WV, Beck RW, Bode BW, Buckingham B, Chase HP, Clemons R, Fiallo-Scharer R, Fox LA, Gilliam LK, Hirsch IB, et al. Continuous glucose monitoring and intensive treatment of type 1 diabetes. New Engl J Med. 2008;359(14):1464–76.
17. Healthy People 2020, 2015. http://www.healthypeople.gov/2020/topic-sobjectives2020/objectiveslist.aspx?topicId=8.
18. DACA. Standard treatment guideline for primary hospitals. 2nd ed. Addis Ababa; 2010.
19. Wabe NT, Angamo MT, Hussein S. Medication adherence in diabetes mel-litus and self management practices among type-2 diabetics in Ethiopia. NAm J Med Sci. 2011;3(9):418–23.
20. ADA. Standards of medical care in diabetes—2013. Diabet Care 2013, 36(1): 11–66.
21. Morisky DE, Green LW, Levine DM. Concurrent and predictive valid-ity of a self-reported measure of medication adherence. Med Care. 1986;24(1):67–74.
22. IBM Corp. Released 2011. IBM SPSS Statistics for Windows, Version 20.0. Armonk, NY: IBM Corp.
23. Gebrehiwot T, Jemal H, Dawit T. Non-adherence and Associated Factors among type 2 diabetic patients at Jimma University Specialized Hospital, Southwest Ethiopia. J Med Sci. 2013;13:578–84.
24. Hailu E, Mariam WH, Belachew T, Birhanu Z. Self-care practice and glycaemic control amongst adults with diabetes at the Jimma University Specialized Hospital in south-west Ethiopia: A cross-sectional study. Afr J Prim Health Care Fam Med. 2012;4(1):311–6.
25. Islam SM, Niessen LW, Seissler J, Ferrari U, Biswas T, Islam A, Lechner A. Diabetes knowledge and glycemic control among patients with type 2 diabetes in Bangladesh. SpringerPlus. 2015;4:284.
26. Wee HL, Ho HK, Li SC. Public awareness of diabetes mellitus in Singapore. Singap Med J. 2002;43(3):128–34.
27. Al-Akour NA, Khader YS, Alaoui AM. Glycemic control and its determi-nants among patients with type 2 diabetes mellitus attending a teaching hospital. J Diabet Metab. 2011;2:129.
28. Yin J, Yeung R, Luk A, Tutino G, Zhang Y, Kong A, Chung H, Wong R, Ozaki R, Ma R et al. Gender, diabetes education, and psychosocial factors are associated with persistent poor glycemic control in patients with type 2 diabetes in the Joint Asia Diabetes Evaluation (JADE) program. J Diabet. 2015;8(1):109–19. doi:10.1111/1753-0407.12262
29. Gautam A, Bhatta DN, Aryal UR. Diabetes related health knowledge, atti-tude and practice among diabetic patients in Nepal. BMC Endocr Disord. 2015;15:25.
30. Rani PK, Raman R, Subramani S, Perumal G, Kumaramanickavel G, Sharma T. Knowledge of diabetes and diabetic retinopathy among rural popula-tions in India, and the influence of knowledge of diabetic retinopathy on attitude and practice. Rural Remote Health. 2008;8(3):838.
31. Huri HZ, Lim LP, Lim SK. Glycemic control and antidiabetic drugs in type 2 diabetes mellitus patients with renal complications. Drug Des Dev Ther. 2015;9:4355–71.
32. Khattab M, Khader YS, Al-Khawaldeh A, Ajlouni K. Factors associated with poor glycemic control among patients with type 2 diabetes. J Diabet Complicat. 2010;24(2):84–9.
33. Leichter S. Making outpatient care of diabetes more efficient: analyzing noncompliance. Clin Diabet. 2005;23:187–90.