Open Access
Research article
The potential savings of using thiazides as the first choice
antihypertensive drug: cost-minimisation analysis
Atle Fretheim*, Morten Aaserud and Andrew D Oxman
Address: Department of Health Services Research, Norwegian Directorate for Health and Social Affairs, N-0031 Oslo, Norway
Email: Atle Fretheim* - [email protected]; Morten Aaserud - [email protected]; Andrew D Oxman - [email protected] * Corresponding author
Abstract
Background: All clinical practice guidelines recommend thiazides as a first-choice drug for the management of uncomplicated hypertension. Thiazides are also the lowest priced antihypertensive drugs. Despite this, the use of thiazides is much lower than that of other drug-classes. We wanted to estimate the potential for savings if thiazides were used as the first choice drug for the management of uncomplicated hypertension.
Methods: For six countries (Canada, France, Germany, Norway, the UK and the US) we estimated the number of people that are being treated for hypertension, and the proportion of them that are suitable candidates for thiazide-therapy. By comparing this estimate with thiazide prescribing, we calculated the number of people that could switch from more expensive medication to thiazides. This enabled us to estimate the potential drug-cost savings. The analysis was based on findings from epidemiological studies and drug trials, and data on sales and prescribing provided by IMS for the year 2000.
Results: For Canada, France, Germany, Norway, the UK and the US the estimated potential annual savings were US$13.8 million, US$37.4 million, US$72.2 million, US$10.7 million, US$119.7 million and US$433.6 million, respectively.
Conclusions:
Millions of dollars could be saved each year if thiazides were prescribed for hypertension in place of more expensive drugs. Our calculations are based on conservative assumptions. The potential for savings is likely considerably higher and may be more than US$1 billion per year in the US.
Background
Systematic reviews of randomized controlled trials have not demonstrated superiority for any class of antihyper-tensive drug [1,2]. However, the prevention of cardiovas-cular disease is better documented for some drug classes than others [1]. The evidence that first line thiazides are effective in reducing the risk of cardiovascular disease is particularly strong [1,3]. These drugs are also among the best tolerated antihypertensives [4]. In addition, thiazides
are by far the lowest priced antihypertensive drugs. Con-sequently, all clinical practice guidelines recommend thi-azides either as the only first choice drug for the management of uncomplicated hypertension, or as one of the first-line agents [5].
Yet, thiazides are prescribed less frequently than other antihypertensives [6–9]. For instance, in Norway the cost of bendroflumethiazide is 1/10 of that of amlodipine (a
Published: 08 September 2003
BMC Health Services Research 2003, 3:18
Received: 30 April 2003 Accepted: 08 September 2003
This article is available from: http://www.biomedcentral.com/1472-6963/3/18
calcium channel blocker), which is one of the most expen-sive drugs used in the management of elevated blood pressure [10]. Despite its high cost, amlodipine is the best selling antihypertensive drug in Norway both in terms of cost and in terms of dosages [7]. Amlodipine has also been the largest-selling antihypertensive drug worldwide (US$3.4 billion in 2000) [11]. This achievement is partic-ularly remarkable considering that evidence for the drug's effectiveness in preventing cardiovascular disease has been lacking. The low use of thiazides may be caused by misconceptions concerning possible problems with the use of thiazides and the extensive promotion of other more expensive medications [12].
We wanted to estimate the potential for drug cost savings if more rational prescribing practices were employed. Rational prescribing would in this case mean using thi-azides as the drug of choice in the management of hyper-tension when there is not an indication for selecting an alternative drug.
Methods
We compared the direct drug costs of current prescribing of antihypertensive medication with the costs if thiazides were selected as the first choice drug for the management of hypertension. The analysis was done for six countries: Canada, France, Germany, Norway, the UK and the US.
Based on the results of systematic reviews we assumed that thiazides and other antihypertensives are equally effective medication for uncomplicated hypertension with regards to health outcomes [1,2]. Consequently, we performed a cost-minimisation study where we calculated drug costs associated with thiazide and non-thiazide treatment for uncomplicated hypertension.
We calculated the potential for savings on direct drug expenses from the perspective of drug-payers, using sales values to calculate costs. We did not include value added tax (VAT) in the drug prices because antihypertensives are largely paid for by the public in the majority of the coun-tries we studied. When drugs are reimbursed with public funds, VAT simply represents a transfer of funds between the reimbursing agency and the treasury, and not as such a real cost to the public sector. All economic figures are reported in US dollars for the year 2000. The price year was 2000.
We used the "defined daily dose" (DDD) as a measure for the assumed average dose used for each drug [13]. The DDD is recommended by The World Health Organization as a standard measure for use in drug utilization studies [14]. By convention, we expressed consumption of drugs as DDDs/1000 inhabitants/day, which may serve as an estimation of the proportion of the population receiving
the drug treatment. An estimated consumption of 10 DDDs/1000 inhabitants/day corresponds to a daily use of 1% of the population.
Potential use of thiazides for the management of hypertension
The starting point for the analysis was the proportion of the total population currently on medication for hyper-tension. We assumed that patients with hypertension complicated by cardiovascular diseases should not use thiazides and that only a proportion of those remaining would be suitable candidates for thiazide-therapy, e.g. due to adverse effects. We searched MEDLINE for the fol-lowing estimates:
• The proportion of the population on medication for hypertension
• The proportion of people on medication for hyperten-sion that have additional cardiovascular disease
• The proportion of people with uncomplicated hyperten-sion that can use thiazides
We found survey-based estimates of the proportion of the population treated for hypertension in Canada (1986– 1992), England (1998), Norway (mid-90s), and the US (1988–1994) [15–18]. For Germany and France we used the lowest estimate (Canada). The surveys included only parts of the adult population. In order to convert the sur-vey findings to estimates for the total population, we used demographic data from the International Data Base of the US Census Bureau http://www.census.gov/ipc/www/idb print.html.
Our search did not identify robust data on the proportion of persons being treated for hypertension that have addi-tional cardiovascular disease. A study from Finland reported that 41% of those who were treated for hyperten-sion also suffered from "other cardiovascular diseases" [19]. Thirty-six percent of those taking medication for hypertension in the Tromso study reported having had angina, a heart attack or a stroke (E. Arnesen, personal communication). Based on this, we assumed that 60% of those being treated for hypertension do not have cardio-vascular disease. This figure was applied to all six coun-tries included in our analysis.
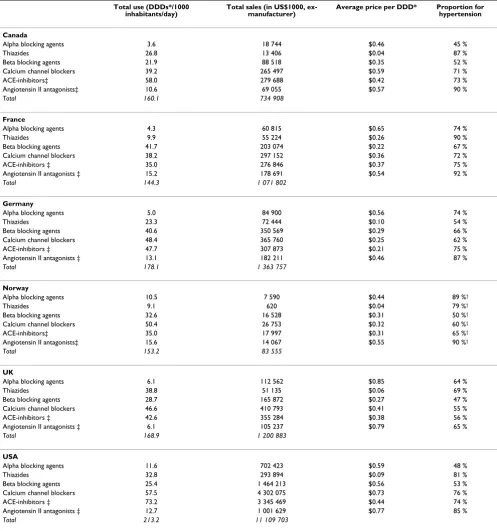
Table 1: Current use and sales of anthypertensive drugs (based on IMS-data for the year 2000)
Total use (DDDs*/1000 inhabitants/day)
Total sales (in US$1000, ex-manufacturer)
Average price per DDD* Proportion for hypertension
Canada
Alpha blocking agents 3.6 18 744 $0.46 45 %
Thiazides 26.8 13 406 $0.04 87 %
Beta blocking agents 21.9 88 518 $0.35 52 %
Calcium channel blockers 39.2 265 497 $0.59 71 %
ACE-inhibitors‡ 58.0 279 688 $0.42 73 %
Angiotensin II antagonists‡ 10.6 69 055 $0.57 90 %
Total 160.1 734 908
France
Alpha blocking agents 4.3 60 815 $0.65 74 %
Thiazides 9.9 55 224 $0.26 90 %
Beta blocking agents 41.7 203 074 $0.22 67 %
Calcium channel blockers 38.2 297 152 $0.36 72 %
ACE-inhibitors ‡ 35.0 276 846 $0.37 75 %
Angiotensin II antagonists ‡ 15.2 178 691 $0.54 92 %
Total 144.3 1 071 802
Germany
Alpha blocking agents 5.0 84 900 $0.56 74 %
Thiazides 23.3 72 444 $0.10 54 %
Beta blocking agents 40.6 350 569 $0.29 66 %
Calcium channel blockers 48.4 365 760 $0.25 62 %
ACE-inhibitors ‡ 47.7 307 873 $0.21 75 %
Angiotensin II antagonists ‡ 13.1 182 211 $0.46 87 %
Total 178.1 1 363 757
Norway
Alpha blocking agents 10.5 7 590 $0.44 89 %†
Thiazides 9.1 620 $0.04 79 %†
Beta blocking agents 32.6 16 528 $0.31 50 %†
Calcium channel blockers 50.4 26 753 $0.32 60 %†
ACE-inhibitors‡ 35.0 17 997 $0.31 65 %†
Angiotensin II antagonists‡ 15.6 14 067 $0.55 90 %†
Total 153.2 83 555
UK
Alpha blocking agents 6.1 112 562 $0.85 64 %
Thiazides 38.8 51 135 $0.06 69 %
Beta blocking agents 28.7 165 872 $0.27 47 %
Calcium channel blockers 46.6 410 793 $0.41 55 %
ACE-inhibitors ‡ 42.6 355 284 $0.38 56 %
Angiotensin II antagonists ‡ 6.1 105 237 $0.79 65 %
Total 168.9 1 200 883
USA
Alpha blocking agents 11.6 702 423 $0.59 48 %
Thiazides 32.8 293 894 $0.09 81 %
Beta blocking agents 25.4 1 464 213 $0.56 53 %
Calcium channel blockers 57.5 4 302 075 $0.73 76 %
ACE-inhibitors ‡ 73.2 3 345 469 $0.44 74 %
Angiotensin II antagonists ‡ 12.7 1 001 629 $0.77 85 %
Total 213.2 11 109 703
thiazides should be appropriate therapy for 45% (75% of 60%) of all on medication for hypertension.
Based on these estimates we calculated the potential use of thiazides for the management of uncomplicated hyper-tension for the total population in each country.
Current use of thiazides and non-thiazides for the management of hypertension
We estimated current use of antihypertensive drugs based on country-specific data on sales and prescribing for the year 2000, provided by IMS, a health research company. IMS supplied us with figures of purchases made by retail pharmacies and, where appropriate, other distribution channels, such as mail order in the US. The prices that were available in the IMS statistics were those demanded by the manufacturer of the drugs and did not include mar-gins added by wholesalers and retailers or VAT.
Estimates for the proportions of prescriptions for each drug class that are made specifically for hypertension were obtained from IMS' Medical Audit, which collects a repre-sentative sample of prescriptions issued by primary care physicians. We assumed that prescriptions made for hypertension were, on average, of the same drug-quantity as prescriptions made for other disorders. Prescribing data for Norway were obtained from a prescription database for 1994–96 (Norwegian Medicinal Depot, Oslo).
In the thiazide-group we also included non-thiazide low-ceiling diuretics, such as chlorthalidone, and combined formulations with potassium or a potassium-sparing agent. The non-thiazide group consisted of alpha-ing agents, beta-blockalpha-ing agents, calcium channel block-ers, inhibitors, and angiotensin II antagonists. ACE-inhibitors and angiotensin II antagonists are available in combination with a thiazide. These drugs were not included in our analysis, either as thiazides or as drugs that could be replaced by thiazides.
IMS files provided figures on drug consumption expressed in kilograms. These were converted to DDDs/1000 inhab-itants/day for each drug class, by using DDDs for each drug and demographic data from the International Data Base of the US Census Bureau. Figures on the current use and sales of the various antihypertensive drug classes are found in table 1.
Potential savings
The difference between potential and current use of thi-azides for hypertension gave us the potential increase. We assumed that an increase in the use of thiazides would result in an equivalent decrease in the use of non-thiazide antihypertensive drugs, expressed as dosages (DDDs). Thus, one DDD of a thiazide was considered to be as
effec-tive as one DDD of any other antihypertensive drug. Prag-matically, we assumed that a switch to thiazides would mean that the reduction in use of non-thiazides would be evenly distributed among the various drug-classes, in pro-portion with their current use.
After calculating the current (2000) cost of non-thiazide drugs for the management of uncomplicated hyperten-sion we calculated the potential savings on these drugs by multiplying the current costs with the potential percent reduction. Similarly, we calculated the additional cost of an increase in the use of thiazides. These calculations are summarized mathematically in Appendix - see Additional file: 1.
Sensitivity analyses
Our primary analysis was based on what we considered to be either the best estimate or, if data were lacking, a con-servative estimate for each variable. We carried out sensi-tivity analyses to test the robustness of our findings. The ranges for these analyses were, as far as possible, based on empirical data.
Our estimates of the number of people using medication for the management of hypertension are probably low for several countries. In Norway the sales of antihypertensive drugs have increased by almost 50% since the survey we used in our main analysis was conducted in the mid-90s [7,25]. This may partly be due to an increase in the use of the drugs for other conditions, such as congestive heart failure, but it is likely that the number of people treated for hypertension has increased as well. The estimate from the English health survey is the most recent and up to 50% higher than the other estimates. We therefore used the English estimate for the sensitivity analysis.
In the primary analysis we assumed that patients with car-diovascular disease would not use thiazides for the management of hypertension. However, 37% to 52% of patients that take medication for hypertension report using more than one antihypertensive drug [17,19,26], and thiazides would be an appropriate second choice for many that have cardiovascular disease. Thus, in the sensi-tivity analysis we entered the assumption that 40% of such patients could use thiazides.
Our assumption that 40% of those treated for hyperten-sion have additional cardiovascular disease may be ques-tioned due to the weak data we found for this estimate. We considered 30% and 50% to be reasonable alternative estimates to use in the sensitivity analysis, although we have no solid basis for this.
use thiazides. We selected 65% and 85% as the range, based on rates of adherence to therapy in randomized controlled trials (67% to 87%) [20–24].
Alternative data-source for Norway
For Norway we also carried out our analysis substituting the IMS figures with official sales figures. Norwegian sales figures for medicines (quantity and expenditure) are avail-able from official sales statistics and provide the price of drugs to consumers.
Results
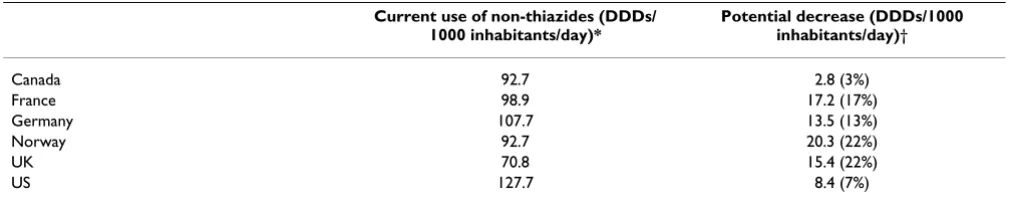
The potential increase in use of thiazides for the manage-ment of hypertension (the difference between the poten-tial and current use) is found in table 2. Total use of non-thiazide antihypertensive drugs, excluding combination drugs, is found in table 3. The potential decrease in use of non-thiazides (table 3) corresponds to the potential increase in use of thiazides (table 2).
The current (2000) total costs of thiazide and non-thi-azide antihypertensive drugs for the management of hypertension are given in table 4, along with the corre-sponding potential increase and decrease in expenditures, and the resulting net potential for direct drug-cost savings.
Sensitivity analyses
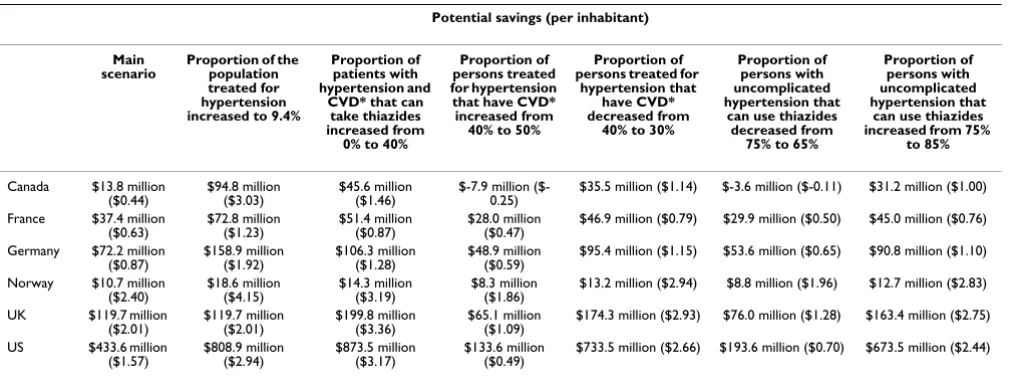
The results of the univariate sensitivity analyses are given in table 5.
As described in the methods section, the values we have used in our main analysis are most likely too low for two of the variables: the proportion of the population treated for hypertension and the proportion that could take thi-azides among those with hypertension and cardiovascular disease. For the remaining variables we have little reason to believe that the values are either too low or too high. In order to arrive at a best estimate for the potential savings, we performed a sensitivity analysis in which we combined the adjusted values for the two variables that we had rea-son to believe that the values used in the main analysis were low. The resulting potential savings are found in table 6.
Alternative data-source for Norway
[image:5.612.53.554.102.190.2]For Norway, the only country for which we have retail data, the estimated potential savings were 15% higher based on retail costs (excluding VAT) compared with prices charged by manufacturers.
Table 2: Current and potential use of thiazides for hypertension
Proportion of the population on medication for hypertension*
Potential use of thiazides (DDDs/1000 inhabitants/day)†
Current use of thiazides (DDDs/1000 inhabitants/day)‡
Potential increase (DDDs/1000 inhabitants/day)
Canada 5.8% 26.1 23.3 2.8 (12%)
France 5.8% 26.1 8.9 17.2 (193%)
Germany 5.8% 26.1 12.6 13.5 (107%)
Norway 6.1% 27.5 7.2 20.3 (282%)
UK 9.4% 42.2 26.8 15.4 (58%)
US 7.8% 35.0 26.6 8.4 (32%)
[image:5.612.53.559.271.373.2]*Based on surveys for Canada, Norway, the UK and the US. Lowest estimate (Canadian) used for France and Germany †Assuming that a daily defined dose (DDD) of thiazide is appropriate medication for 45% of persons on medication for hypertension ‡Calculated from country-specific IMS-data for the year 2000
Table 3: Current and potential use of non-thiazides for hypertension
Current use of non-thiazides (DDDs/ 1000 inhabitants/day)*
Potential decrease (DDDs/1000 inhabitants/day)† Canada 92.7 2.8 (3%) France 98.9 17.2 (17%) Germany 107.7 13.5 (13%) Norway 92.7 20.3 (22%)
UK 70.8 15.4 (22%)
US 127.7 8.4 (7%)
Discussion
Our analysis indicates that there is a substantial potential for savings if thiazides were used as first-choice drugs in the treatment of uncomplicated hypertension. We have consistently used conservative assumptions. Sensitivity analyses indicate that the true potential savings are likely to be considerably higher than in our primary analyses for all six countries. In the US, for instance, the potential drug cost savings may be over US$1 billion.
The sales-figures we have used are based on the estimated prices charged by manufacturers, which do not include margins added by wholesalers and retailers. These mar-gins are likely to vary between countries but not including them is likely to have contributed to an underestimation of the potential savings, as we have shown for Norway. Not including VAT may also have resulted in underesti-mates of the potential savings in countries where private parties pay for drugs.
We may have overestimated the potential savings by not taking into consideration specific recommendations made for patients with diabetes and hypertension. How-ever, thiazides are recommended as first-choice drug also for this patient-group, except in the presence of diabetic nephropathy [27]. Also, treatment goals for blood pres-sure are usually set lower for patients with diabetes. Thus, a particularly large proportion of these patients will probably use more than one antihypertensive drug and a thiazide would be an appropriate second drug in most cases, if not selected as the primary agent.
[image:6.612.53.561.101.211.2]We did not include any cost implications in our main analysis other than a change in drug expenditures. There are other costs related to antihypertensive therapy, such as consultations, travel-expenses and laboratory tests. However, we have little reason to believe that these costs are significantly different for thiazides than for other drugs. This assumption may be challenged by the fact that
Table 4: Current annual spending and potential for savings on drugs for the treatment of hypertension
Current spending on thiazides*
Potential increased spending on
thiazides†
Current spending on non-thiazides*
Potential decreased spending on
non-thiazides‡
Resulting potential savings (per
inhabitant)
Canada $11.7 million $1.4 million (12%) $509.3 million $15.2 million (3%) $13.8 million ($0.44) France $49.7 million $95.8 million (193%) $767.0 million $133.2 million (17%) $37.4 million ($0.63) Germany $39.1 million $42.0 million (107%) $910.4 million $114.1 million (13%) $72.2 million ($0.87) Norway $0.5 million $1.4 million (282%) $55.4 million $12.1 million (22%) $10.7 million ($2.40) UK $35.3 million $20.3 million (58%) $643.3 million $140.0 million (22%) $119.7 million ($2.01) US $238.1 million $75.6 million (32%) $7 709.8 million $509.1 million (7%) $433.6 million ($1.57) * Calculated from country-specific IMS-data for the year 2000. Combination drugs are not included † See table 2 ‡ See table 3
Table 5: Univariate sensitivity analyses
Potential savings (per inhabitant)
Main scenario
Proportion of the population treated for hypertension increased to 9.4%
Proportion of patients with hypertension and
CVD* that can take thiazides increased from
0% to 40%
Proportion of persons treated for hypertension that have CVD* increased from
40% to 50%
Proportion of persons treated for
hypertension that have CVD* decreased from
40% to 30%
Proportion of persons with uncomplicated hypertension that
can use thiazides decreased from
75% to 65%
Proportion of persons with uncomplicated hypertension that
can use thiazides increased from 75%
to 85%
Canada $13.8 million
($0.44) $94.8 million ($3.03) $45.6 million ($1.46) $-7.9 million ($-0.25) $35.5 million ($1.14) $-3.6 million ($-0.11) $31.2 million ($1.00) France $37.4 million
($0.63) $72.8 million ($1.23) $51.4 million ($0.87) $28.0 million ($0.47) $46.9 million ($0.79) $29.9 million ($0.50) $45.0 million ($0.76) Germany $72.2 million
($0.87) $158.9 million ($1.92) $106.3 million ($1.28) $48.9 million ($0.59) $95.4 million ($1.15) $53.6 million ($0.65) $90.8 million ($1.10) Norway $10.7 million
($2.40) $18.6 million ($4.15) $14.3 million ($3.19) $8.3 million ($1.86) $13.2 million ($2.94) $8.8 million ($1.96) $12.7 million ($2.83) UK $119.7 million
($2.01) $119.7 million ($2.01) $199.8 million ($3.36) $65.1 million ($1.09) $174.3 million ($2.93) $76.0 million ($1.28) $163.4 million ($2.75) US $433.6 million
($1.57) $808.9 million ($2.94) $873.5 million ($3.17) $133.6 million ($0.49) $733.5 million ($2.66) $193.6 million ($0.70) $673.5 million ($2.44)
[image:6.612.55.564.276.467.2]thiazide use can lead to hypokalemia and measuring the level of potassium one to two months after initiating treat-ment may be advisable [4]. This could be an increased cost of prescribing thiazides compared to other drugs. However, we believe that this is of minor importance since laboratory analyses are commonly undertaken as part of evaluation and follow-up of hypertension therapy in general.
We have strong reason to believe that health outcomes for the treatment of uncomplicated hypertension are similar for thiazides and other drugs [1,2], thus we can assume no differences in indirect costs related to morbidity, such as increased use of health services or reduced productivity for patients. This can be questioned in light of the findings of a recent trial where ACE-inhibitor based therapy pro-duced better outcomes than diuretics, particularly in elderly men [28]. On the other hand, in a newly published meta-analysis involving all major randomised controlled trials of antihypertensive medication the conclusion was: "Low-dose diuretics are the most effective first-line treat-ment" [29]. An additional point to be made from the results of this meta-analysis is that thiazides tend to be more effective at lowering blood pressure than other agents. This suggests that increased use of thiazides might reduce the need for additional medication and conse-quently lead to even greater savings.
Interestingly, sales figures for thiazides are considerably lower in Norway than in other countries. The level of thi-azide use (DDDs/1000 inhabitants/day) varies widely also within the Nordic countries. Compared to Norway, the total use of thiazides is two, 3.5 and five times higher in Sweden, Finland and Denmark respectively [8]. If Nor-wegian physicians prescribed thiazides as frequently as Danish physicians, the yearly savings for antihyperten-sives would be about twice our estimated potential for savings, suggesting, again, that our estimate is conservative.
So far as we are aware, the potential savings has not been quantified for the six countries we have considered. Nel-son and colleagues studied the cost implications of actual and recommended prescribing patterns for the manage-ment of hypertension in Australia and estimated potential savings for 1998 to be between $1.20 and $2.80 per inhabitant [9].
Conclusions
There is increasing pressure to contain healthcare budgets and increasing proportions of healthcare budgets are used for prescription drugs. A yearly unnecessary expense of millions of dollars is clearly undesirable. This could be addressed in at least two ways: changing prescribing practices among physicians or paying competitive prices for equally effective antihypertensive drugs. Changing prescribing practices, or professional practice in general, is not easy [30]. It requires effective strategies and resources to support these. In this case such an investment could potentially save money and at the same time improve quality, if it addressed other aspects of managing hyper-tension, such as ensuring that the right people are started on medication and once started blood pressure is lowered to desired levels. Alternatively, drug purchasers could refuse to pay non-competitive prices for drugs that do not have any proven benefits over thiazides.
Competing interests
All the authors are employed by the Norwegian govern-ment, which has a substantial interest in containing the costs of healthcare. AF and ADO are conducting a trial of implementation strategies for guidelines for the manage-ment of hypertension and hypercholesterolaemia. MA has previously carried out short term pharmacoeconomic projects for the National Insurance Service and the Nor-wegian Medicines Agency. From 1997 to 1999 he worked for a private company, Brevreklame, doing market research for pharmaceutical firms in Norway.
Table 6: Sensitivity analysis (best estimate)*
Potential savings (per inhabitant)
Canada $146.4 million ($4.68) France $95.3 million ($1.61) Germany $214.1 million ($2.59) Norway $24.1 million ($5.38) UK $199.8 million ($3.36) US $1 340.6 million ($4.86)
Author contributions
AF conceived the study, prepared first drafts of the proto-col and the manuscript, and contributed to all other aspects of the study. MA contributed to the study design, data acquisition, analysis, interpretation, and critical revi-sions of the manuscript. ADO contributed to the interpre-tation of data and critical revisions of the manuscript.
Additional material
Acknowledgements
We are grateful to Elisabeth Eriksen and Marit Rønning at the Norwegian Medicinal Depot for assistance with data from the prescription database. Peter Stephens at IMS supplied us with the international sales and diagnosis statistics.
References
1. Wright JM, Lee C and Chambers GK: Systematic review of anti-hypertensive therapies: does the evidence assist in choosing a firstline drug? Can Med Assoc J 1999, 161:25-32.
2. Neal B, MacMahon S and Chapman N: Effects of ACE inhibitors, calcium antagonists, and other blood- pressure-lowering drugs: results of prospectively designed overviews of ran-domised trials. Blood Pressure Lowering Treatment Trial-ists' Collaboration. Lancet 2000, 356:1955-1964.
3. The ALLHAT Officers and Coordinators for the ALLHAT Collabora-tive Research Group: Major outcomes in high-risk hypertensive patients randomized to angiotensin-converting enzyme inhibitor or calcium channel blocker vs diuretic: The Antihy-pertensive and Lipid-Lowering Treatment to Prevent Heart Attack Trial (ALLHAT). JAMA 2002, 288:2981-2997.
4. Wright JM: Choosing a first-line drug in the management of elevated blood pressure: what is the evidence? 1: Thiazide diuretics. Can Med Assoc J 2000, 163:57-60.
5. Fretheim A, Williams Jr. JW, Oxman AD and Herrin J: The relation between methods and recommendations in clinical practice guidelines for hypertension and hyperlipidemia. J Fam Pract
2002, 51:963-968.
6. Siegel D, Lopez J, Meier J and Cunningham F: Changes in the phamacologic treatment of hypertension in the Department of Veterans Affairs 1997-1999: decreased use of calcium antagonists and increased use of beta-blockers and thiazide diuretics. Am J Hypertens 2001, 14:957-962.
7. WHO Collaborating Centre for Drug Statistics Methodology: Drug Consumption in Norway 1996 - 2000 Edited by: Marit Rønning. Oslo, WHO Collaborating Centre for Drug Statistics Methodology; 2001. 8. Nielsen Annemette: Medicines consumption in the Nordic countries
Edited by: Johannes Nielsen. Copenhagen, Nordisk Medicinalstatistisk Komité; 2001:171-256.
9. Nelson MR, McNeil JJ, Peeters A, Reid CM and Krum H: PBS/RPBS cost implications of trends and guideline recommendations in the pharmacological management of hypertension in Aus-tralia, 1994-1998. Med J Aust 2001, 174:565-568.
10. Felleskatalogen AS: Felleskatalogen 43th edition. Oslo, Felleskatalogen AS; 2001.
11. Pfizer inc.: Pfizer 2000 Annual ReportNew York, NY, Pfizer inc.; 2001.
12. Moser M: Why are physicians not prescribing diuretics more frequently in the management of hypertension? JAMA 1998, 279:1813-1816.
13. WHO Collaborating Centre for Drug Statistics Methodology: ATC index with DDDs 2000Oslo, WHO Collaborating Centre for Drug Statistics Methodology; 2000.
14. WHO Collaborating Centre for Drug Statistics Methodology: About the ATC/DDD systemOslo, WHO Collaborating Centre for Drugs Statistics Methodology; 2001.
15. Komiteen for medisinsk teknologivurdering: Behandling av mild hyper-tensjon [Treatment of mild hypertension] Oslo, Norges forskningsråd; 1997.
16. Statistics Norway: Health Survey 1995 Oslo-Kongsvinger, Statistics Norway; 1999.
17. Primatesta P, Brookes M and Poulter NR: Improved hypertension management and control: results from the health survey for England 1998. Hypertension 2001, 38:827-832.
18. Joffres MR, Hamet P, MacLean DR, L'italien GJ and Fodor G: Distri-bution of blood pressure and hypertension in Canada and the United States. Am J Hypertens 2001, 14:1099-1105.
19. Wallenius S, Kumpusalo E, Parnanen H and Takala J: Drug treat-ment for hypertension in Finnish primary health care. Eur J Clin Pharmacol 1998, 54:793-799.
20. The ALLHAT Officers and Coordinators for the ALLHAT Collabora-tive Research Group: Major cardiovascular events in hyperten-sive patients randomized to doxazosin vs chlorthalidone.
JAMA 2000, 283:1967-1975.
21. Brown Morris J., Palmer Christopher R., Castaigne Alain, de Leeuw PW, Mancia G, Rosenthal Talma and Ruilope Luis M.: Morbidity and mortality in patients randomised to double-blind treatment with a long-acting calcium-channel blocker or diuretic in the International Nifedipine GITS study: intervention as a goal in hypertension treatment (INSIGHT). Lancet 2000, 356:366-372. 22. Philipp T, Anlauf M, Distler A, Holzgreve H, Michaelis J and Wellek S: Randomised, double blind, multicentre comparison of hydrochlorothiazide, atenolol, nitrendipine, and enalapril in antihypertensive treatment: reults of the HANE study. BMJ
1997, 315:159.
23. Neaton JD, Grimm R.H.,jr., Prineas RJ, Stamler J, Grandits GA, Elmer PJ, Cutler JA, Flack JM, Schoenberger JA, McDonald R, Lewis PJ and Liebson PR: Treatment of mild hypertension study. JAMA 1993, 270:713-724.
24. Materson Barry J., Reda Domenic J., Cushman William C., Massie Barry M., Freis Edward D., Kochar Mahendr S., Hamburger Robert J., Fye Carol, Lakshman Raj, Gottdiener John, Ramirez Eli A. and Hend-erson William G.: Single-drug therapy for hypertension in men.
N Engl J Med 1993, 328:914-921.
25. Norsk Medisinaldepot AS: Drug Consumption in Norway 1992 - 1996
Edited by: Kåre Øydvin. Oslo, Norsk Medisinaldepot AS; 1997. 26. Stokke HP, Klemetsrud T, Westheim A, Tretli S and Olsen H:
For-skrivningsmønster av blodtrykksmedisiner i allmennpraksis i 1995 [Prescription patterns of antihypertensive agents in general practice in 1995]. Tidsskr Nor Laegeforen 2000, 120:1136-1140.
27. Joint National Committee on Prevention, Detection, Evaluation and and Treatment of High Blood Pressure: The Sixth Report of the Joint National Committee on prevention, detection, evaluation, and treatment of high blood pressureBethesda, National Institutes of Health; 1997. 28. Wing LM, Reid CM, Ryan P, Beilin LJ, Brown MA, Jennings GL,
John-ston CI, McNeil JJ, Macdonald GJ, Marley JE, Morgan TO and West MJ: A comparison of outcomes with angiotensin-converting--enzyme inhibitors and diuretics for hypertension in the elderly. N Engl J Med 2003, 348:583-592.
29. Psaty BM, Lumley T, Furberg CD, Schellenbaum G, Pahor M, Alder-man MH and Weiss NS: Health outcomes associated with vari-ous antihypertensive therapies used as first-line agents: a network meta-analysis. JAMA 2003, 289:2534-2544.
30. Grimshaw JM, Shirran L, Thomas R, Mowatt G, Fraser C, Bero L, Grilli R, Harvey E, Oxman A and O'Brien MA: Changing provider behavior: an overview of systematic reviews of interventions. Med Care 2001, 39:II2-45.
Pre-publication history
The pre-publication history for this paper can be accessed here:
Additional file 1
Mathematical Summary
Click here for file
Publish with BioMed Central and every scientist can read your work free of charge
"BioMed Central will be the most significant development for disseminating the results of biomedical researc h in our lifetime."
Sir Paul Nurse, Cancer Research UK
Your research papers will be:
available free of charge to the entire biomedical community
peer reviewed and published immediately upon acceptance
cited in PubMed and archived on PubMed Central
yours — you keep the copyright
Submit your manuscript here:
http://www.biomedcentral.com/info/publishing_adv.asp