S H O R T R E P O R T
Open Access
Array data extractor (ADE): a LabVIEW program to
extract and merge gene array data
Stefan Kurtenbach
*, Sarah Kurtenbach and Georg Zoidl
Abstract
Background:Large data sets from gene expression array studies are publicly available offering information highly valuable for research across many disciplines ranging from fundamental to clinical research. Highly advanced
bioinformatics tools have been made available to researchers, but a demand for user-friendly software allowing researchers to quickly extract expression information for multiple genes from multiple studies persists. Findings:Here, we present a user-friendly LabVIEW program to automatically extract gene expression data for a list of genes from multiple normalized microarray datasets. Functionality was tested for 288 class A G protein-coupled receptors (GPCRs) and expression data from 12 studies comparing normal and diseased human hearts. Results confirmed known regulation of a beta 1 adrenergic receptor and further indicate novel research targets.
Conclusions:Although existing software allows for complex data analyses, the LabVIEW based program presented here, “Array Data Extractor (ADE)”, provides users with a tool to retrieve meaningful information from multiple normalized gene expression datasets in a fast and easy way. Further, the graphical programming language used in LabVIEW allows applying changes to the program without the need of advanced programming knowledge.
Keywords:Array Data Extractor, ADE, Gene expression array, Microarray data analysis, Meta-analysis, Combining of multiple datasets, Statistics, Merge p-values
Background
High-throughput gene expression array technologies are commonly used in biomedical research and provide huge amounts of data. Today, there are close to one million preprocessed datasets publicly available repositories like the NCBI Gene Expression Omnibus [1], ArrayExpress [2] or the Stanford Microarray Database [3]. This provides re-searchers with the opportunity to detect novel treatment targets for various diseases [4], discover and refine signal-ing pathways, and to identify unknown interaction net-works. Combining and comparing data from different studies is a rewarding approach, but comparing data across several studies is a challenging task. Various ap-proaches have been published to normalize and refine data to detect meaningful expression changes in genes/ networks and there are several software packages, e.g. the open source software Bioconductor [5], allowing for complex microarray analysis like pre-processing, quality
assessment, differential expression, clustering and classifi-cation, and gene set enrichment analysis. Other examples of open source software are the TM4 Microarray Software Suite [6] and GenePattern [7]. Whilst other software pack-ages allow very advanced data processing, performing a meta-analysis with data from multiple studies and plat-forms is still difficult for a“bench”scientist, and there is a lack of user-friendly software allowing researchers do so in a fast and easy way. A remarkable online tool, INMEX [8], has recently been published, providing user-friendly web-based platform for meta-analysis, but other available tools require substantial bioinformatics skills perform cross-platform meta-analysis [8,9]. Here, we present a LabVIEW program, Array Data Extractor (ADE), which allows users to extract expression information for a list of genes from multiple datasets, merge it into one output file, and per-form basic statistics. Although e.g. INMEX can perper-form much more advanced meta-analysis, ADE allows working offline with large datasets, easy modification of the code (see below), and to prioritize and exclude array spots according to their specificity.
* Correspondence:[email protected]
Faculty of Health, Department of Psychology, Molecular and Cellular Neuroscience, York University, LSB 323A, 4700 Keele Street, Toronto, ON M3J 1P3, Canada
LabVIEW is a graphical programming language, where code is written by wiring together graphical modules. While LabVIEW contains the same concepts found in most traditional programming languages, such as differ-ent data types, loops, variables, and object-oridiffer-ented programming, the visual representation allows for easy access and modification of the code, in contrast to pro-gramming languages where the code is written in text. It must be noted that the user needs a licensed copy of the basic LabVIEW software. The LabVIEW code can be compiled into an executable file if wished. LabVIEW was chosen as the programming platform, because (I) the graphical programming interface allows users without profound programming skills to edit the program, (II) many processing subroutines (statistics, data sorting, fitting) are built-in and can be applied to the program, (III) it is platform independent, and (IV) LabVIEW is an established software platform used for various research purposes in many laboratories. Program structures can be assigned to existing projects, which is why several LabVIEW programs for various purposes have been published [10-18].
Implementation
Data extraction
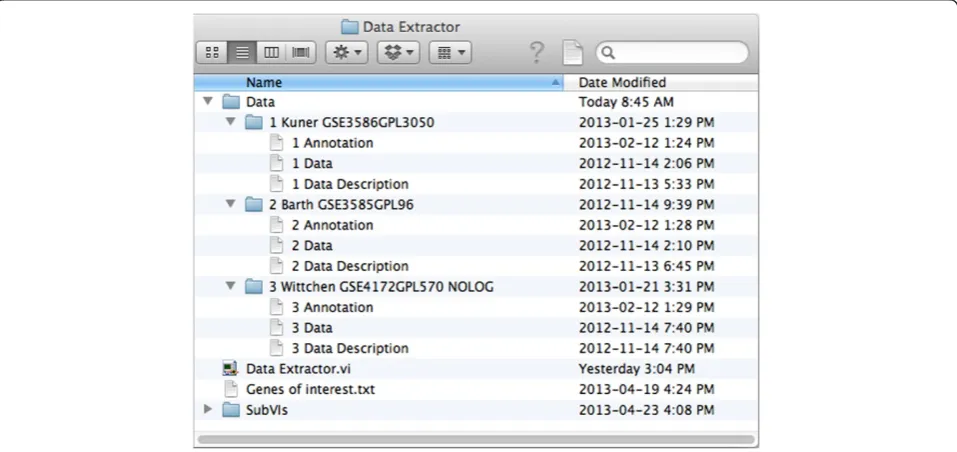
The user provides basic information needed to process the data, organized as depicted in Figure 1. Sample files and detailed formatting informations are included in the supplementary files. First, a text file “Genes of interest. txt”has to be generated where the user defines the genes that he is interested in. Second, expression data has to
be downloaded from e.g. the Gene Expression Omnibus (GEO) database. The user has to generate “Annotation. txt” files for each study containing information on how the genes of interest are named on the respective gene array (ID). GEO normally provides array annotations, or they can be obtained from the array manufacturer and copy-pasted into the Annotations.txt file. If wished, other unique identifiers like the Entrez Gene ID can be used instead, although in many cases the annotation files of the manufacturers are kept up-to-date and using gene names will make working with the output file easier. The user also defines the groups in the study (e.g. con-trol, disease 1, disease 2) in the “Data Description.txt” file (see Additional file 1).
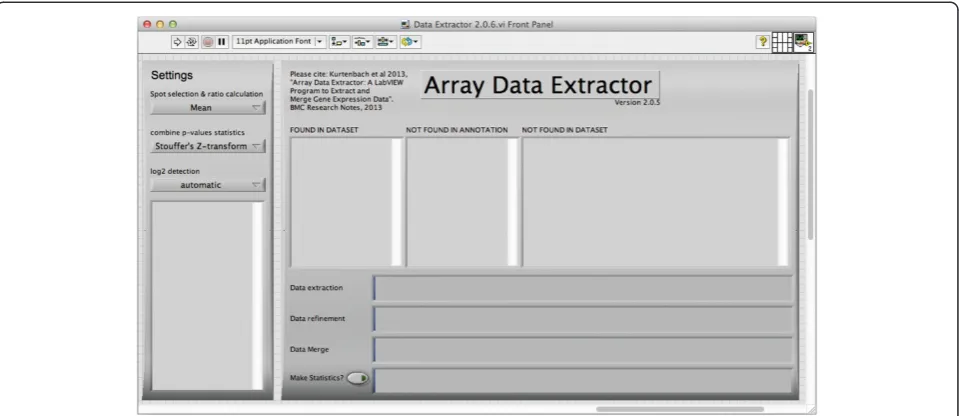
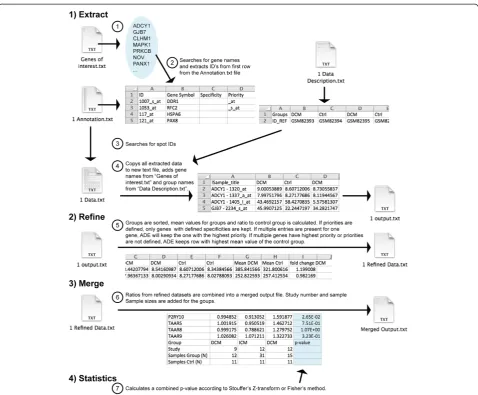
The program interface is depicted in Figure 2. Once started, ADE will perform a series of tasks, which are summarized in Figure 3. First, the software will extract all data for the genes defined (or e.g. Entrez IDs) in
“Genes of interest.txt”from the“Data.txt”files. Extracted data will be saved in a new folder called“Extracted Data” for each study individually as “output.txt” files. Existing
“output.txt” files will not be overwritten, as in some cases complete ADE runs are not needed, for instance when only one new study is added.
Data refinement
[image:2.595.59.538.470.696.2]Defined Groups will be clustered together correctly (because in some data files they are not) and a ratio of the means or medians (can be selected by the user on the interface) from the defined groups to the control group will be calculated. Because some studies provide
their data non-logarithmic, the user can add “NOLOG” to the folder name of the respective study, which ADE will recognize, or turn on the automatic Log2 detection on the software interface. If automatic Log2 detection is turned on, ADE will display which studies it finds to be Log2 performed (please check if correct!).
In some gene expression arrays, multiple spots can be present for the same gene and there are several ways to deal with multiple probe sets [19]. ADE can automatic-ally prioritize or exclude samples by their name on the gene array: Affymetrix platforms usually provide infor-mation about spot specificity in the spot ID name (e.g.
“_s_at”). By adding a list of extensions to the fourth col-umn of the“Annotation.txt” file (see Additional file 1) users can define which samples shall be included and in which priority. If information about specificity is avail-able but not included in the probes names (e.g. for some Illumina arrays), the user can add this informa-tion in the third row of the “Annotation.txt” file. If there are multiple spots for one gene with highest pri-ority (or if no priorities are defined), ADE will select the spot with the highest mean/median value of the control group by default. Refined data will be placed in a“Refined Data”folder. ADE will not overwrite existing files.
Data merging
ADE will merge the ratio values for each gene and study into a single spreadsheet. Further, it will insert the correct
group names, the study number, and information about the sample sizes (N). ADE will not overwrite an existing file, but perform statistics on it if selected (see below).
Statistical analysis
If the“Make statistics?”button is activated, ADE will per-form a statistical analysis of the data and provide a com-bined p-value for a gene being up- or down-regulated in all studies in the merged output file. As ADE will not over-write existing files, it is possible to perform statistical ana-lysis after an initial run, allowing the user to delete fractions (genes, studies, columns) or sort the merged output file before performing statistics (the first column, containing the gene names/IDs, and the column labels at the bottom of the file (for the remaining columns) must remain un-changed). ADE will first calculate p-values for each gene in the respective studies by performing a one-tailed Student’s t-test. To merge p-values, we included Stouffer’s Z-transform method [20] and Fischer’s method [21]. For Stouffer’s Z-transform method, p-values are first tra-nsformed to Z scores, with Zi=Φ−1(p1),Φ(⋅) being the standard normal cumulative distribution function (CDF). Z-Scores receive signs according to the gene being up- or down-regulated and summed to an overall Z-Score (Zs), with Zs¼∑Ni¼1Zi=
ffiffiffiffi
N p
, N being the number of Z-scores. Z-scores are not weighted in this approach. Zs is finally transformed to a combined two-sided p-value (ps) with
ps= 2Φ (Zs). Fisher’s method uses χ22k¼−2∑ki¼1Inð Þpi ,
[image:3.595.59.539.89.297.2]of freedom, k being the number of p-values. We found Stouffer’s method to be more restrictive, but other statistical approaches may also be considered [22-25].
Findings
Hundreds of G protein-coupled receptors (GPCRs) are known to be expressed in the heart, some of which linked to heart disease formation [26-28]. To demon-strate ADE function, we downloaded a list containing 288 class A GPCRs from the International Union of Basic and Clinical Pharmacology database website [29] (www.iuphar-db.org) and expression data from 12 stud-ies comparing normal and diseased human hearts (GSE3586 [30], GSE3585 [30], GSE4172 [31], GSE36961, GSE1869 [32], GSE32453, GSE29819 [33], GSE21610 [34], GSE9800, GSE5406 [35], GSE2656, GSE1145) from the GEO database. Datasets contained data for various disease groups. Downloading and organizing all files for
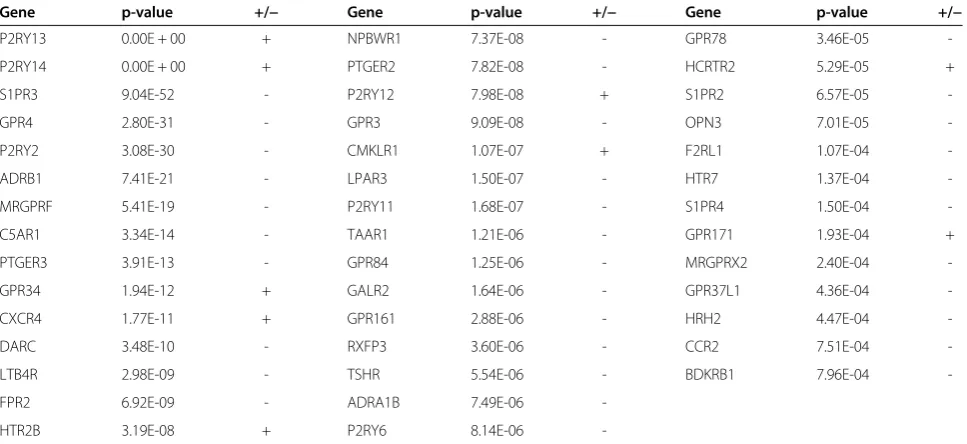
ADE will take ~15 min per study initially, but once pre-pared files can be stored and reused for ADE runs. After preparation, ADE took ~5 minutes to extract and refine the data for all GPCRs on a standard desktop computer. Groups with less than 5 samples and genes covered by less then five studies were deleted manually from the merged output. Further, genes where <75% of the studies agreed on up-or down-regulation were excluded. P-values were calcu-lated for the remaining 25 groups and 14 different heart dis-ease conditions (for detailed information see Table 1). It may be considered to separate/exclude certain disease groups, but here we exemplarily performed statistics on the complete data. Statistical analysis took ~10 minutes to process.
[image:4.595.59.538.86.481.2]For example, we found a highly significant down-regulation of the beta 1 adrenergic receptor (ADRB1) in 19/21 groups, which is well known for its crucial role in heart function and down-regulation in heart failure [36-38]. Other interesting candidates for in depth ana-lysis were predicted, like P2Y receptor subunits, a recep-tor class expressed in various heart cells and regulating cardiovascular function in health and disease [39-46]. We also found a high significance for sphingosine-1-phospate receptor 3 (S1PR3) being down-regulated in 14/14 groups. Other S1PRs were differentially expressed with lower significances. S1PRs have multiple functions in the cardiovascular system including modulation of the heart rate, cardioprotection and vascular contraction [47-54]. A third interesting candidate among the ten most significantly regulated class A GPCRs is the prostaglandin E receptor 3 (PTGER3) in 21/22 groups. Activation of PTGER3 was shown to protect cardiomyocytes from oxi-dative stress [55] and reduce ischemia-induced arrhyth-mias and infarct size [56]. Overexpression was shown to promote hypertrophy [57] and changes in EP3 receptor density were reported after occlusion of the left anterior descending coronary artery [58]. These results exemplify how ADE can be utilized to quickly compare expression data as a starting point for further research. In summary, our analysis of diverse datasets from different heart disease groups strongly suggests that a substantial amount of class A GPCRs are significantly regulated.
Conclusions
We introduce an easy-to-use software tool to extract and analyze normalized expression data. This program provides researchers with a tool to analyze gene array data utilizing publicly available normalized expression data. Beyond this scope, far more sophisticated tools (cited above) may be used for more detailed analysis.
Troubleshooting
– Be sure to use“.”as decimal separators.
– Avoid duplicate gene names in“Genes of Interest. txt”.
– If ADE reports that it can’t open a file, be sure the format of files is correct (.txt), and/or use sample files provided to test.
– Moving Data folders between Mac and Windows systems may cause problems. Be sure to:
○Delete the complete“Refined Data”and
“Extracted Data”folders.
○Check the Data Folder names, special characters
may cause problems.
Availability and requirements
Project name:Array Data Extractor (ADE)
Project home page: Software and sample data is in-cluded in the supplement. Webpage will be designed upon publication.
[image:5.595.57.541.101.323.2]Operating systems:Mac OS X, Windows, and Linux
Table 1 Class A GPCRs significantly regulated in human heart disease
Gene p-value +/− Gene p-value +/− Gene p-value +/−
P2RY13 0.00E + 00 + NPBWR1 7.37E-08 - GPR78 3.46E-05
-P2RY14 0.00E + 00 + PTGER2 7.82E-08 - HCRTR2 5.29E-05 +
S1PR3 9.04E-52 - P2RY12 7.98E-08 + S1PR2 6.57E-05
-GPR4 2.80E-31 - GPR3 9.09E-08 - OPN3 7.01E-05
-P2RY2 3.08E-30 - CMKLR1 1.07E-07 + F2RL1 1.07E-04
-ADRB1 7.41E-21 - LPAR3 1.50E-07 - HTR7 1.37E-04
-MRGPRF 5.41E-19 - P2RY11 1.68E-07 - S1PR4 1.50E-04
-C5AR1 3.34E-14 - TAAR1 1.21E-06 - GPR171 1.93E-04 +
PTGER3 3.91E-13 - GPR84 1.25E-06 - MRGPRX2 2.40E-04
-GPR34 1.94E-12 + GALR2 1.64E-06 - GPR37L1 4.36E-04
-CXCR4 1.77E-11 + GPR161 2.88E-06 - HRH2 4.47E-04
-DARC 3.48E-10 - RXFP3 3.60E-06 - CCR2 7.51E-04
-LTB4R 2.98E-09 - TSHR 5.54E-06 - BDKRB1 7.96E-04
-FPR2 6.92E-09 - ADRA1B 7.49E-06
-HTR2B 3.19E-08 + P2RY6 8.14E-06
Programming language:LabVIEW (National Instruments) Other requirements:LabVIEW (National Instruments) License:GNU
Additional file
Additional file 1:Contains a text file describing how the files have to be formatted, aswell as the program and sample files.Sample files include three data files downloaded from the GEO database [30,31]. With these files ADE can be directly tested without further modification.
Competing interests
The authors declare that they have no competing interests.
Authors’contributions
Stefan Kurtenbach developed ADE. Sarah Kurtenbach validated program output and helped with the manuscript preparation. GZ helped with study design and manuscript preparation. All authors read and approved the final manuscript.
Received: 25 July 2013 Accepted: 26 November 2013 Published: 1 December 2013
References
1. Edgar R:Gene Expression Omnibus: NCBI gene expression and hybridization array data repository.Nucleic Acids Res2002,30:207–210. 2. Parkinson H, Kapushesky M, Kolesnikov N, Rustici G, Shojatalab M,
Abeygunawardena N, Berube H, Dylag M, Emam I, Farne A, Holloway E, Lukk M, Malone J, Mani R, Pilicheva E, Rayner TF, Rezwan F, Sharma A, Williams E, Bradley XZ, Adamusiak T, Brandizi M, Burdett T, Coulson R, Krestyaninova M, Kurnosov P, Maguire E, Neogi SG, Rocca-Serra P, Sansone S-A,et al:Array Express update–from an archive of functional genomics experiments to the atlas of gene expression.Nucleic Acids Res2009, 37:D868–D872.
3. Sherlock G:The stanford microarray database.Nucleic Acids Res2001,29:152–155. 4. Baker M:Gene data to hit milestone.Nature2012,487:282–283. 5. Gentleman RC, Carey VJ, Bates DM, Bolstad B, Dettling M, Dudoit S, Ellis B,
Gautier L, Ge Y, Gentry J, Hornik K, Hothorn T, Huber W, Iacus S, Irizarry R, Leisch F, Li C, Maechler M, Rossini AJ, Sawitzki G, Smith C, Smyth G, Tierney L, Yang JYH, Zhang J:Bioconductor: open software development for computational biology and bioinformatics.
Genome Biol2004,5:R80.
6. Saeed AI, Sharov V, White J, Li J, Liang W, Bhagabati N, Braisted J, Klapa M, Currier T, Thiagarajan M, Sturn A, Snuffin M, Rezantsev A, Popov D, Ryltsov A, Kostukovich E, Borisovsky I, Liu Z, Vinsavich A, Trush V, Quackenbush J: TM4: a free, open-source system for microarray data management and analysis.Biotechniques2003,34:374–378.
7. Reich M, Liefeld T, Gould J, Lerner J, Tamayo P, Mesirov JP:GenePattern 2.0.Nat Genet2006,38:500–501.
8. Xia J, Fjell CD, Mayer ML, Pena OM, Wishart DS, Hancock REW:INMEX–a web-based tool for integrative meta-analysis of expression data.Nucleic Acids Res2013,41:W63–W70.
9. Tseng GC, Ghosh D, Feingold E:Comprehensive literature review and statistical considerations for microarray meta-analysis.Nucleic Acids Res
2012,40:3785–3799.
10. Chan GC-Y, Hieftje GM:A LabVIEW program for determining confidence intervals of Abel-inverted radial emission profiles.Spectrochim Acta B At Spectrosc2005,60:1486–1501.
11. Kim DJ, Fisk Z:A LabVIEW based template for user created experiment automation.Rev Sci Instrum2012,83:123705.
12. Wrobel P, Czyzycki M, Furman L, Kolasinski K, Lankosz M, Mrenca A, Samek L, Wegrzynek D:LabVIEW control software for scanning micro-beam X-ray fluorescence spectrometer.Talanta2012,93:186–192.
13. Stewart CM, Newlands SD, Perachio AA:Spike detection, characterization, and discrimination using feature analysis software written in LabVIEW.
Comput Methods Programs Biomed2004,76:239–251.
14. Topal T, Polat H, Güler I:Software development for the analysis of heartbeat sounds with LabVIEW in diagnosis of cardiovascular disease.
J Med Syst2008,32:409–421.
15. Chen SC, Shao CL, Liang CK, Lin SW, Huang TH, Hsieh MC, Yang CH, Luo CH, Wuo CM:A text input system developed by using lips image recognition based LabVIEW for the seriously disabled.Conf Proc IEEE Eng Med Biol Soc2004,7:4940–4943.
16. Cassidy SC, Teitel DF:Left ventricular pressure and volume data acquisition and analysis using LabVIEW.Comput Biol Med1997,27:141–149. 17. Jackson ME, Gnadt JW:Numerical simulation of nonlinear feedback
model of saccade generation circuit implemented in the LabView graphical programming language.J Neurosci Methods1999,87:137–145. 18. Reitz FB, Pollack GH:Labview virtual instruments for calcium buffer
calculations.Comput Methods Programs Biomed2003,70:61–69. 19. Liu Z-P, Zhang X-S:Effects of multiple probesets in affymetrix geneChips
on identifying differentially expressed genes in iPS cells.In Lect Notes Oper Res2010,13:187–195.
20. Stouffer SA, Suchman EA, Devinney LC, Star SA, Williams RM Jr:The American soldier: Vol 1: Adjustment during army life. Studies in Social Psychology in World War II.Princeton University Press; 1949:1. 21. Fisher RA:Statistical Mathods for Research Workers.4th edition. London:
Oliver and Boyd; 1932. ISBN 0050021702.
22. Fundel K, Küffner R, Aigner T, Zimmer R:Normalization and gene p-value estimation: issues in microarray data processing.Bioinform Biol Insights
2008,2:291–305.
23. Chen Z:Is the weighted z-test the best method for combining probabilities from independent tests?J Evol Biol2011,24:926–930. 24. Whitlock MC:Combining probability from independent tests: the
weighted Z-method is superior to Fisher’s approach.J Evol Biol2005, 18:1368–1373.
25. Li J, Tseng GC:An adaptively weighted statistic for detecting differential gene expression when combining multiple transcriptomic studies.
Ann Appl Stat2011,5:994–1019.
26. Salazar N, Chen J, Rockman H:Cardiac GPCRs: GPCR signaling in healthy and failing hearts.Biochim Biophys Acta2007,1768:1006–1018. 27. Tang C-M, Insel PA:GPCR expression in the heart;“new”receptors in
myocytes and fibroblasts.Trends Cardiovasc Med2004,14:94–99. 28. Kang M, Chung KY, Walker JW:G-protein coupled receptor signaling in
myocardium: not for the faint of heart.Physiology (Bethesda)2007, 22:174–184.
29. Sharman JL, Benson HE, Pawson AJ, Lukito V, Mpamhanga CP, Bombail V, Davenport AP, Peters JA, Spedding M, Harmar AJ:IUPHAR-DB: updated database content and new features.Nucleic Acids Res2013, 41:D1083–D1088.
30. Barth AS, Kuner R, Buness A, Ruschhaupt M, Merk S, Zwermann L, Kääb S, Kreuzer E, Steinbeck G, Mansmann U, Poustka A, Nabauer M, Sültmann H: Identification of a common gene expression signature in dilated cardiomyopathy across independent microarray studies.J Am Coll Cardiol
2006,48:1610–1617.
31. Wittchen F, Suckau L, Witt H, Skurk C, Lassner D, Fechner H, Sipo I, Ungethüm U, Ruiz P, Pauschinger M, Tschope C, Rauch U, Kühl U, Schultheiss H-P, Poller W:Genomic expression profiling of human inflammatory cardiomyopathy (DCMi) suggests novel therapeutic targets.
J Mol Med2007,85:257–271.
32. Kittleson MM, Minhas KM, Irizarry RA, Ye SQ, Edness G, Breton E, Conte JV, Tomaselli G, Garcia JGN, Hare JM:Gene expression analysis of ischemic and nonischemic cardiomyopathy: shared and distinct genes in the development of heart failure.Physiol Genomics2005,21:299–307. 33. Gaertner A, Schwientek P, Ellinghaus P, Summer H, Golz S, Kassner A, Schulz
U, Gummert J, Milting H:Myocardial transcriptome analysis of human arrhythmogenic right ventricular cardiomyopathy.Physiol Genomics2012, 44:99–109.
34. Schwientek P, Ellinghaus P, Steppan S, D’Urso D, Seewald M, Kassner A, Cebulla R, Schulte-Eistrup S, Morshuis M, Röfe D, El Banayosy A, Körfer R, Milting H:Global gene expression analysis in nonfailing and failing myocardium pre- and postpulsatile and nonpulsatile ventricular assist device support.Physiol Genomics2010,42:397–405.
35. Hannenhalli S, Putt ME, Gilmore JM, Wang J, Parmacek MS, Epstein JA, Morrisey EE, Margulies KB, Cappola TP:Transcriptional genomics associates FOX transcription factors with human heart failure.Circulation2006, 114:1269–1276.
37. Port JD, Bristow MR:Altered beta-adrenergic receptor gene regulation and signaling in chronic heart failure.J Mol Cell Cardiol2001, 33:887–905.
38. Homcy CJ, Vatner SF, Vatner DE:Beta-adrenergic receptor regulation in the heart in pathophysiologic states: abnormal adrenergic
responsiveness in cardiac disease.Annu Rev Physiol1991,53:137–159. 39. Kennedy C, Chootip K, Mitchell C, Syed N-H, Tengah A:P2X and P2Y
nucleotide receptors as targets in cardiovascular disease.Future Med Chem2013,5:431–449.
40. Chen J-B, Liu W-J, Che H, Liu J, Sun H-Y, Li G-R:Adenosine-5’-triphosphate up-regulates proliferation of human cardiac fibroblasts.Br J Pharmacol
2012,166:1140–1150.
41. Cheung K-K, Ryten M, Burnstock G:Abundant and dynamic expression of G protein-coupled P2Y receptors in mammalian development.Dev Dyn
2003,228:254–266.
42. Hou M, Malmsjö M, Möller S, Pantev E, Bergdahl A, Zhao XH, Sun XY, Hedner T, Edvinsson L, Erlinge D:Increase in cardiac P2X1-and P2Y2-receptor mRNA levels in congestive heart failure.Life Sci1999, 65:1195–1206.
43. Musa H, Tellez JO, Chandler NJ, Greener ID, Maczewski M, Mackiewicz U, Beresewicz A, Molenaar P, Boyett MR, Dobrzynski H:P2 purinergic receptor mRNA in rat and human sinoatrial node and other heart regions.Naunyn Schmiedebergs Arch Pharmacol2009,379:541–549.
44. Nishida M, Sato Y, Uemura A, Narita Y, Tozaki-Saitoh H, Nakaya M, Ide T, Suzuki K, Inoue K, Nagao T, Kurose H:P2Y6 receptor-Galpha12/13 signalling in cardiomyocytes triggers pressure overload-induced cardiac
fibrosis.EMBO J2008,27:3104–3115.
45. Ralevic V, Burnstock G:Involvement of purinergic signaling in cardiovascular diseases.Drug News Perspect2003,16:133–140. 46. Talasila A, Germack R, Dickenson JM:Characterization of P2Y receptor
subtypes functionally expressed on neonatal rat cardiac myofibroblasts.
Br J Pharmacol2009,158:339–353.
47. Vessey DA, Li L, Honbo N, Karliner JS:Sphingosine 1-phosphate is an important endogenous cardioprotectant released by ischemic pre- and postconditioning.Am J Physiol Heart Circ Physiol2009,297:H1429–H1435. 48. Takuwa N, Ohkura S-I, Takashima S-I, Ohtani K, Okamoto Y, Tanaka T, Hirano
K, Usui S, Wang F, Du W, Yoshioka K, Banno Y, Sasaki M, Ichi I, Okamura M, Sugimoto N, Mizugishi K, Nakanuma Y, Ishii I, Takamura M, Kaneko S, Kojo S, Satouchi K, Mitumori K, Chun J, Takuwa Y:S1P3-mediated cardiac fibrosis in sphingosine kinase 1 transgenic mice involves reactive oxygen species.Cardiovasc Res2010,85:484–493.
49. Murakami A, Takasugi H, Ohnuma S, Koide Y, Sakurai A, Takeda S, Hasegawa T, Sasamori J, Konno T, Hayashi K, Watanabe Y, Mori K, Sato Y, Takahashi A, Mochizuki N, Takakura N:Sphingosine 1-phosphate (S1P) regulates vascular contraction via S1P3 receptor: investigation based on a new S1P3 receptor antagonist.Mol Pharmacol2010,77:704–713. 50. Knapp M:Cardioprotective role of sphingosine-1-phosphate.J Physiol
Pharmacol2011,62:601–607.
51. Wang S, Lin X, Wang L-Y, Ruan K-F, Feng Y, Li X-Y:A polysaccharides MDG-1 augments survival in the ischemic heart by inducing S1P release and S1P1 expression.Int J Biol Macromol2012,50:734–740.
52. Mendelson K, Zygmunt T, Torres-Vázquez J, Evans T, Hla T:Sphingosine 1-phosphate receptor signaling regulates proper embryonic vascular patterning.J Biol Chem2013,288:2143–2156.
53. Karliner JS:Sphingosine kinase and sphingosine 1-phosphate in cardioprotection.J Cardiovasc Pharmacol2009,53:189–197. 54. Gergely P, Nuesslein-Hildesheim B, Guerini D, Brinkmann V, Traebert M,
Bruns C, Pan S, Gray NS, Hinterding K, Cooke NG, Groenewegen A, Vitaliti A, Sing T, Luttringer O, Yang J, Gardin A, Wang N, Crumb WJ, Saltzman M, Rosenberg M, Wallström E:The selective sphingosine 1-phosphate receptor modulator BAF312 redirects lymphocyte distribution and has
species-specific effects on heart rate.Br J Pharmacol2012,167:1035–1047. 55. Shinmura K, Tamaki K, Sato T, Ishida H, Bolli R:Prostacyclin attenuates
oxidative damage of myocytes by opening mitochondrial ATP-sensitive K + channels via the EP3 receptor.Am J Physiol Heart Circ Physiol2005, 288:H2093–H2101.
56. Hohlfeld T, Meyer-Kirchrath J, Vogel YC, Schrör K:Reduction of infarct size by selective stimulation of prostaglandin EP(3)receptors in the reperfused ischemic pig heart.J Mol Cell Cardiol2000,32:285–296.
57. Meyer-Kirchrath J, Martin M, Schooss C, Jacoby C, Flögel U, Marzoll A, Fischer JW, Schrader J, Schrör K, Hohlfeld T:Overexpression of prostaglandin EP3 receptors activates calcineurin and promotes hypertrophy in the murine heart.Cardiovasc Res2009,81:310–318. 58. Hohlfeld T, Zucker TP, Meyer J, Schrör K:Expression, function, and
regulation of E-type prostaglandin receptors (EP3) in the nonischemic and ischemic pig heart.Circ Res1997,81:765–773.
doi:10.1186/1756-0500-6-496
Cite this article as:Kurtenbachet al.:Array data extractor (ADE): a LabVIEW program to extract and merge gene array data.BMC Research Notes20136:496.
Submit your next manuscript to BioMed Central and take full advantage of:
• Convenient online submission
• Thorough peer review
• No space constraints or color figure charges
• Immediate publication on acceptance
• Inclusion in PubMed, CAS, Scopus and Google Scholar
• Research which is freely available for redistribution