T E C H N I C A L N O T E
Open Access
Internal control genes for quantitative RT-PCR
expression analysis in mouse osteoblasts,
osteoclasts and macrophages
Alexandre S Stephens
*, Sebastien R Stephens and Nigel A Morrison
Abstract
Background:Real-time quantitative RT-PCR (qPCR) is a powerful technique capable of accurately quantitating mRNA expression levels over a large dynamic range. This makes qPCR the most widely used method for studying quantitative gene expression. An important aspect of qPCR is selecting appropriate controls or normalization factors to account for any differences in starting cDNA quantities between samples during expression studies. Here, we report on the selection of a concise set of housekeeper genes for the accurate normalization of quantitative gene expression data in differentiating osteoblasts, osteoclasts and macrophages. We implemented the use of geNorm, an algorithm that determines the suitability of genes to function as housekeepers by assessing expression stabilities. We evaluated the expression stabilities of 18S, ACTB, B2M, GAPDH, HMBS and HPRT1 genes.
Findings:Our analyses revealed that 18S and GAPDH were regulated during osteoblast differentiation and are not suitable for use as reference genes. The most stably expressed genes in osteoblasts were ACTB, HMBS and HPRT1 and their geometric average constitutes a suitable normalization factor upon which gene expression data can be normalized. In macrophages, 18S and GAPDH were the most variable genes while HMBS and B2M were the most stably expressed genes. The geometric average of HMBS and B2M expression levels forms a suitable normalization factor to account for potential differences in starting cDNA quantities during gene expression analysis in
macrophages. The expression stabilities of the six candidate reference genes in osteoclasts were, on average, more variable than that observed in macrophages but slightly less variable than those seen in osteoblasts. The two most stably expressed genes in osteoclasts were HMBS and B2M and the genes displaying the greatest levels of
variability were 18S and GAPDH. Notably, 18S and GAPDH were the two most variably expressed control genes in all three cell types. The geometric average of HMBS, B2M and ACTB creates an appropriate normalization factor for gene expression studies in osteoclasts.
Conclusion:We have identified concise sets of genes suitable to use as normalization factors for quantitative real-time RT-PCR gene expression studies in osteoblasts, osteoclasts and macrophages.
Background
The development of the skeleton and its maintenance during adulthood requires the stringent control of gene regulatory programs in response to physiological signals. These gene expression regulatory cascades operate in all the major cells of bone including the bone forming osteoblasts and the bone degrading osteoclasts [1]. Recent research on osteoblasts and osteoclasts has com-monly used quantitative gene expression analysis to
investigate the regulatory mechanisms which operate within them (e.g. [2-7]).
Real-time quantitative reverse transcriptase-PCR (qPCR) is a powerful technique that can accurately detect low abundance mRNAs [8]. qPCR is fast, effi-cient, does not require post-PCR processing and func-tions over a large dynamic range of starting cDNA quantities [9,10]. These qualities have made qPCR the method of choice for accurately quantifying gene expression levels [10]. However, qPCR can suffer from certain limitations which can lead to substantial variabil-ity in expression measures [11]. One of the most * Correspondence: [email protected]
School of Medical Science, Griffith University, Gold Coast, Queensland, Australia
important issues relates to the selection of appropriate normalization factors to account for any errors and dif-ferences generated through the multi-step process involved in producing cDNA [12]. Various strategies have been implemented for data normalization including normalizing to cell numbers, genomic DNA and RNA input [12]. Each of these methods suffers from limita-tions and their use in some circumstances could lead to inaccurate data normalization [12]. For example, nor-malizing to RNA can be problematic if limited amounts are available for quantitation. In addition, total RNA is predominantly composed of rRNA and is not always reflective of mRNA content due to imbalances between rRNA and mRNA levels [13]. Furthermore, use of RNA content, genomic DNA or cell numbers does not take into consideration the efficiency of reverse transcriptase during cDNA synthesis reactions.
The most common method for data normalization involves the use of internal control (housekeeper) genes [12]. Housekeeper genes are presumed to be constitu-tively expressed and should display stable expression under a variety of experimental conditions. However, there is mounting evidence to suggest that the expres-sion of internal reference genes may vary significantly under different experimental conditions opening the possibility that erroneous information could be gener-ated if data normalization is based on genes that them-selves are regulated [14-16]. An approach to circumvent the problems associated with potentially regulated inter-nal control genes is to assess the validity of candidate reference genes in specific experimental contexts.
Here, we have taken into consideration the potential problems associated with using non-validated control genes for quantitative gene expression analyses and have set out to identify suitable reference genes for the nor-malization of qPCR gene expression data in mouse osteoblasts, osteoclasts and macrophages. We evaluated a set of six reference genes: 18S, ACTB, B2M, GAPDH, HMBS and HPRT1. These genes were selected as they have been commonly used as internal controls for quan-titative gene expression analyses in published studies (e. g [17-20]) and encode for proteins or products that belong to distinct functional classes reducing the poten-tial that the genes might be co-regulated. The geNorm algorithm [21] was implemented to assess the expression stabilities of the six candidate genes and we have identi-fied concise sets of genes that constitute suitable nor-malization factors for gene expression studies in osteoblasts, osteoclasts and macrophages.
Results
Osteoblast, osteoclast and macrophage differentiation
Osteoblastic cells were generated through the ascorbic acid-induced differentiation of MC3T3-E1 preosteoblasts.
Differentiating cells were harvested for RNA extraction at various stages during the process. Figure 1A displays representative photos of osteoblasts stained with alizarin red S at the various time points used for the gene expres-sion analyses. The abundance of alizarin red S staining observed in late stage osteoblasts (days 16 and 19) indi-cated that the MC3T3-E1 cells differentiated into mature osteoblasts which produced extensively mineralized extracellular matrix. Macrophages and osteoclasts were differentiated from primary mouse bone marrow mono-cytes treated with macrophage colony stimulating factor (M-CSF) and M-CSF + Receptor activator of nuclear fac-tor kappa-B ligand (RANKL) respectively. Large, multi-nucleated cells with defined actin rings were clearly evident by four days of M-CSF + RANKL treatment indi-cating successful osteoclast formation. Figure 1B displays representative photos of the macrophages and osteoclasts used in the study.
PCR efficiencies (E)
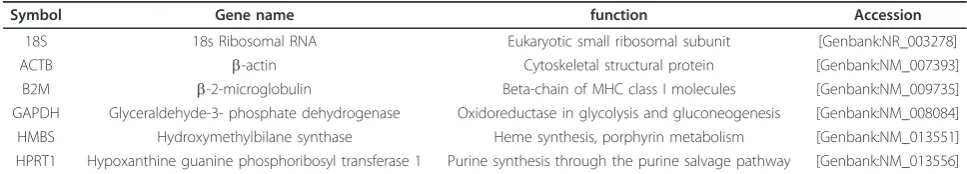
To identify reliable reference genes for qPCR expression analysis in osteoblasts, macrophages and osteoclasts, we evaluated the relative expression of six candidate genes: 18S, ACTB, B2M, GAPDH, HMBS and HPRT1 (table 1). We implemented the use of the ΔCT (difference between cycle threshold (CT) values) method to gener-ate relative expression data via the relationship (E+1)
-ΔCT
. Cycle threshold is defined as the cycle number at which the fluorescence intensity of a product during a PCR run exceeds the fluorescence intensity threshold level. The threshold level is commonly set just above background fluorescence intensity at a level that falls within the exponential phase of the amplification curve. In order for theΔCT method to provide the most accu-rate relative gene expression data, the PCR efficiencies of the genes from which the ΔCTs are calculated need to be equal. To this end, we used a 3-fold dilution series covering a three to four log dynamic range to generate standard curves. PCR efficiencies were calculated for each primer pairs (table 2) and ranged from 94-96%. The R2 values for the standard curves of the candidate genes were ≥ 0.99 (table 2) reflecting high precision. PCR efficiency is a function of standard curve regression slope (b) and the comparison of the multiple regression slopes via the global F-test revealed there were no sig-nificant differences between the candidate genes (p-value = 0.985) indicating equal PCR efficiencies.
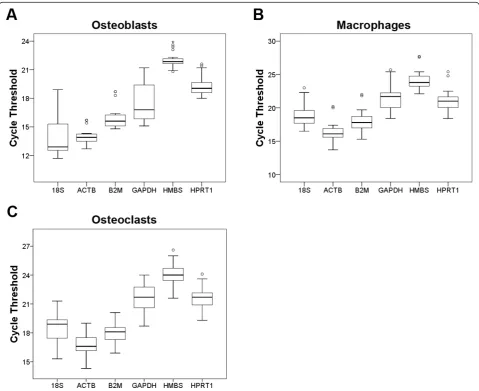
Expression profiling of candidate reference genes
distribution of the CT values provides a global represen-tation of the variation in reference gene expression while also providing information on their relative abun-dances. More highly expressed genes are associated with lower CT values and the rank-order of most abundantly to least abundantly expressed genes in the three cell types were very similar. In macrophages and osteoclasts, the order of abundance from high to low was ACTB, B2M, 18S, GAPDH, HPRT1 and HMBS. In osteoblasts, the rank-order of abundance was 18S, ACTB, B2M, GAPDH, HPRT1 and HMBS.
geNorm stability analysis
In order to identify suitable internal control genes for the normalization of quantitative gene expression data in mouse osteoblasts, osteoclasts and macrophages, we assessed the expression stabilities of six candidate genes using geNorm. The premise of geNorm is to determine the most stably expressed genes by calculat-ing the average pair-wise variation in the log2 trans-formed expression ratios between one particular candidate gene and all other candidate genes. This process is repeated for all candidate genes and the most stable genes are those with the smallest average
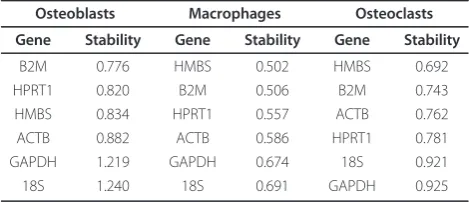
pair-wise variation. Table 3 shows the ranking of the candidate genes according to their expression stabili-ties. The stability values represent the average standard deviation of the CT differences between each gene and all other genes. In osteoblasts, stability values ranged from 0.776 to 1.240 with 18S being the least stably expressed and B2M displaying the greatest expression stability. The stability values in macrophages and osteoclasts were slightly smaller compared to osteo-blasts indicating greater overall expression stability of the panel of genes. The most stably expressed gene in macrophages and osteoclasts was HMBS whereas the most variable genes were 18S for macrophages and GAPDH for osteoclasts.
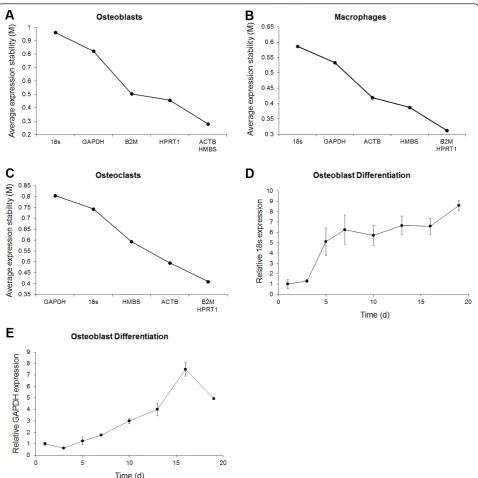
[image:3.595.57.540.89.232.2]Figure 3 displays the average expression stability values (M) of all control genes and of the remaining control genes after each sequential removal of the most variable gene for the different cell types. The figure also displays the rank-order of gene expression stabilities. For each of the groups, M displayed a consistent decline with each removal of the most variable gene. Notably, the rank-orders of stabilities in figure 3A-C are slightly different to that listed in table 3. This reflects the differ-ent methods in which the stability values were
[image:3.595.55.539.642.729.2]Figure 1Osteoblast, osteoclast and macrophage differentiation. (A) MC3T3-E1 cells were seeded in 24-well culture plates and induced to differentiate into osteoblasts via the addition of medium containing 50μg/ml ascorbic acid and 10 mMb-glycerophosphate. Cells were harvested at various time points throughout differentiation for gene expression studies. The figure represents MC3T3-E1 cells at various stages during the developmental process. The cells were stained with Alizarin Red S which is retained by mineralized extracellular matrix. (B) Bone marrow derived monocytes were seeded in 24-well culture plates and induced to differentiate into macrophages or osteoclasts via the addition of M-CSF or M-CSF + RANKL respectively. The figure displays representative photos of the macrophages and osteoclasts used in the study. The cells were stained with rhodamine phalloidin (F-actin stain) and DAPI (nucleic acid stain).
Table 1 Candidate reference gene symbols, names, functions and Genbank accession numbers
Symbol Gene name function Accession
18S 18s Ribosomal RNA Eukaryotic small ribosomal subunit [Genbank:NR_003278]
ACTB b-actin Cytoskeletal structural protein [Genbank:NM_007393]
determined: in table 3, expression stability values were calculated using data from all control genes and the expression stability values for each individual gene was listed; in the figures, the rank-order of stabilities was determined by calculating the average expression
[image:4.595.55.539.112.207.2]stability values of all remaining genes after the sequen-tial removal of the most variable genes. Ultimately, the figure-based method identifies the subset of genes that are the most correlated and have the highest expression stability values.
Table 2 Candidate reference gene PCR primer sequences (5’-3’), amplicon sizes, PCR efficiencies and standard curve regression coefficients
Symbol Forward primer Reverse primer Amplicon size (bp)
PCR efficiency (E)
Regression coefficient (R2)
18S CTTAGAGGGACAAGTGGCG ACGCTGAGCCAGTCAGTGTA 107 95% 0.9947
ACTB CTCTGGCTCCTAGCACCATGAAGA GTAAAACGCAGCTCAGTAACAGTCCG 200 94% 0.9975
B2M CTGCTACGTAACACAGTTCCACCC CATGATGCTTGATCACATGTCTCG 241 96% 0.9986
GAPDH ACAGTCCATGCCATCACTGCC GCCTGCTTCACCACCTTCTTG 266 95% 0.9981
HMBS GAGTCTAGATGGCTCAGATAGCATGC CCTACAGACCAGTTAGCGCACATC 250 94% 0.9962
[image:4.595.58.538.304.695.2]HPRT1 GAGGAGTCCTGTTGATGTTGCCAG GGCTGGCCTATAGGCTCATAGTGC 173 95% 0.9943
Osteoblasts displayed the highest initial M reflecting an overall increased variability compared to macro-phages and osteoclasts. Notably, the osteoblast M dropped dramatically after the removal of the two most variable genes, 18S and GAPDH, and suggested these genes were highly variable or potentially regulated. To explore these possibilities, we plotted the relative expression of 18S and GAPDH throughout osteoblast differentiation using a normalization factor derived from the geometric average of ACTB, B2M, HMBS and HPRT1 (figures 3D-E). The plots showed that 18S and GAPDH expression increased over time indicating the genes were regulated throughout osteoblast differentia-tion. As such, both 18S and GAPDH would be unsuita-ble to use as internal control genes in osteoblasts. Macrophage and osteoclast samples also displayed con-siderable decreases in M after the sequential removal of the two most variable genes (figures 3B-C) which were also 18S and GAPDH. However, unlike osteoblasts, 18S and GAPDH expression levels in macrophages and osteoclasts did not change dramatically over time and the fold change in expression at days 2-5 relative to day 1 stayed within 2-fold (data not shown). These results suggested that the heightened variability of 18S and GAPDH genes in macrophage and osteoclast samples was not due to differential expression over time but a consequence of broader basal expression levels.
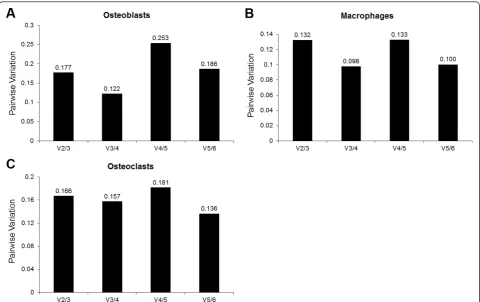
The determination of the optimal number of house-keeper genes for each of the cell types is shown in figure 4. The figure displays the pairwise variation between the preceding normalization factor (NFn) and the current normalization factor (NFn+1) which differs from NFn by including the next most stably expressed gene in the calculation of the normalization factor. Essentially, the point at which the inclusion of an additional reference gene in the calculation of the NFn+1 only imposes a marginal change compared to NFn determines the opti-mal number of genes required. Vandesompeleet al[21] suggested this point was reached when the pairwise var-iation fell below 0.15. Based on this cut-off, the opti-mum number of housekeeper genes required for the normalization of qPCR data is three for osteoblasts, two
for macrophages and six for osteoclasts. However, for osteoclasts, the pairwise variation between the third and fourth normalization factors was a borderline value of 0.157. Thus, the geometric average of the three most stably expressed genes would most likely be sufficient for use as a normalization factor. Based on the determi-nation of the optimal number of housekeeper genes, the constituents of the normalization factors for each cell type were determined. These genes consisted of ACTB, HMBS and HPRT1 in osteoblasts; B2M and HPRT1 in macrophages; and of ACTB, B2M and HPRT1 in osteoclasts.
Discussion
We have assessed the expression of six candidate refer-ence genes in osteoblasts, osteoclasts and macrophages and have identified the most suitable set of these genes to use for the accurate normalization of qPCR gene expression data in these cells. Our investigation imple-mented use of the geNorm algorithm which identifies appropriate housekeepers by determining which genes are the most stably expressed. The reliability and repro-ducibility of qPCR gene expression studies is highly dependent upon the selection of appropriate house-keeper genes or NFs to accurately adjust for differences in starting cDNA quantities between samples. Biological variation in the NF will inherently be transferred to gene expression data and thus the need to minimise this variation is important for producing reliable results. GeNorm provides a platform upon which to identify sta-bly expressed genes and thus minimise the variation within NFs.
[image:5.595.56.291.111.212.2]Our implementation of the geNorm algorithm evalu-ated the suitability of 18S, ACTB, B2M, GAPDH, HMBS and HPRT1 as potential reference genes. In osteoblasts, ACTB, HMBS, HPRT1 and B2M displayed the smallest amounts of expression variability (most stably expressed) and thus were flagged as being the most suitable for use in the calculation of a potential NF. The expression sta-bilities of ACTB, HMBS, HPRT1 and B2M ranged from 0.776 to 0.882 and indicated that the average standard deviation of the CT differences between each gene and all other (five) genes was less than one cycle. The mag-nitude of the expression variability attributable to factors other than biological sources such as pipetting errors and thermal cycler inconsistencies can be estimated by determining the variation in replicate samples. For our SYBR green based qPCR assay, this quantity was deter-mined to be 0.243 cycles (data not shown). Not surpris-ingly, this quantity was smaller than the expression stabilities of ACTB, HMBS, HPRT1 and B2M and sug-gested that additional (biological) variability contributed to the expression stability values. Hypothetically, 0.243 would be the minimum gene expression stability value Table 3 Expression stability values of candidate reference
genes according to geNorm
Osteoblasts Macrophages Osteoclasts
Gene Stability Gene Stability Gene Stability
B2M 0.776 HMBS 0.502 HMBS 0.692
HPRT1 0.820 B2M 0.506 B2M 0.743
HMBS 0.834 HPRT1 0.557 ACTB 0.762
ACTB 0.882 ACTB 0.586 HPRT1 0.781
GAPDH 1.219 GAPDH 0.674 18S 0.921
we could expect to obtain in the situation where all genes used in the calculations were perfectly correlated. Using this minimum value, we can estimate the contri-bution that biological variation makes towards the expression stability values by calculating the difference between the stability values and 0.243; thus for ACTB, HMBS, HPRT1 and B2M, biological variation accounted
[image:6.595.59.538.86.564.2]for between 0.533 to 0.639 cycles which represented 69-72% of the total stability values. GAPDH and 18S showed greater expression variability than ACTB, HMBS, HPRT1 and B2M and were regulated through-out differentiation. As such, these genes would not be suitable to use for the normalization of gene expression data in MC3T3-E1 osteoblasts. Accordingly, the
Figure 3Average expression stability values in osteoblasts, macrophages and osteoclasts and expression profiling of 18S and GAPDH during osteoblast differentiation. qPCR gene expression analyses were carried out on cDNA derived from differentiating osteoblasts,
determination of the optimal number of candidate genes to include in the calculation of the NF does not incor-porate either GAPDH or 18S. Rather, geNorm indicated that a NF based on the geometric average of ACTB, HMBS and HPRT1 would be sufficient to control for differences in starting cDNA quantities between samples.
In osteoclasts, ACTB, B2M, HMBS and HPRT1 were also the most stably expressed genes leaving 18S and GAPDH as the most variably expressed. On average, the stability values of the candidate reference genes in osteo-clasts were smaller in magnitude compared to those observed in osteoblasts indicating greater overall expres-sion stabilities. The estimation of the contribution of bio-logical variation towards the stability values of ACTB, B2M, HMBS and HPRT1 in osteoclasts ranged between 0.449 and 0.538 cycles representing 65-69% of the total stability values. The determination of the optimal num-ber of control genes for the normalization of osteoclast gene expression data indicated that three genes were suf-ficient. These genes were ACTB, B2M and HPRT1 and their geometric average constitutes the NF.
The magnitudes of the stability values of the candidate internal control genes in differentiating macrophages were consistently the smallest out the of the three cell types tested. However, just like osteoblasts and osteo-clasts, ACTB, B2M, HMBS and HPRT1 were again the most stably expressed genes. Biological variation accounted for between 52-59% of the total stability values derived for these genes. Analysis of the pair-wise variation between consecutive NFs revealed the geo-metric average of B2M and HPRT1 would be sufficient to constitute a normalization factor to account for any differences in starting cDNA quantities for gene expres-sion studies in macrophages.
Conclusion
[image:7.595.58.539.88.390.2]We have investigated the expression stabilities of six candidate reference genes in osteoblasts, osteoclasts and macrophages. Our analysis has identified concise sets of genes that could be used for the accurate normalization of qPCR data in these cells. For osteoblasts, the geo-metric average of ACTB, HMBS and HPRT1 was deter-mined to be a suitable combination of genes to
constitute a NF for gene expression studies. In osteo-clasts, the grouping of ACTB, B2M and HPRT1 were determined to form a reliable NF to normalize gene expression data. The combination of B2M and HPRT1 established a suitable NF for gene expression studies in macrophages.
Materials and methods
Tissue culture
MC3T3-E1 cells (sub clone 14) were maintained in
Minimum Essential Medium (MEM) aMedium
(Invi-trogen) containing 10% Fetal Bovine Serum (Invi(Invi-trogen), 1% Penicillin/Streptomycin solution (Invitrogen) and 1 mM Sodium Pyruvate (Invitrogen). For osteoblast differ-entiation, cells were seeded in 24-well culture plates at a density of 2.5 × 10⁴ cells in a total volume of 0.5 ml of standard medium per well. 48 hours post-seeding, the medium was changed with fresh medium containing 50 μg/ml ascorbic acid (AA) and 10 mM beta-glyceropho-sphate (osteogenic medium). Medium was changed every 72 hours. For osteoblast differentiation time course, MC3T3-E1 cells were harvested 1, 3, 5, 7, 10, 13, 16 and 19 days post-addition of osteogenic medium. The number of samples per time point was three (total n = 24). Mouse bone marrow monocytes (BMMs) were prepared from bone marrow of 4 to 6 week-old C57BL/ 6 mice. Briefly, femurs and tibias were extracted from sacrificed mice and excess tissue was removed from the bones by scraping. The epiphyses were removed and the marrow cavities were flushed out with complete
med-ium (Minimum Essential Medmed-ium (MEM) a Medium
(Invitrogen) containing 10% Fetal Bovine Serum (Invi-trogen), 1% Penicillin/Streptomycin solution (Invitro-gen)) using a 26G needle. Bone marrow cells (BMCs) were recovered via centrifugation and seeded into cul-ture vessels for 24 hours in complete medium contain-ing 5 ng/ml M-CSF (Peprotech). Non-adherent BMCs were collected and seeded into culture vessels for a further 48 hours in complete medium containing 30 ng/ ml M-CSF to generate BMMs. For macrophage and osteoclast differentiation, BMMs were seeded in 24-well culture plates at a density of 3 × 10⁴cells/well in a total volume 0.5 ml of complete medium containing 30 ng/ ml M-CSF. Osteoclasts were generated via the addition of RANKL (Peprotech) to a final concentration of 35 ng/ml. A full medium change was performed on day 3 and cells were harvested on days 1, 2, 3, 4 and 5 post-initiation of differentiation for RNA extraction. A total of 20 samples (n = 4 per time point) for each macro-phages and osteoclasts were used in the study. Proce-dures involving mice were approved by the animal ethics committee of Griffith University and the study had the approval of the ethics committee of Griffith University.
Cell staining
MC3T3-E1 cells were stained with Alizarin Red S for detection of extracellular matrix mineralization. For staining, MC3T3-E1 cells were washed with one volume of PBS and fixed with 3.7% formaldehyde in PBS for 15 min. Fixed cells were washed twice with dH2O and incubated with 200μl of 40 mM Alizarin Red S, pH 4.1 with gentle shaking for 20 min. The dye solution was removed and cells were washed four times with 1.5 ml dH2O with gentle shaking for 5 min per wash prior to photography. Mature macrophages and osteoclasts (day 5) were stained with rhodamine phalloidin (F-actin labelling, Invitrogen) and 4’,6-diamidino-2-phenylindole, dihydrochloride (DAPI, nucleic acid stain, Invitrogen). For staining, cells were fixed with 3.7% formaldehyde in PBS for 15 min. The fixing solution was removed and cells were washed two times with PBS. The cells were then solubilized with the addition of 0.1% Triton X-100 solution in PBS for 10 min. The Triton X-100 solution was discarded and the cells were washed three times with PBS prior to the addition of rhodamine phalloidin and DAPI staining solutions according to the manufac-turer’s instructions. The staining solution was removed and the cells were washed three times with PBS. Cells were left in PBS for fluorescence microscopy and photography.
RNA extraction and cDNA synthesis
RNA was extracted from cells using acid guanidinium thiocyanate-phenol-chloroform extractions [22]. The integrity of the extracted RNA was verified via agarose gel electrophoresis. Intact, high quality RNA was indi-cated by the presence of the two, bright 28S and 18S rRNA bands in ethidium bromide stained agarose gels visualized under UV light. For each sample, approxi-mately 1 μg of total RNA was treated with DNAse I (Sigma) to remove any residual DNA and converted to cDNA using the ImProm-II reverse transcription system (Promega) according to the manufacturer’s instructions. Reactions were carried out in 20 μl volumes and all cDNA samples were diluted 1:5 in DNAse-free water prior to real-time PCR.
Primers and qPCR
carried out in total volumes of 20 μl and included 250 nM of each primer and 2μl of diluted cDNA template containing 100 ng cDNA. The thermal cycler conditions were as follows: Step 1, 95°C for 2:30 min; Step 2, 95°C for 10 s, 59°C for 10 s and 72°C for 25 s (45 cycles); step 3, melt curve analysis from 59-95°C in 0.5°C incre-ments. The specificities of the PCR amplifications were assessed by the examination of the melt curves to con-firm the presence of single gene-specific peaks. For the generation of standard curves, PCR products were puri-fied through polyacrylamide gel electrophoresis. Resolved DNA bands were excised, crushed and eluted in 200 μl of pure water. Three-fold serial dilutions cov-ering a 3-4 log dynamic range of the eluted PCR pro-ducts was carried out and used as templates in real-time qPCR to generate standard curves.
Data analysis
qPCR data in the form of cycle thresholds (CT) was exported to Microsoft Excel and SPSS. Box and whisker plots displaying the CT distributions were generated in SPSS. For geNorm analysis, raw CT data was converted to relative gene expression data using the (E+1)-ΔCT transformation (where E is PCR efficiency). Gene stabi-lity values and the determination of the optimal number of control genes were elucidated by implementing the geNorm algorithm as previously described [21].
Abbreviations
qPCR: Real-time quantitative reverse transcriptase PCR; CT: Cycle threshold; 18S: 18s Ribosomal RNA; ACTB: Beta-actin; B2M: Beta-2-microglobulin; GAPDH: Glyceraldehyde-3- phosphate dehydrogenase; HMBS: Hydroxymethylbilane synthase; HPRT1: Hypoxanthine guanine phosphoribosyl transferase 1;
Acknowledgements and Funding
This work was supported by grants from the National Health and Medical Research Council of Australia (NAM).
Authors’contributions
ASS designed and performed the experiments, analyzed and interpreted the data and wrote the manuscript. SRS assisted in designing the experiments and contributed to the critical review of the manuscript. NAM designed the study, contributed to the interpretation of the data and drafted the manuscript. All authors have read and approved the final manuscript.
Competing interests
The authors declare that they have no competing interests.
Received: 18 July 2011 Accepted: 14 October 2011 Published: 14 October 2011
References
1. Karsenty G:The complexities of skeletal biology.Nature2003,423:316-318. 2. Brazier H, Stephens S, Ory S, Fort P, Morrison N, Blangy A:Expression
profile of RhoGTPases and RhoGEFs during RANKL-stimulated
osteoclastogenesis: identification of essential genes in osteoclasts.J Bone Miner Res2006,21:1387-1398.
3. Gordon JA, Tye CE, Sampaio AV, Underhill TM, Hunter GK, Goldberg HA: Bone sialoprotein expression enhances osteoblast differentiation and matrix mineralization in vitro.Bone2007,41:462-473.
4. Hassan MQ, Tare R, Lee SH, Mandeville M, Weiner B, Montecino M, van Wijnen AJ, Stein JL, Stein GS, Lian JB:HOXA10 controls osteoblastogenesis by directly activating bone regulatory and phenotypic genes.Mol Cell Biol2007,27:3337-3352.
5. Rauner M, Sipos W, Goettsch C, Wutzl A, Foisner R, Pietschmann P, Hofbauer LC:Inhibition of lamin A/C attenuates osteoblast differentiation and enhances RANKL-dependent osteoclastogenesis.J Bone Miner Res 2009,24:78-86.
6. Shin CS, Her SJ, Kim JA, Kim DH, Kim SW, Kim SY, Kim HS, Park KH, Kim JG, Kitazawa R,et al:Dominant negative N-cadherin inhibits osteoclast differentiation by interfering with beta-catenin regulation of RANKL, independent of cell-cell adhesion.J Bone Miner Res2005,20:2200-2212. 7. Wu M, Hesse E, Morvan F, Zhang JP, Correa D, Rowe GC, Kiviranta R, Neff L,
Philbrick WM, Horne WC, Baron R:Zfp521 antagonizes Runx2, delays osteoblast differentiation in vitro, and promotes bone formation in vivo. Bone2009,44:528-536.
8. Bustin SA:Absolute quantification of mRNA using real-time reverse transcription polymerase chain reaction assays.J Mol Endocrinol2000, 25:169-193.
9. Heid CA, Stevens J, Livak KJ, Williams PM:Real time quantitative PCR. Genome Res1996,6:986-994.
10. Van Guilder HD, Vrana KE, Freeman WM:Twenty-five years of quantitative PCR for gene expression analysis.Biotechniques2008,44:619-626. 11. Bustin SA:Quantification of mRNA using real-time reverse transcription
PCR (RT-PCR): trends and problems.J Mol Endocrinol2002,29:23-39. 12. Huggett J, Dheda K, Bustin S, Zumla A:Real-time RT-PCR normalisation;
strategies and considerations.Genes Immun2005,6:279-284. 13. Solanas M, Moral R, Escrich E:Unsuitability of using ribosomal RNA as
loading control for Northern blot analyses related to the imbalance between messenger and ribosomal RNA content in rat mammary tumors.Anal Biochem2001,288:99-102.
14. Dheda K, Huggett JF, Bustin SA, Johnson MA, Rook G, Zumla A:Validation of housekeeping genes for normalizing RNA expression in real-time PCR. Biotechniques2004,37:112-114, 116, 118-119.
15. Schmittgen TD, Zakrajsek BA:Effect of experimental treatment on housekeeping gene expression: validation by real-time, quantitative RT-PCR.J Biochem Biophys Methods2000,46:69-81.
16. Tricarico C, Pinzani P, Bianchi S, Paglierani M, Distante V, Pazzagli M, Bustin SA, Orlando C:Quantitative real-time reverse transcription polymerase chain reaction: normalization to rRNA or single housekeeping genes is inappropriate for human tissue biopsies.Anal Biochem2002,309:293-300.
17. Chamoux E, Bisson M, Payet MD, Roux S:TRPV-5 mediates a receptor activator of NF-kappaB (RANK) ligand-induced increase in cytosolic Ca2+ in human osteoclasts and down-regulates bone resorption.J Biol Chem 2010,285:25354-25362.
18. Kidd LJ, Stephens AS, Kuliwaba JS, Fazzalari NL, Wu AC, Forwood MR: Temporal pattern of gene expression and histology of stress fracture healing.Bone2010,46:369-378.
19. Knippenberg M, Helder MN, Zandieh Doulabi B, Wuisman PI, Klein-Nulend J: Osteogenesis versus chondrogenesis by BMP-2 and BMP-7 in adipose stem cells.Biochem Biophys Res Commun2006,342:902-908.
20. Mendonca G, Mendonca DB, Simoes LG, Araujo AL, Leite ER, Duarte WR, Aragao FJ, Cooper LF:The effects of implant surface nanoscale features on osteoblast-specific gene expression.Biomaterials2009,30:4053-4062. 21. Vandesompele J, De Preter K, Pattyn F, Poppe B, Van Roy N, De Paepe A, Speleman F:Accurate normalization of real-time quantitative RT-PCR data by geometric averaging of multiple internal control genes.Genome Biol2002,3:RESEARCH0034.
22. Chomczynski P, Sacchi N:Single-step method of RNA isolation by acid guanidinium thiocyanate-phenol-chloroform extraction.Anal Biochem 1987,162:156-159.
doi:10.1186/1756-0500-4-410