RESEARCH
Nonlinear relationship between serum uric
acid and body mass index: a cross-sectional
study of a general population in coastal China
Hui Zhou
2, Zhen Liu
3, Zhong Chao
1, Yeqing Chao
2, Lidan Ma
1, Xiaoyu Cheng
1, Yangang Wang
1, Changgui Li
1and Ying Chen
1*Abstract
Background: Conflicting evidence exists on the relationship between body mass index (BMI) and serum uric acid (SUA). Therefore, we aimed to evaluate the SUA–BMI relationship in a large-scale epidemiological survey in coastal China.
Methods: This survey was conducted among the general population in the coastal region of China from September
2014 to January 2015. SUA Levels were measured by the automatic Sysmex Chemix-180 biochemical analyzer.
Results: A total of 6098 men (BMI: 24.58 ± 3.74 kg/m2) and 7941 women (24.56
± 3.64 kg/m2) were included in this
study. A stronger positive BMI-SUA association was found for men than women (all P-values < 0.05). The piecewise lin-ear spline models indicated a U-shaped relationship of SUA-BMI association for both men and women; and the lowest turning points were at 19.12 kg/m2 for men and 21.3 kg/m2 for women. When BMIs were lower than the nadir point,
each 1 kg/m2 increase in BMI related to a 7.74-fold (95% CI
− 14.73, − 0.75) reduction for men and 2.70-fold reduction (− 4.47, − 0.94) for women in SUA levels. Once the BMI was higher than the nadir point, each 1 kg/m2 increase in BMI
was related to a 5.10-fold (4.44, 5.77) increment for men and 3.93-fold increment (3.42, 4.43) for women in SUA levels. The regression coefficient differences between the two stages were 12.84 (5.66, 20.03) for men and 6.63 (4.65, 8.61) for women.
Conclusions: A U-shaped relationship between BMI and SUA was found for both men and women; the association
was stronger for men than women.
Keywords: Uric acid, Serum, Body mass index, Cross-sectional studies, Epidemiology, China
© The Author(s) 2019. This article is distributed under the terms of the Creative Commons Attribution 4.0 International License (http://creat iveco mmons .org/licen ses/by/4.0/), which permits unrestricted use, distribution, and reproduction in any medium, provided you give appropriate credit to the original author(s) and the source, provide a link to the Creative Commons license, and indicate if changes were made. The Creative Commons Public Domain Dedication waiver (http://creativecommons.org/ publicdomain/zero/1.0/) applies to the data made available in this article, unless otherwise stated.
Background
As the end product of the metabolic breakdown of purine nucleotides [1], an increasing amount of research has indicated that the role of uric acid (UA) in metabolic syn-drome has changed from innocent bystander to central player [2] and UA plays a key role in the development of hypertension [3, 4], hyperglycemia [5], hyperlipidemia [6], and also obesity [7]. Obesity, a multiple organ-system disease with underlying metabolic abnormalities, is a
public health crisis and results in a huge economic bur-den [8, 9]. A series of cross-sectional studies suggested a positive association between serum uric acid (SUA) and body mass index (BMI) [10–13], which was demonstrated in a population-based longitudinal study [7]. However, limited data is available in the Chinese population.
In addition, several laboratory studies have suggested discrimination in the SUA-BMI association among differ-ent BMI levels [3, 14–16]. Our previous study also found that SUA and blood pressure (BP) might have a nonlinear, instead a simple linear, relationship [3]. Therefore, in this study, we used data from a large cross-sectional study in China to better understand the relationship between SUA and BMI, and additionally explore whether other
Open Access
*Correspondence: [email protected]
1 Department of Endocrinology and Metabolism, The Affiliated Hospital
of Qingdao University, 16 Jiangsu Road, Qingdao, Shandong 266003, China
metabolic factors may affect the relationship between SUA and BMI.
Methods
Study population
This is a population-based cross-sectional study among people in the coastal region of China, from August 2004 to December 2014. Participants were excluded if one of the following criteria were met: (I) medication use to lower weight, serum lipids, uric acid, blood sugar or blood pressure; (II) history of liver, severe renal, or heart diseases. A total of 14,039 participants (6098 males and 7941 females) met the criteria for enrollment in this study. The study protocol was approved by the ethics committee of the Affiliated Hospital of Qingdao Uni-versity and informed consent was obtained from each participant.
Data collection and measures
The participants’ demographic and lifestyle informa-tion were collected using a standard quesinforma-tionnaire by in-person interview, including current smoking sta-tus (smoker, never, past), alcohol consumption (never, moderate, heavy, past), and occupation type (light, moderate, heavy physical). BMI was calculated as weight (kg) per height squared (m2) and categorized
as: under-weight (BMI < 18.5 kg/m2), normal weight
(18.5 kg/m2≤ BMI < 24.9 kg/m2), overweight (25 kg/
m2≤ BMI < 29.9 kg/m2), and obesity (BMI ≥ 30 kg/m2).
For alcohol consumption in past 6 months, different from that used in the US and EU, heavy drinking was defined as equal as or greater than one time per week; and mod-erate drinking was defined as drinking at holiday and fes-tival days, averagely one time per month. For occupation types, the “light physical” jobs referred to those with sed-entary/desk job, such as official staffs, teachers and light physical houseworkers. Moderate physical work included students, gym teachers, and light physical farmworkers. And heavy physical works referred to the porter (work-ers who employed to help carry, ship or move luggage or other loads), construction workers, athletes, and so on. BP was measured with a standard mercury sphyg-momanometer, and subjects were required to rest for at least 15 min before BP measurement. All measurements of height, weight, and BP were carried out by the same group of seven professional physicians.
Elbow venous blood (5 mL) was extracted from all par-ticipants after fasting for at least 12 h. The fasting blood glucose (FBG), triglyceride (TG), total cholesterol (TC), creatinine, high/low-density lipoprotein cholesterol (H/LDL), and SUA levels of all blood specimens were examined by automatic Sysmex Chemix-180 biochemi-cal analyzer (Nanchang Micare Medibiochemi-cal Equipment Co.,
LTD, Jiangxi, China). Estimated glomerular filtration rate (eGFR) was calculated by the following formula: eGFR = 175 × (creatinine/88.4)−1.234× age−0.179× (0.79
for females). Hyperuricemia was diagnosed if SUA levels were higher than 420 µmol/L for men and postmenopau-sal women, and higher than 357 µmol/L for premenopau-sal women.
Statistical analyses
Previous studies suggested large differences in BMI and SUA among men and women; therefore, all analyses were separately applied to men and women. We calculated mean ± standard deviation (SD) and median (interquar-tile range) for frequency of participant characteristics, t-tests for normal distributions, Kruskal–Wallis tests for non-normal distributions, and Chi square tests were used to compare characteristic differences among men and women. We evaluated the possible linear and non-linear relationships between SUA and BMI by multivari-ate linear regression models and two-piece piecewise regression models adjusted for age, current alcohol con-sumption status, current smoking status, occupation type, systolic blood pressure (SBP), diastolic blood pres-sure (DBP), FBS (log transformed), eGFR, low density lipoprotein (LDL), and TC, among men and women. We further conducted stratified and interaction analyses to explore the potential modifier and interaction effects on the SUA-BMI association. Before these, covariate screen-ing was also performed among all variables included in Table 1 using univariate analysis. 93.7% of the partici-pants enrolled in our study had complete data, and only those participants with complete data were included in the analysis.
All statistical analyses were performed using Empower Stats software (X&Y Solutions, Inc., Boston, USA).
P < 0.05 was considered statistically significant.
Results
Characteristics of the participants
A total of 14,039 participants aged 48.24 ± 13.94 years, of
which 56.6% were women, met the criteria for enrollment and were included in the analyses. The overall mean level of SUA was 303.09 (± 87.50) μmol/L, which was
signifi-cantly higher among men (349.62 ± 85.30 μmol/L) than
women (267.37 ± 70.79 μmol/L). Hyperuricemia was
diagnosed in 10% of participants, and hyperuricemia prevalence was significantly lower among women (4.04%) than men (17.96%) (Table 1).
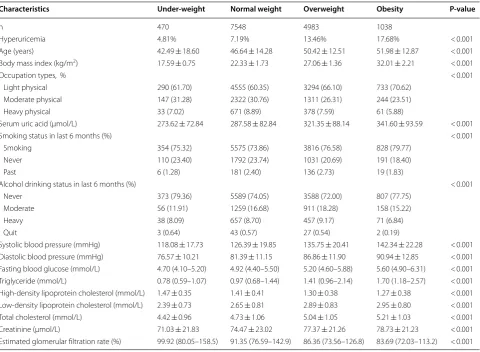
After stratification by BMI, SUA levels increased from 273.62 ± 72.84 μmol/L for under-weight participants to
341.60 ± 93.59 μmol/L for obese participants (Table 2).
healthy lifestyles, and higher SBP, DBP, fasting glucose and cholesterol levels (all P-values < 0.05).
Linear relationship between SUA and BMI
The linear regression models suggested a significant association between SUA and BMI in both men and women, after adjustment for age, current smoking status, current alcohol consumption status, occupa-tion types, SBP, DBP, FBS, LDL, TG, TC, and eGFR (all
P-values < 0.05). In women, SUA levels were significantly increased by 3.03 µmol/L (95% CI 2.60, 3.46 µmol/L) for each SD (3.74 kg/m2) increase in BMI. Similar results
were observed for men where SUA levels were elevated by 4.71 µmol/L (95% CI 4.08, 5.35 µmol/L) for each SD (3.51 kg/m2) increase in BMI (Table 3).
Nonlinear relationship between SUA and BMI
A U-shaped relationship between SUA and BMI was observed for both women and men by piecewise regres-sion model; and the estimated nadir point was 19.1 kg/m2
for men and 21.3 kg/m2 for women (Fig. 1 and Table 3).
For men, once the BMI was lower than 19.1 kg/m2, a
sig-nificantly positive association between BMI and SUA was found, and the regression coefficient was − 7.74 (95% CI
− 14.7, − 0.75; P = 0.03) per SD increase in BMI; while a negative BMI-SUA association was detected if the BMI was higher than 19.1 kg/m2, and the regression
coef-ficient was 5.10 (95% CI 4.44, 5.77; P < 0.0001) per SD increase in BMI. In women, SUA levels were negatively associated with BMI if the BMI was lower than 21.3 kg/ m2, and the regression coefficient was − 2.70 (95% CI
− 4.47, − 0.94; P= 0.003) per SD increase in BMI; then when the BMI was higher than 21.3 km/m2, the SUA
lev-els positively increased with BMI elevation, and the esti-mated regression coefficient was 3.93 (95% CI 3.42, 4.43;
P < 0.0001) per SD increase in BMI.
The calculated differences in regression coefficients higher and lower than the nadir point were 12.8 (95% CI 5.66, 20.0; P = 0.0005) for men and 6.63 (95% CI 4.65, 8.61; P < 0.0001) for women, after adjustment for age, current smoking and alcohol consumption status, SBP, DBP, TC, TG, FBS, and eGFR.
Table 1 Characteristics of 7941 women and 6098 men included in this study
Characteristics Men Women Total P-value
n 6098 7941 14,039
Hyperuricemia 17.96% 4.04% 10.18% < 0.001
Age (years) 47.70 ± 14.28 48.65 ± 13.65 48.24 ± 13.94 < 0.001
Body mass index (kg/m2) 24.54 ± 3.51 24.58 ± 3.74 24.56 ± 3.64 0.535
Occupation types < 0.001
Light physical 3266 (53.56) 5606 (70.60) 8872 (63.20)
Moderate physical 2123 (34.81) 1901 (23.94) 4024 (28.66)
Heavy physical 709 (11.63) 434 (5.47) 1143 (8.14)
Serum uric acid (μmol/L) 349.62 ± 85.30 267.37 ± 70.79 303.09 ± 87.50 < 0.001
Smoking status in last 6 months (%) < 0.001
Smoking 2804 (45.98) 7769 (97.83) 10,573 (75.31)
Never 2972 (48.74) 152 (1.91) 3124 (22.25)
Past 322 (5.28) 20 (0.25) 342 (2.44)
Alcohol drinking status in last 6 months (%) < 0.001
Never 2659 (43.60) 7698 (96.94) 10,357(73.77)
Moderate 2204 (36.14) 180 (2.27) 2384 (16.98)
Heavy 1161 (19.04) 62 (0.78) 1223 (8.71)
Quit 74 (1.21) 1 (0.01) 75 (0.53)
Systolic blood pressure (mmHg) 131.76 ± 19.38 129.73 ± 22.13 130.61 ± 21.01 < 0.001
Diastolic blood pressure (mmHg) 85.68 ± 12.07 82.49 ± 11.82 83.87 ± 12.03 < 0.001
Fasting blood glucose (mmol/L) 5.10 (4.42-5.70) 5.08 (4.50-5.68) 5.09 (4.48–5.70) 0.362
Triglyceride (mmol/L) 1.20 (0.82–1.90) 1.10 (0.74–1.66) 1.14 (0.77–1.76) < 0.001
High-density lipoprotein cholesterol (mmol/L) 1.31 ± 0.42 1.40 ± 0.38 1.36 ± 0.40 < 0.001
Low-density lipoprotein cholesterol (mmol/L) 2.76 ± 0.82 2.74 ± 0.84 2.75 ± 0.83 0.330
Total cholesterol (mmol/L) 4.86 ± 1.04 4.88 ± 1.09 4.87 ± 1.07 0.277
Creatinine (μmol/L) 82.98 ± 21.77 70.11 ± 21.07 75.70 ± 22.31 < 0.001
[image:3.595.57.541.100.451.2]Table 2 Characteristics of 7941 women and 6098 men among 4 BMI categories in this study
Characteristics Under-weight Normal weight Overweight Obesity P-value
n 470 7548 4983 1038
Hyperuricemia 4.81% 7.19% 13.46% 17.68% < 0.001
Age (years) 42.49 ± 18.60 46.64 ± 14.28 50.42 ± 12.51 51.98 ± 12.87 < 0.001
Body mass index (kg/m2) 17.59 ± 0.75 22.33 ± 1.73 27.06 ± 1.36 32.01 ± 2.21 < 0.001
Occupation types, % < 0.001
Light physical 290 (61.70) 4555 (60.35) 3294 (66.10) 733 (70.62)
Moderate physical 147 (31.28) 2322 (30.76) 1311 (26.31) 244 (23.51)
Heavy physical 33 (7.02) 671 (8.89) 378 (7.59) 61 (5.88)
Serum uric acid (μmol/L) 273.62 ± 72.84 287.58 ± 82.84 321.35 ± 88.14 341.60 ± 93.59 < 0.001
Smoking status in last 6 months (%) < 0.001
Smoking 354 (75.32) 5575 (73.86) 3816 (76.58) 828 (79.77)
Never 110 (23.40) 1792 (23.74) 1031 (20.69) 191 (18.40)
Past 6 (1.28) 181 (2.40) 136 (2.73) 19 (1.83)
Alcohol drinking status in last 6 months (%) < 0.001
Never 373 (79.36) 5589 (74.05) 3588 (72.00) 807 (77.75)
Moderate 56 (11.91) 1259 (16.68) 911 (18.28) 158 (15.22)
Heavy 38 (8.09) 657 (8.70) 457 (9.17) 71 (6.84)
Quit 3 (0.64) 43 (0.57) 27 (0.54) 2 (0.19)
Systolic blood pressure (mmHg) 118.08 ± 17.73 126.39 ± 19.85 135.75 ± 20.41 142.34 ± 22.28 < 0.001 Diastolic blood pressure (mmHg) 76.57 ± 10.21 81.39 ± 11.15 86.86 ± 11.90 90.94 ± 12.85 < 0.001 Fasting blood glucose (mmol/L) 4.70 (4.10–5.20) 4.92 (4.40–5.50) 5.20 (4.60–5.88) 5.60 (4.90–6.31) < 0.001 Triglyceride (mmol/L) 0.78 (0.59–1.07) 0.97 (0.68–1.44) 1.41 (0.96–2.14) 1.70 (1.18–2.57) < 0.001 High-density lipoprotein cholesterol (mmol/L) 1.47 ± 0.35 1.41 ± 0.41 1.30 ± 0.38 1.27 ± 0.38 < 0.001 Low-density lipoprotein cholesterol (mmol/L) 2.39 ± 0.73 2.65 ± 0.81 2.89 ± 0.83 2.95 ± 0.80 < 0.001
Total cholesterol (mmol/L) 4.42 ± 0.96 4.73 ± 1.06 5.04 ± 1.05 5.21 ± 1.03 < 0.001
Creatinine (μmol/L) 71.03 ± 21.83 74.47 ± 23.02 77.37 ± 21.26 78.73 ± 21.23 < 0.001 Estimated glomerular filtration rate (%) 99.92 (80.05–158.5) 91.35 (76.59–142.9) 86.36 (73.56–126.8) 83.69 (72.03–113.2) < 0.001
Table 3 Multivariable linear and non-linear relationship between sUA and BMI stratified by gender, β (95% CI) of BMI (kg/ m2)
Model I: Adjusted for age
Model II: Adjusted for age, current smoking status, current drinking status, occupational types, SBP, DBP, fasting blood sugar (log10 transformed), eGFR, LDL, triglyceride (log10 transformed), and total cholesterol
Non-linear model: Adjusted for age, current drinking status, current smoking status, occupational types, SBP, DBP, fasting blood sugar (log10 transformed), eGFR, LDL, triglyceride (log10 transformed), and total cholesterol
Models Men P-value Women P-value Total P-value
Linear regression model, Per SD increase in BMI
Crude model 6.11 (5.56, 6.66) < 0.0001 5.03 (4.66, 5.40) < 0.0001 5.47 (5.15, 5.78) < 0.0001 Model I 6.16 (5.60, 6.71) < 0.0001 4.09 (3.71, 4.48) < 0.0001 5.29 (4.97, 5.61) < 0.0001 Model II 4.71 (4.08, 5.35) < 0.0001 3.03 (2.60, 3.46) < 0.0001 3.80 (3.44, 4.17) < 0.0001 Non-linear model, regression coefficients (β)
Break point of BMI, kg/m2 (K) 19.1 21.3 19.2
< K − 7.74 (− 14.7, − 0.75) 0.0301 − 2.70 (− 4.47, − 0.94) 0.0027 − 8.72 (− 12.4, − 5.06) < 0.0001 ≥ K 5.10 (4.44, 5.77) < 0.0001 3.93 (3.42, 4.43) < 0.0001 4.26 (3.87, 4.65) < 0.0001 Difference of β-value between strata 12.8 (5.66, 20.0) 0.0005 6.63 (4.65, 8.61) < 0.0001 13.0 (9.21, 16.8) < 0.0001
Predicted value of sUA at break point 308 (304, 312) 243 (240, 245) 267 (264, 270)
[image:4.595.58.539.100.452.2] [image:4.595.56.541.509.664.2]Exploration of modifier and interaction effects on SUA-BMI-association
We explored potential modifier or interaction effects from TG, TC, FBS, and LDL, and found that TG might be a potential interaction factor for SUA-BMI associa-tion (Table 4). After stratified analyses by tertiles of TG levels, we found the SUA-BMI association (regression coefficients per SD increase in BMI) among men was significantly increased from 3.74 (95% CI of regression coefficient: 2.59, 4.90) at tertile 1 (< 14.4 µmol/L), to 4.89 (95% CI 3.84, 5.95) at tertile 2 (14.5–22.9 µmol/L), and to 6.09 (95% CI 5.13, 7.05) at tertile 3 (≥ 22.9 µmol/L) with
P value of 0.002 for linear trend and P-value of 0.007 for interaction. Among women, a significant TG interaction was detected. The SUA-BMI regression coefficients were 2.12 (95% CI 1.41, 2.83) for tertile 1, 3.29 (95% CI 2.61, 3.97) for tertile 2, and 4.25 (95% CI 3.51, 4.99) for ter-tile 3 with P < 0.0001 for linear trend and P =0.0002 for interaction.
Discussion
Positive association between SUA and BMI was found among men and women. Using the two-piece piece-wise regression model, we found a U-shaped SUA-BMI rela-tionship for both men and women. Although a positive association was maintained when the BMI was higher than 20 kg/m2, a negative association was found when
the BMI was lower than 20 kg/m2. Our results suggested
that SUA level might be a good index for BMI, depending on whether or not the participants were underweight.
Accumulating evidence suggests that elevated SUA lev-els are common comorbidities of obesity and are accom-panied by gradually increasing BMI [17]. Dr. Rathmann and colleagues used the data from the Coronary Artery Risk Development in Young Adults (CARDIA) Study (1249 male and 1362 female black and white subjects aged 17–35 years with a 10-year follow-up) to evalu-ate changes in SUA with changes in components of the metabolic syndrome in young adults [18]. They found
Fig. 1 Two-piece piecewise regression and smooth curve-fitting for association between SUA and BMI stratified by gender. a The two-piece wise smooth curve for BMI-SUA association in women. When the BMI was smaller or equal than 21.3 kg/m2, there is a negative association between
BMI and SUA. The regression coefficient β was − 2.70 (95% CI − 4.47, − 0.94). If BMI greater than 21.3 kg/m2, a significant positive association was
found with a regression coefficient of 3.93 (95% CI 3.42, 4.43). b The two-piece wise smooth curve for BMI-SUA association in women. When BMI smaller or equal to 19.1 kg/m2, a negative BMI-SUA association was found with a regression coefficient of − 7.74 (95% CI − 14.7, − 0.75). When BMI
greater than 19.1 kg/m2, a positive association was found, the coefficient was 5.10 (95% CI 4.44, 5.77). The two-piece wise models adjusted for age,
current smoking status, current drinking status, occupational types, SBP, DBP, fasting blood sugar (log10 transformed), eGFR, LDL, triglyceride (log10
transformed), and total cholesterol
Table 4 Potential interactions of triglyceride with sUA-BMI associations among men and women
Adjusted for age, current smoking status, alcohol consumption, occupational types, SBP, DBP, fasting blood sugar (log10 transformed), eGFR, LDL, triglyceride (log10 transformed) and total cholesterol
Models Regression coefficients (95% CI) for triglyceride P for interaction P for linear trend T1: 0.09–0.81, mmol/L T2: 0.81–1.21, mmol/L T3:1.21–15.87, mmol/L
Men 3.74 (2.59, 4.90) 4.89 (3.84, 5.95) 6.09 (5.13, 7.05) 0.0074 0.0017
Women 2.12 (1.41, 2.83) 3.29 (2.61, 3.97) 4.25 (3.51, 4.99) 0.0002 < 0.0001
[image:5.595.61.538.88.265.2] [image:5.595.56.539.634.707.2]that BMI had a significant independent linear associa-tion with UA in all race-sex-groups. Another Chinese study of 2962 patients with type 2 diabetes also observed a linear association between the prevalence of obesity and increasing SUA levels [19]. However, these studies only focused on the linear relationship between SUA and BMI, while our results indicated a strong U-shaped rela-tionship for both men and women. Previous mechanism studies suggested that chronic inflammation contributed to the pathogenesis of obesity [20, 21]; the infiltration and accumulation of macrophages in adipose tissue was dem-onstrated to be associated with increased tumor necrosis factor-α and interleukin 6 secretion [22, 23]. Similarly, macrophages also play an important role in the inflam-mation associated with gout/hyperuricemia [24–27]. Of note, physiological concentrations of SUA displayed anti-inflammatory effects both in vitro and in vivo [14] and thus might partly explain the U-shaped relationship between SUA and BMI.
Meanwhile, our results also showed a similar U-shaped SUA-BMI association and nadir point of BMI, around 20 kg/m2, for men and women. The strength of the
asso-ciation was significantly stronger for men than women. A prospective study on 3857 Chinese participants with normal metabolic function [28] found that baseline SUA levels and metabolic syndrome during a mean follow-up of 5.41 years were more closely related in women than in men. A study among Mexican-origin infants, youth and adults [10] also found a stronger association between sali-vary UA levels and BMI for females than males. Although the mechanisms underlying these observations are still unclear, several studies indicated that differences in sex hormone levels may partially explain the effects. An anal-ysis study on the data from 7662 women aged 20 years and older in the Third National Health and Nutrition Examination Survey (1988–1994) found that menopause was independently associated with higher SUA levels, and postmenopausal hormone use was associated with lower UA levels among postmenopausal women [29]. A study on 128 obese patients who underwent laparoscopic sleeve gastrectomy found that increased estradiol levels, decreased total testosterone levels, and increased estra-diol/total testosterone ratios in obese female patients 6 months post-surgery might be related to SUA improve-ment [30]. Additionally, mechanism-related evidence also suggested that estradiol can affect fat metabolism and distribution in women.
In addition, we found an interaction effect of TG lev-els on the association between BMI and SUA; BMI had a stronger effect on SUA at higher TG levels. Similar interdependent relationships have been reported among SUA, C-reactive protein and interleukin 10 levels, which related to early hepatic damage [25]. As the hepatic
manifestation of obesity and metabolic dysfunction, nonalcoholic fatty liver disease could result in hepatic damage. However, these assumptions need further inves-tigation in additional well-designed studies.
Our study has several limitations. First, due to the inherent nature of cross-sectional designs, our results could not make a causality conclusion. Second, the par-ticipants were limited to coastal areas and had special diet features with more marine food products, such as sea-fish, shrimp, and shellfishes. Therefore the extension of these conclusions should be prudent. Furthermore, additional large-scale studies with representative popula-tions are warranted to validate our conclusions.
Conclusions
Using the data from a general Chinese population, we found a U-shaped relationship between BMI and SUA for both men and women; and a stronger SUA-BMI association was found for men than for women. Further well-designed, large-scale longitudinal studies are needed to confirm our conclusions and evaluate the underlying mechanisms of the association.
Abbreviations
BMI: body mass index; BP: blood pressure; DBP: diastolic blood pressure; eGFR: estimated glomerular filtration rate; FBG: fasting blood glucose; H/LDL: high/ low-density lipoprotein cholesterol; LDL: low density lipoprotein; SBP: systolic blood pressure; SD: standard deviation; SUA: serum uric acid; TC: total choles-terol; TG: triglyceride; UA: uric acid.
Acknowledgements
Not applicable.
Authors’ contributions
HZ conceived and designed the study. HZ and YeC wrote this paper. ZL, ZC, YiC and LM performed the experiments. HZ, YW and CL analyzed the data. All authors read and approved the final manuscript.
Funding
The study was supported by the Natural Science Foundation of China (Grant Number 81600601).
Availability of data and materials
All data generated or analyzed during this study are included in this published article.
Ethics approval and consent to participate
The study protocol was approved by the ethics committee of the Affiliated Hospital of Qingdao University.
Consent for publication
Individual informed consent was obtained from each participant.
Competing interests
The authors declare that they have no competing interests.
Author details
1 Department of Endocrinology and Metabolism, The Affiliated Hospital
of Qingdao University, 16 Jiangsu Road, Qingdao, Shandong 266003, China.
2 Heze Medical College, Heze, Shandong, China. 3 Shandong Provincial Key
•fast, convenient online submission
•
thorough peer review by experienced researchers in your field
• rapid publication on acceptance
• support for research data, including large and complex data types
•
gold Open Access which fosters wider collaboration and increased citations maximum visibility for your research: over 100M website views per year
•
At BMC, research is always in progress.
Learn more biomedcentral.com/submissions
Ready to submit your research? Choose BMC and benefit from:
Received: 25 July 2019 Accepted: 15 November 2019
References
1. Maiuolo J, Oppedisano F, Gratteri S, Muscoli C, Mollace V. Regulation of uric acid metabolism and excretion. Int J Cardiol. 2016;213:8–14. 2. Kanbay M, Jensen T, Solak Y, Le M, Roncal-Jimenez C, Rivard C, Lanaspa
MA, Nakagawa T, Johnson RJ. Uric acid in metabolic syndrome: from an innocent bystander to a central player. Eur J Intern Med. 2016;29:3–8. 3. Zhou H, Wang Y, Cui L, Chen Y, Li C, Zhao J. The ongoing role of serum
uric acid in blood pressure. Clin Exp Hypertens. 2017;39:601–5. 4. Rizzo M, Obradovic M, Labudovic-Borovic M, Nikolic D, Montalto G, Rizvi
AA, Mikhailidis DP, Isenovic ER. Uric acid metabolism in pre-hypertension and the metabolic syndrome. Curr Vasc Pharmacol. 2014;12:572–85. 5. Xu YL, Xu KF, Bai JL, Liu Y, Yu RB, Liu CL, Shen C, Wu XH. Elevation of serum
uric acid and incidence of type 2 diabetes: a systematic review and meta-analysis. Chronic Dis Transl Med. 2016;2:81–91.
6. Lima WG, Martins-Santos ME, Chaves VE. Uric acid as a modulator of glucose and lipid metabolism. Biochimie. 2015;116:17–23.
7. Zheng R, Chen C, Yang T, Chen Q, Lu R, Mao Y. Serum uric acid levels and the risk of obesity: a longitudinal population-based epidemiological study. Clin Lab. 2017;63:1581–7.
8. Tremmel M, Gerdtham UG, Nilsson PM, Saha S. Economic burden of obesity: a systematic literature review. Int J Environ Res Public Health. 2017;14:435.
9. Upadhyay J, Farr O, Perakakis N, Ghaly W, Mantzoros C. Obesity as a disease. Med Clin North Am. 2018;102:13–33.
10. Martinez AD, Ruelas L, Granger DA. Association between body mass index and salivary uric acid among Mexican-origin infants, youth and adults: gender and developmental differences. Dev Psychobiol. 2017;59:225–34.
11. Tanaka K, Ogata S, Tanaka H, Omura K, Honda C, Hayakawa K. The rela-tionship between body mass index and uric acid: a study on Japanese adult twins. Environ Health Prev Med. 2015;20:347–53.
12. Wang H, Wang L, Xie R, Dai W, Gao C, Shen P, Huang X, Zhang F, Yang X, Ji G. Association of serum uric acid with body mass index: a cross-sectional study from Jiangsu Province, China. Iran J Public Health. 2014;43:1503–9. 13. Yue JR, Huang CQ, Dong BR. Association of serum uric acid with body
mass index among long-lived Chinese. Exp Gerontol. 2012;47:595–600. 14. Lai JH, Luo SF, Hung LF, Huang CY, Lien SB, Lin LC, Liu FC, Yen BL, Ho LJ. Physiological concentrations of soluble uric acid are chondroprotective and anti-inflammatory. Sci Rep. 2017;7:2359.
15. Spiga R, Marini MA, Mancuso E, Di Fatta C, Fuoco A, Perticone F, Andre-ozzi F, Mannino GC, Sesti G. Uric acid is associated with inflammatory biomarkers and induces inflammation via activating the NF-kappaB signaling pathway in HepG2 cells. Arterioscler Thromb Vasc Biol. 2017;37:1241–9.
16. Thottam GE, Krasnokutsky S, Pillinger MH. Gout and metabolic syndrome: a tangled web. Curr Rheumatol Rep. 2017;19:60.
17. Kuwabara M, Kuwabara R, Hisatome I, Niwa K, Roncal-Jimenez CA, Bjorn-stad P, Andres-Hernando A, Sato Y, Jensen T, Garcia G, et al. “Metabolically
healthy” obesity and hyperuricemia increase Risk for hypertension and diabetes: 5-year Japanese cohort study. Obesity. 2017;25:1997–2008. 18. Chen MY, Zhao CC, Li TT, Zhu Y, Yu TP, Bao YQ, Li LX, Jia WP. Serum uric acid
levels are associated with obesity but not cardio-cerebrovascular events in Chinese inpatients with type 2 diabetes. Sci Rep. 2017;7:40009. 19. Oberbach A, Neuhaus J, Inge T, Kirsch K, Schlichting N, Bluher S, Kullnick Y,
Kugler J, Baumann S, Till H. Bariatric surgery in severely obese adolescents improves major comorbidities including hyperuricemia. Metabolism. 2014;63:242–9.
20. Tanaka M, Itoh M, Ogawa Y, Suganami T. Molecular mechanism of obesity-induced ‘metabolic’ tissue remodeling. J Diabetes Investig. 2018;9:256–61.
21. Koca TT. Does obesity cause chronic inflammation? The association between complete blood parameters with body mass index and fasting glucose. Pak J Med Sci. 2017;33:65–9.
22. Subramanian V, Ferrante AW Jr. Obesity, inflammation, and macrophages. Nestle Nutr Workshop Ser Pediatr Program. 2009;63:151–9 (discussion 9-62, 259-68).
23. Unek IT, Bayraktar F, Solmaz D, Ellidokuz H, Sisman AR, Yuksel F, Yesil S. The levels of soluble CD40 ligand and C-reactive protein in normal weight, overweight and obese people. Clin Med Res. 2010;8:89–95.
24. Lu J, Hou X, Yuan X, Cui L, Liu Z, Li X, Ma L, Cheng X, Xin Y, Wang C, et al. Knockout of the urate oxidase gene provides a stable mouse model of hyperuricemia associated with metabolic disorders. Kidney Int. 2018;93:69–80.
25. Leon-Pedroza JI, Escobedo G, Gonzalez-Chavez A. Relationship of hyper-uricemia with low density lipoprotein, liver function tests and markers of systemic inflammation in patients with morbid obesity. Gac Med Mex. 2017;153:S42–50.
26. Ayna G, Krysko DV, Kaczmarek A, Petrovski G, Vandenabeele P, Fesus L. ATP release from dying autophagic cells and their phagocytosis are crucial for inflammasome activation in macrophages. PLoS ONE. 2012;7:e40069.
27. Gicquel T, Robert S, Loyer P, Victoni T, Bodin A, Ribault C, Gleonnec F, Couillin I, Boichot E, Lagente V. IL-1beta production is dependent on the activation of purinergic receptors and NLRP3 pathway in human macrophages. FASEB J. 2015;29:4162–73.
28. Yang T, Chu CH, Bai CH, You SL, Chou YC, Chou WY, Chien KL, Hwang LC, Su TC, Tseng CH, et al. Uric acid level as a risk marker for metabolic syndrome: a Chinese cohort study. Atherosclerosis. 2012;220:525–31. 29. Hak AE, Choi HK. Menopause, postmenopausal hormone use and serum
uric acid levels in US women–the Third National Health and Nutrition Examination Survey. Arthritis Res Ther. 2008;10:R116.
30. Zhang X, Zhu C, Gao J, Mei F, Yin J, Bu L, Cheng X, Sheng C, Qu S. Gender difference in the relationship between serum uric acid reduction and improvement in body fat distribution after laparoscopic sleeve gastrec-tomy in Chinese obese patients: a 6-month follow-up. Lipids Health Dis. 2018;17:288.
Publisher’s Note