1 INTRODUCTION
1.1 Context and aim of the project
This paper presents a study which assessed the fea-sibility of applying a new methodology for the sur-vey and assessment of historic buildings based on applying state-of-the-art image processing. This has the potential to facilitate frequent surveys with min-imal disruption to the general public in cities.
The conservation of Built Heritage is a high value market and there is the need to continuously survey, assess and monitor historic buildings and structures. However, this is not always possible using the cur-rent state-of-the-art manual data gathering and data analysis approaches which can be labour intensive and time consuming. This can result in insufficient maintenance and monitoring leading to major prob-lems and causing the loss of the heritage’s value.
Nevertheless, the latest developments in image pro-cessing make this a technology with great potential to address this challenge. The possibility of automat-ing the data capture and processautomat-ing opens new op-portunities in fields such as architecture conserva-tion as it can reduce the time and cost of inspecconserva-tions making them more accessible.
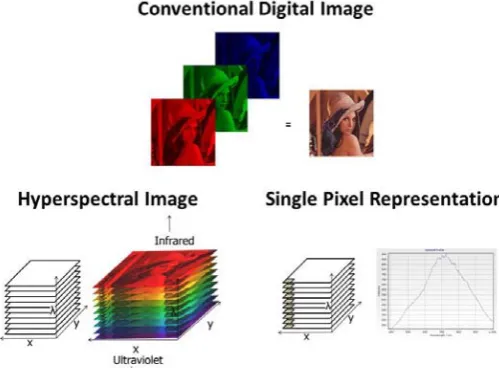
In this work, we use traditional cameras and hyper-spectral imaging systems. Where conventional digi-tal imaging devices capture light over one (grey-scale) or three (red, green, blue) distinct portions of the electromagnetic spectrum, a hyperspectral imag-ing system acquires light at hundreds or even thou-sands of different spectral bands. Similar to the way in which a spectrometer produces a spectrum of the light captured at a single point, a hyperspectral sys-tem produces a spectrum for each pixel in the image, see Figure 1. This combination of spatial and spec-tral detail provides significantly more information about a scene. In recent years it has been used in a number of different applications such as classifica-tion of Chinese tea (Kelman et al. 2013) and beef quality assessment (Qiao et al. 2015) and a number of new signal processing techniques have been de-veloped to efficiently process the data (Zabalza et al. 2014) (Zabalza et al. 2015) .
In this context, the Architectural Design & Conser-vation Research Unit (ADCRU) and the Centre for Signal and Image Processing (CeSIP) from the Uni-versity of Strathclyde (Glasgow, UK) started collab-orating in the research project presented in this pa-per.
The aim of the work is to create a new methodology for the survey and assessment of historic buildings based on state-of-the-art image processing
technolo-Exploring the use of image processing to survey and quantitatively assess
historic buildings
C. González Manich, T. Kelman, F. Coutts, B. Qiu,
P. Murray, C. González-Longo & S. Marshall
University of Strathclyde, Glasgow, UK
gies. First, image data related to the condition of a historic building is captured. Then, its analysis is au-tomated using new and intelligent image processing software modules developed for this purpose. Final-ly, the resulting information can later be used to as-sess the building condition and design the most ade-quate intervention in every case.
[image:2.595.35.285.229.413.2]In the end, the outputs of the research can provide a more accurate, time and cost effective solution for estimating the cost of architectural conservation and to carry out better assessments and monitoring of the condition of the existing buildings.
Figure 1: Conventional digital imaging and Hyperspectral imaging.
1.2 Literature survey: precedents
Image processing techniques have been implement-ed in a wide range of areas such as mimplement-edicine (Dougherty 2009), automation (Bulanona et al. 2002), security (Sewaga et al. 2006) and defence (Colloquium 1990). In recent years, it has been adopted in the architecture field using a number of different devices and technologies as explained be-low.
One approach, (Lerma et al. 2000) used a digital colour camera integrated with a near infrared (NIR) camera. This allowed the capture of multispectral images of building façades as well as texture images generated from the four spectral regions – red, green, blue (RGB) and an NIR band. This data was found to be useful for recognising different kinds of limestone. This research also indicated that better classification of visually similar materials was achieved when using the NIR band rather than the RGB data. Later research (Lerma 2001) indicated that not only multispectral images but also multi-temporal and multisensory images helped to increase
classification accuracy. In further work, (Lerma 2005) different methodologies of classification were compared. A supervised maximum-likelihood classi-fier was considered as the best way to classify dif-ferent wall materials. A minimum-distance classifier was quicker but had significantly lower accuracy.
In work presented by M.W. Hemmleb, (Hemmleb et al. 2005) a variety of illumination conditions were considered as a problematic source of error. There-fore, a new multispectral scanner was developed to apply active illumination which mapped different materials and corrosion (Hemmleb et al. 2006). However, this method was time consuming and it was concluded that further work was required to im-prove the robustness of the results.
Another trial (Palombi et al. 2008) was carried out with fluorescence LiDAR used on The Coliseum in Rome. The LiDAR systems used were not only able to distinguish different materials, but also able to differentiate stone masonry from different historic periods, which was helpful to identify previous con-servation works that were not clearly recorded.
Thermal images show temperature fluctuations of material surfaces. As different materials have differ-ent specific heat capacities, the measured fluctua-tions can be used as a means of identification. Com-bining the thermal fluctuation data and the analysis of the RGB images, materials on a façade were clas-sified using a maximum likelihood classifier (Sidi-ropoulou-Velidou et al. 2012).
Based on these precedents this paper aims to further develop the image processing techniques to allow automated analysis of stone masonry facades, identi-fying the different materials used as well as patholo-gies. This novel approach aims to improve the effi-ciency of the current manual survey process by using data from multiple sensors including tradition-al colour cameras and Hyperspectrtradition-al Imaging sys-tems.
2 METHODOLOGY AND SCOPE
In order to explore the possibility of applying state-of-the-art image processing to the challenge of sur-veying historic buildings, one case study was select-ed and surveyselect-ed using two different approaches.
based on professional expertise, involving visual in-spection and manual work.
The second approach is based on image processing techniques. It was carried out by a team from CeSIP with the support of ADCRU. The objective in this case was to obtain RGB and hyperspectral images and process them to identify the mortar joints and classify the different pathologies.
In both cases, the scope of the survey only consid-ered two types of information: the geometry of the masonry (stone units and mortar joints), and the pa-thologies.
The comparison of the results obtained in both ap-proaches is used to evaluate the potential of this new proposed methodology.
2.1 The case study
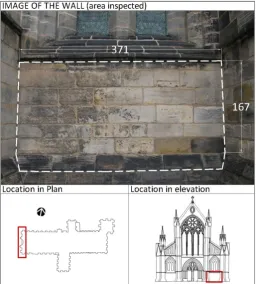
[image:3.595.33.290.401.686.2]The case study selected is a wall section (371 cm × 167 cm) of the Glasgow Cathedral, located at the bottom right side of its main façade, as shown in Figure 2.
This area was chosen because the surface comprised of a regular ashlar masonry pattern simplifies the analysis and facilitates the comparison of the results from both studies. At the same time, it contains sev-eral different pathologies (and therefore colours and textures) making it an ideal sample for this study.
2.2 Traditional survey
Traditional surveys are mainly based on a manual process. Usually, an expert team gathers information about the geometry, history, construction details, materials and pathologies of a building. Every type of data is recorded separately in a set of plans and reports. Then, this layered information is combined and analysed to assess the condition of the building and propose the most adequate conservation. How-ever, in this case, the scope of the work determined that it was only necessary to collect information about geometry and pathologies of the wall under study.
The data regarding geometry was provided by His-toric Environment Scotland (HES) from a photo-grammetry survey performed by one of their quali-fied teams. The resulting elevations contained the definition of the stone unit sizes and mortar joints thicknesses.
The condition survey was based on a visual inspec-tion carried out by an experienced specialist conser-vation architect. Carefully examining the different stone units, she was able to identify the different pa-thologies present in the wall section, based on con-sistency and appearance of the surfaces and deposits - including texture and colour aspects - considering also the location and exposure of the individual stones and surfaces. This data was manually marked and annotated on a scaled elevation drawing using a graphic code based on the Italian Standard Normal 1/88 as shown in Figure 8.
2.3 Image processing survey 2.3.1 Data Capture
For the RGB capture, a Canon PowerShot G11 with Canon Zoom lens 5X15 was used. The images were captured at a resolution of 3648 × 2736 pixels.
Several hyperspectral images were also captured of the same wall. These were captured using a Hama-matsu ORCA-05G camera connected to a Specim V10E imaging spectrograph with a Schneider Com-pact VIS-NIR Lens. Using 4 × 4 binning, the images
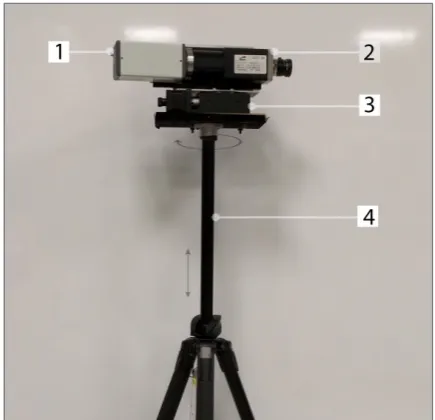
were captured at a resolution of 336 × 1478 spatial pixels, with each pixel containing 256 spectral bands ranging from 400 nm to 1000 nm. Since this camera system is a line-scan system, either the object or the camera must be moved in order to construct an im-age of the scene. To achieve this, the system was mounted on a Zolix RAK100 motorised rotational stage attached to a tripod. See Figure 3.
The image was built up line by line as the system ro-tated. This rotation caused some distortion, as can be seen in Figure 4 where the horizontal lines have a slight curve to them. This can be corrected in future by translating the camera past the scene rather than rotating it or by registering points to the CAD mod-el. The image shown in Figure 4 is the 100th spectral band in the data cube. To calibrate each band to a specific wavelength, a mercury calibration lamp with known spectral peaks was used. In this case, band 100 corresponds to 628 nm.
2.3.2 Signal Processing Methodology
2.3.2.1 Mortar Detection
A number of different signal/image processing tech-niques were used to detect the mortar regions of the image. The following algorithms were used: Law’s texture analysis (Laws 1980) to extract feature
vec-tors; Principal Component Analysis (PCA) (Jollie 2002) to reduce the dimensionality of the hyperspec-tral data; Support Vector Machines (SVM) (Cortes & Vapnik 1995) to classify the texture features; 2-D filtering to enhance mortar regions; morphological openings, closings and top hats (Serra 1988) to re-move noise; and marker controlled watershed seg-mentation (Beucher 1991) to segment the classifica-tion result.
Law’s texture analysis uses 25 two-dimensional ker-nels obtained via the convolution of 5 dimensional kernels with each other. The five one-dimensional kernels are:
L5 = [ +1 +4 6 +4 +1 ] (Level) E5 = [ -1 -2 0 +2 +1 ] (Edge) S5 = [ -1 0 2 0 -1 ] (Spot) W5 = [ -1 +2 0 -2 +1 ] (Wave) R5 = [ +1 -4 6 -4 +1 ] (Ripple)
The 25 two-dimensional kernels produced are then convolved with each band in the input image. An RGB image has three bands, so after this technique has been applied each pixel has 25 × 3 = 75 features. The hyperspectral images have 256 bands. However some of these contain large amount of noise due to the properties of the spectrograph and the sensor.
The 200 useable bands would produce 25 × 200 = 5,000 features for each pixel. Rather than using these 5,000 features, PCA is employed to reduce the dimensionality of the hyperspectral data before tex-ture analysis. PCA exploits the redundancy in multi-dimensional data and reorders it in such a way that most of the variance is contained within the first few components. The 200 band hyperspectral image can therefore be reduced to a 10 band PCA image with minimal loss of information. After texture analysis, this produces 25 × 10 = 250 features for each pixel.
As well as using the principal components from the hyperspectral image, three bands roughly corre-sponding to the response of the human eye can be selected to project an approximate colour RGB im-age. Texture analysis on this image also produces 75 features per pixel.
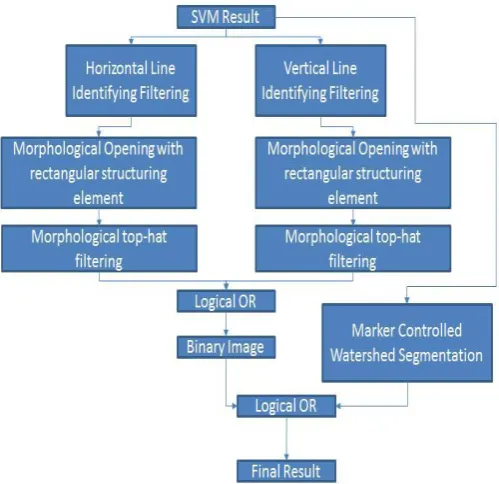
[image:4.595.47.265.146.356.2]This provides 3 different data sets which can be ana-lysed before their results are combined to produce the final result. From each image, 20 mortar and 20 stone unit regions are selected to be used as training data for an SVM classifier. In each case (RGB, hy-perspectral and projected RGB), the classification result is filtered first by a vertical line identifying fil-ter and by a horizontal line identifying filfil-ter. Affil-ter morphological post-processing to remove noise, a logical OR operation is used to combine these two
Figure 3: Hyperspectral camera used during the research work. 1) Camera 2) Spectrograph 3) Motorised Stage 4) Tripod.
[image:4.595.33.289.569.658.2]results into a binary image. This binary image is then combined (using a logical OR) with a marker controlled watershed segmentation of the unpro-cessed SVM output to produce the final result.
Two flowcharts describing the whole process are shown in Figure 5 and Figure 6 and the results of applying this approach are shown and described in Section 3.2.
2.3.2.2 Pathologies Classification
As well as identifying mortar, the hyperspectral data can also be used to classify the wall based on the pa-thologies identified in the manual survey. As with
the mortar detection, PCA is used to reduce the data to just 10 bands. This significantly improves the classification speed. An SVM is trained using differ-ent class regions which are selected based on the manual survey. Every pixel in the image is then as-signed a class by the SVM.
3 ANALYSIS
3.1 Manual survey
As previously mentioned, the pathologies present in the section of the wall were identified, manually marked and annotated in situ on a scaled elevation drawing. This mark-up drawing was then used to produce a CAD drawing (Figure 7).
Seven different pathologies were identified. The most prevalent was soiling, which is found in shel-tered areas exposed to moisture (below string course and to the left hand side of the wall section consid-ered). In some areas, it is also combined with stone exfoliation; some crust has also already been formed.
[image:5.595.29.286.168.396.2]Other pathologies have also been identified in some stone blocks, such as superficial deposits and swell-ing. Three stones also have visible cracks which may develop with time into loss of material and structural damage. Table 1 summarises the pathologies identi-fied and the stone units affected.
[image:5.595.38.288.444.686.2]Figure 5: Flowchart describing the mortar detection process.
[image:5.595.310.565.491.645.2]Figure 6: Flowchart describing the post-processing process.
Figure 7: Survey elevation, identifying the different patholo-gies found on the wall.
[image:5.595.308.565.697.758.2]Pathologies identified Stone Units affected
Crack U14, U16,U32
Crust U2-U4, U32
Erosion U13,U14
Exfoliation U1-U8, U12-U14, U17-U19,
U22-U25, U28-U30
Soiling U1-U8, U10-U14, U16-U19,
U21-U25, U28-U30, U32-39 Superficial deposit U31
[image:6.595.337.534.33.370.2]Swelling U30
Table 1: List of identified pathologies and stone units affected.
3.2 Image Recognition Survey 3.2.1 Mortar Detection
As explained in section 2, three different images were used in total for mortar detection: a standard RGB image, a hyperspectral image and a projected colour RGB image generated from three bands of the hyperspectral image. 20 different mortar regions and 20 different block regions were manually select-ed to be usselect-ed as training data for the SVMs. Figure 9 shows the output result of the classifier in each case.
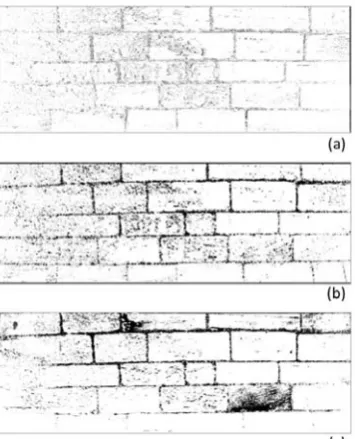
[image:6.595.36.287.45.158.2]As can been seen from the SVM mortar classifica-tion results, all three images have identified the mor-tar in different ways. Using the post-processing ex-plained in the methodology section and shown in Figure 6, each of these classification results was used to generate a final binary image where mortar has been detected. These results are shown in Figure 10 (a), (b) and (c). Since (b) and (c) were both gen-erated from the same hyperspectral image, these re-sults were combined using a logical AND function which highlights only regions of mortar that were identified in both results. This is shown in Figure 10 (d).
Figure 10: Post processed mortar classification results (a) RGB (b) Hyperspectral (c) False Colour RGB (d) Combination of hyperspectral and false colour results.
3.2.2 Pathology Classification
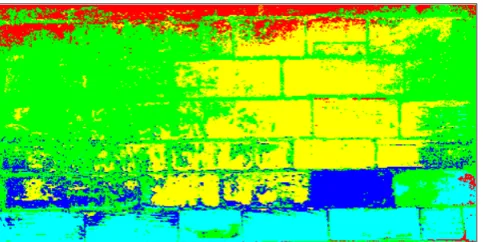
In the manual survey, 7 different pathologies were identified. However, in many cases, parts of the wall were affected by more than one pathology. For the image processing survey, 5 classes were identified corresponding to different combinations of patholo-gies. Each of these classes was then assigned a col-our. Table 1 shows these classes and colours.
Class Colour
Exfoliation and Erosion Green
Superficial Deposit Blue
Soiling Cyan
Crust, Soiling and Exfoliation Red
No pathology Yellow
Table 2: Classes and Colours.
Small regions consisting of each of these classes were selected manually. These regions were used as the training data for an SVM classifier and are shown in Figure 11. Since PCA was used, each pixel vector in each training region is made up of 10 val-ues corresponding to the 10 principal components. The whole image was then classified based on the SVM generated from the training regions. Each pix-el was assigned a colour based on the class to which the SVM determined it belonged. This result is shown in Figure 12.
[image:6.595.69.247.354.574.2]4 DISCUSSION
4.1 Comparison between the two approaches
Having presented both the image processing based survey and the traditional survey, this section looks to compare the two methods and evaluates the po-tential of the image processing based approach as a new methodology for surveying historic sites. To compare the methods, three metrics for comparison were identified: speed, accuracy and site disruption. 4.1.1 Speed
The traditional survey in this study took around 2 hours on site with a further 2 hours to draw the re-sults. This does not include the photogrammetry survey of the cathedral provide by Historic Envi-ronment Scotland, however it is estimated that for this wall section it would add an additional 4 hours to the process, taking the total time to around 8 hours of work. The data capture required for this im-age processing survey took around 30 minutes. The algorithms used to detect the mortar regions and classify the pathologies took around 15 minutes to run (on a desktop computer with a 3.6 Ghz Intel Core i7-490 processor running Windows 8 64-bit with 16 GB RAM). Since this was the first trial of the proposed method, several weeks were spent de-veloping the required algorithms. For future surveys, the same algorithms will be used so this process will not need to be repeated meaning the total processing time for a wall of this size could be as little as 45
minutes. Clearly, the image processing based meth-od has great potential to improve the efficiency of the survey process.
4.1.2 Accuracy
The traditional approach produces a highly accurate representation of the existing mortar joints and stone units. The results of the mortar detection using the developed image processing approach are repre-sentative of the real wall, however, in several cases, some regions were incorrectly classified. See Figure 2, Figure 7 and Figure 10(d). The results of the pa-thology classification look similar but there are clearly some areas where misclassification has oc-curred. The stone is not always a homogenous mate-rial and exhibits variations in colour and texture and this is where the most of the misclassification oc-curs. This can be seen by comparing Figure 2, Fig-ure 7 and FigFig-ure 12.
4.1.3 Site Disruption
For the traditional survey, accessibility has a signifi-cant impact on the disruption caused to the building. The wall section surveyed in this paper was at ground-level and so access was not an issue. In other cases, however, scaffolding is often required to al-low the expert to get close enough for inspection. This can cause temporary closure of the building and a significant increase in costs. With the image pro-cessing based approach the disruption to the building can be minimised as general access to the area only needs to be restricted during imaging. In cases where scaffolding would be required for a manual survey, drones equipped with cameras and other image sen-sors could be used to carry out the data capture.
4.2 Future Work 4.2.1 Mortar Detection
So far, the mortar detection results have only been used to produce a drawing highlighting where the system detected mortar. From these results, howev-er, it is expected that further analysis could automat-ically determine the thickness of the joints and the size and geometry of the masonry units. At this stage, the results are just images. In further work, these images can be transformed into CAD drawings by establishing a relationship between the pixels of the image and the (x,y,z) coordinates in CAD space. 4.2.2 Pathology Classification
In this study, the training regions were selected from the same image that was classified. In future, a com-prehensive spectral library of pathology classes can be developed and maintained. This library will
[image:7.595.32.276.39.158.2]re-Figure 11: SVM Training Regions.
[image:7.595.36.278.192.313.2]duce the need for training data to be selected for fu-ture surveys allowing the analysis of a much wider range of stone masonry walls.
5 CONCLUSIONS
In this paper, an alternative method of surveying his-toric buildings using image processing techniques is proposed. Both RGB and hyperspectral images were captured and processed in order to identify mortar joints and to classify different pathologies. A com-parison with the traditional method shows promising results. In terms of speed and site disruption, a num-ber of significant improvements are offered. At this stage, the mortar detection and pathology classifica-tion results provide only an estimate of the condiclassifica-tion of the wall. To reach the level of accuracy required for a complete architectural conservation condition survey, this estimate must be improved. With this in mind, a number of areas for further development were identified giving the project clear scope for fu-ture research.
6 ACKNOWLEDGEMENTS
The authors wish to acknowledge Historic Environ-ment Scotland (HES) for giving permission to sur-vey the Glasgow Cathedral and providing them with the CAD files resulting from the photogrammetry survey and 3D laser scanner point cloud as well as site induction and assistance while carrying out the works.
7 REFERENCES
Beucher, S. 1991 ‘The Watershed Transform Ap-plied to Image Segmentation’ Proceedings of the Pfefferkorn Conference on Signal and Image Pro-cessing in Microscopy & Microanalysis,pp.299–314 Bulanona, D.M., Kataokab, T., Otac, Y. & Hi-romac, T. 2002, ‘Automation and Emerging Tech-nologies: A Segmentation Algorithm for the Auto-matic Recognition of Fuji Apples at Harvest’, Journal of Agricultural Engineering Research, vol.83, no4, pp.405–412.
Cortes, C. & Vapnik, V. 1995 ‘Support-vector networks’ Machine Learning,Vol.20,no3,pp.273-297
Dougherty, G. 2009 Digital Image Processing for Medical Applications,Cambridge Univ. Press, NY
Colloquium 1990, EE Colloquium on the Role of Image Processing in Defence & Military Electronics
Hemmleb, M., Weritz, F. & Maierhofer, C. 2005 ‘Damage detection on buildings surfaces with multi-spectral techniques’ CIPA 2005 XX International Symposium, Torino, Italy.
Hemmleb, M., Weritz, F., Schiemenz, A., Grote, A. & Maierhofer, C. 2006 ‘Multi-spectral data
ac-quisition and processing techniques for damage de-tection on building surfaces’ Image engineering and vision metrology, Dresden, Germany.
Jollie, I.T 2002 Principal Component Analysis, Springer Series in Statistics, Springer.
Kelman, T., Ren, J. & Marshall, S. 2013 ‘Effec-tive classification of Chinese tea samples in hyper-spectral imaging’ Sciedu Press, Artificial Intelli-gence Research, vol. 2, no. 4
Lerma, J.L. 2001 ‘Multiband versus multispectral supervised classification of architectural images’ The photogrammetric record, vol.17,no97,pp.89-101
Laws, K.I. 1980 ‘Rapid Texture Identification’. Proc. SPIE 0238, Image Processing for Missile Guidance,376.
Lerma, J.L. 2005 ‘Automatic plotting of architec-tural facades with multispectral images’, Journal of surveying engineering, vol.131, no3, pp.73-77
Lerma, J.L., Ruiz, L. & Buchon, F., 2000 ‘Appli-cation of spectral and textural classifi‘Appli-cations to rec-ognize materials and damages on historic building facades’ International Archives of Photogrammetry and Remote Sensing, Amsterdam, vol.XXXIII, Part B5, pp480-484
Palombi, L., Lognoli, D., Raimondi, V., Cecchi, G., Hällström, J., Barup, K., Conti, C., Grönlund, R., Johansson, A. & Svanberg, S. 2008 ‘Hyperspectral fluorescence lidar imaging at the Colosseum, Rome: Elucidating past conservation interventions’, Optics express, vol.16, no10, pp.6794-6808.
Qiao, T., Ren, J., Craigie, C., Zabalza, J., Maltin, Ch. & Marshall, S. 2015 ‘Quantitative Prediction of Beef Quality Using Visible and NIR Spectroscopy with Large Data Samples Under Industry Condi-tions’, Journal of Applied Spectroscopy, vol.82, no1, pp.137-144
Serra, J. 1988 Image Analysis and Mathematical Morphology, Volume 2: Theoretical Advances, Aca-demic Press, Inc. Orlando, FL, USA
Sewaga, E., Miura, M. & Abe, D. 2006 ‘Image Recognition Wide-Area Surveillance Technology for Safety and Security in Society’ FUJITSU Scien-tific & Technical Journal, vol.43, no2, pp.204-211
Sidiropoulou-Velidou, D., Georgopoulos, A. & Lerma,J.L. 2012 ‘Exploitation of thermal imagery for the detection of pathologies in monuments’ Lec-ture Notes in Computer Science, vol.7616,pp.97-108 Zabalza, J., Ren, J., Ren, J., Liu, Z. & Marshall, S. 2014 ‘Structured covariance principal component analysis for real-time onsite feature extraction and dimensionality reduction in hyperspectral imaging’ OSA Applied Optics, vol.53, no20, pp.4440-4449