City, University of London Institutional Repository
Citation:
Jackson, M., Linden, D., Roberts, M. V., Kriegeskorte, N. & Haenschel, C. (2015). Similarity, Not Complexity, Determines Visual Working Memory Performance. Journal of Experimental Psychology: Learning, Memory, and Cognition, 41(6), pp. 1884-1892. doi: 10.1037/xlm0000125This is the accepted version of the paper.
This version of the publication may differ from the final published
version.
Permanent repository link:
http://openaccess.city.ac.uk/11933/Link to published version:
http://dx.doi.org/10.1037/xlm0000125Copyright and reuse: City Research Online aims to make research
outputs of City, University of London available to a wider audience.
Copyright and Moral Rights remain with the author(s) and/or copyright
holders. URLs from City Research Online may be freely distributed and
linked to.
City Research Online: http://openaccess.city.ac.uk/ [email protected]
1
Similarity, not complexity, determines visual working memory
performance.
Margaret C Jackson1, David EJ Linden2, Mark V Roberts3, Nikolaus Kriegeskorte4, Corinna Haenschel5
1. University of Aberdeen
2. Cardiff University
3. Bangor University
4. University of Cambridge
5. City University London
Correspondence to be sent to:
Margaret C Jackson School of Psychology William Guild Building University of Aberdeen Kings College
Aberdeen AB24 3FX UK
Tel: 01224 272236 Fax: 01224 273426
Email: [email protected]
Abstract
A number of studies have shown that visual working memory (WM) is poorer for
complex versus simple items, traditionally accounted for by higher information load placing
greater demands on encoding and storage capacity limits. Other research suggests that it may not
be complexity that determines WM performance per se, but rather increased perceptual
similarity between complex items as a result of a large amount of overlapping information.
Increased similarity is thought to lead to greater comparison errors between items encoded into
WM and the test item(s) presented at retrieval. However, previous studies have used different
object categories to manipulate complexity and similarity, raising questions as to whether these
effects are simply due to cross-category differences. For the first time, here we investigate the
relationship between complexity and similarity in WM using the same stimulus category
(abstract polygons). We used a delayed discrimination task to measure WM for 1-4 complex
versus simple simultaneously presented items, and manipulated the similarity between the single
test item at retrieval and the sample items at encoding. WM was poorer for complex than simple
items only when the test item was similar to one of the encoding items, and not when it was
dissimilar or identical. Our results provide clear support for re-interpretation of the complexity
effect in WM as a similarity effect, and highlight the importance of the retrieval stage in
governing WM performance. We discuss how these findings can be reconciled with current
Introduction
Over the past decade, there has been strong evidence to suggest that visual working
memory (WM) has an upper capacity limit of 4 items (see Cowan, 2001 for review). However,
this upper limit of four items can only be observed when items are perceptually very simple,
such as coloured squares (Luck & Vogel, 1997). As stimulus complexity increases, WM
performance decreases markedly and results in capacity estimates lower than four items (Alvarez
& Cavanagh, 2004; Eng, Chen, & Jiang, 2005). Luria, Sessa, Gotler, Jolicoeur, & Dell’Acqua
(2010) showed that the Sustained Posterior Contralateral Negativity (SPCN) amplitude (a large
sustained negative waveform at posterior electrode sites elicited from around 300ms after
encoding onset) reached asymptote at around 4 simple items, but peaked at only 2 complex
items. This suggests that double the amount of capacity resources was required to encode and
store complex than simple items.
Luria et al.’s (2010) findings indicate that complexity-related WM capacity limits are
constrained early on during the encoding and maintenance phases, as the SPCN is measured
before a retrieval response is made. This suggests that stimulus complexity places greater
demands on cognitive resources required for developing a perceptual representation of the
memory items and holding these representations in the WM workspace. However, another
explanation of complexity effects emphasises the role of comparison errors during the retrieval
phase. Awh et al. (2007) used Chinese characters (‘simple’ stimuli) and 3-D shaded cubes
(‘complex’ stimuli) and manipulated similarity between sample (encoding) and test (retrieval)
items. In the ‘dissimilar’ condition they measured WM performance in a cross-category item
change condition (e.g. cube changes to Chinese character), and compared performance to a
different cube). They found traditional complexity effects when sample-test similarity was high
but not when sample-test items were dissimilar. These findings raise questions as to whether
complexity per se impedes WM performance, or whether increased similarity between the
encoding and test items results in more comparison errors at retrieval for complex compared to
simple stimuli. Awh et al. (2007) interpret their findings to indicate that complex items look
more similar to one another than do simple items, so the comparison between representations
held in WM with visible test items at retrieval is harder due to reduced discriminability between
encoding and retrieval items. In general support of the sample-test-similarity theory, using
simple coloured squares Shapiro & Miller (2011) and Luria et al., (2010; Experiment 4) showed
that WM was poorer for a similar than dissimilar non-match test item.
However, one particular aspect of Awh et al.’s (2007) experimental design (Experiment
2) makes it difficult to resolutely conclude that complexity effects in WM can be re-interpreted
as similarity effects. The use of a between-category change (cube to character or vice versa) for
the dissimilar condition means that participants may have used a memory retrieval strategy based
on the category of item that changed rather than item-based retrieval required in the
within-category change condition. For example, when a cube changed to a character, in observing the
test item participants simply needed to remember that there was originally a cube in that location
and thus make a relatively easy decision that the item had changed. Conversely, a
within-category change potentially requires that participants retrieve two things from memory, first that
there has been no category change and second that an item has changed. Therefore, we cannot
clearly ascertain from this study whether the absence of a complexity effect in the
between-category (dissimilar) condition was unequivocally due to low sample-test similarity or simply a
To the best of our knowledge, no study has examined the interaction between complexity
and similarity in WM using the same category of stimuli to manipulate both factors concurrently.
For the first time, here we used a single, homogenous stimulus category (abstract polygons) to
manipulate both complexity and similarity. In addition, the proposition that complex items are
perceived as more similar to one another than are simple items (Awh et al., 2007) has not been
empirically tested to date. While Awh et al. and Alvarez and Cavanagh (2004) measured
perceived complexity using a 1-item change detection task or a multi-item visual search task
respectively, they did not explicitly manipulate similarity between target and test/distracter
items. Therefore, our initial aim was to explicitly measure whether complex items are in fact
perceived as more similar to one another than are simple items, by directly manipulating both
complexity and similarity in a visual search task (Experiment 1). We presented a single target or
item that was either a similar or dissimilar on-match, or an exact match, to one of the search
items. Alvarez & Cavanagh (2004) showed that visual search is slower for complex than simple
items (from different categories). Duncan and Humphreys (1989) showed that visual search is
slower when the distracter items are similar versus dissimilar to the target. We therefore
hypothesized that if complex items are perceived as more similar to one another, then complexity
effects on search speed should be significantly magnified when target-distracter similarity is high
versus low. In support of this, and confirming that complex items are perceived as more similar
to one another than are simple items, we found that search was significantly slower for complex
than simple items in the similar and match conditions, but not in the dissimilar condition in
which target-distracter discriminability is high.
Our second, and main, aim was to determine whether complexity effects in WM can
this, in Experiment 2 we used the exact same set of stimuli as in Experiment 1 and presented
them in a delayed discrimination task to measure WM performance (loads 1-4). The single test
item at retrieval was either a similar or dissimilar non-match, or an exact match, to one of the
encoding items. We found that WM was significantly poorer for complex than simple items only
when sample and test items were similar. Complexity effects were abolished when the sample
and test items were dissimilar or identical. Our data lend strong and definitive support for a
similarity account of WM capacity limits for complex items, and highlight the importance of
retrieval stage processes in determining WM performance.
General Methods
Participants
Thirty three participants (mean age = 20; 22 females) completed the Visual Search task
(Experiment 1) and a different set of 31 participants (mean age = 19; 19 females) completed the
WM task (Experiment 2) at the School of Psychology, Bangor University. All had normal or
corrected-to normal vision. Ethical approval was obtained and participants were remunerated
with course credits, and gave written informed consent. A generous minimum requirement of 30
participants per experiment was determined from previous WM studies on complexity and
similarity effects (e.g., Alvarez & Cavanagh, 2004: N=6; Awh et al., 2007: N=16; Eng et al.,
2005: N=6 to 20), and final sample size was determined by the availability of volunteers.
Stimuli
We used meaningless, abstract, non-verbalisable shapes called BORTS (Blurred
Stimuli ranged from 1cm to 2.5cm in either height or width, and with a viewing distance of
approximately 50cm each stimulus subtended a visual angle of between 1.15o to 2.86o on either
dimension. Stimuli were presented on a 22-inch Mitsubishi Diamond-Pro 2060u monitor (32-bit
true colour; resolution 1280 x 1024 pixels) using E-Prime 2.0. Sets of 120 simple shapes and 120
complex shapes were created using Matlab, with complexity defined by the number of outline
corrugations, created by variation in the cartesian area. The degree of perceived similarity
between the shapes was established by a similarity rating task. Ten independent participants
(mean age = 19.65) viewed pairs of simple or complex shapes and rated their similarity on a
scale of 1-5 where 1 = very dissimilar, 2 = dissimilar, 3 = somewhat similar, 4 = similar, 5 = very
similar.1 Pairs of shapes in each simple and complex set were then further divided into Similar,
Dissimilar, and Neutral sets, depending on the average subjective similarity rating (mean < 2 =
Dissimilar, mean 2.5-3.5 = Neutral, mean > 4 = Similar). These pairings were then used in the
Visual Search and WM tasks to control the degree of similarity between the target and the search
array (search task) and between the sample items at encoding and the single test item at retrieval
(WM task) (see Figure 1a for an example of similarity pairings).
Experiment 1: Visual Search Task
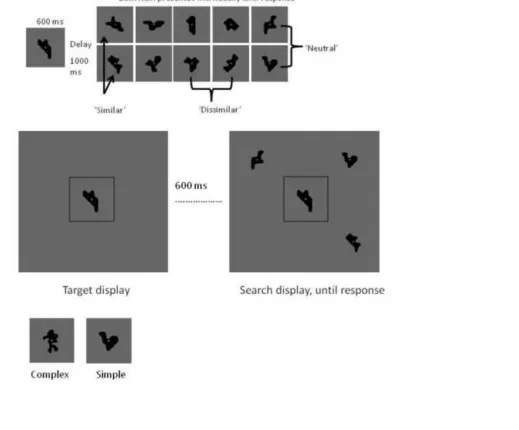
Procedure
At the start of a trial, participants were presented with a target shape in the centre of the
screen, denoted by a light grey box outline. This target shape remained on screen until the end of
1
each trial to remove any WM component from the task. Six hundred milliseconds after target
shape onset, 1, 2, 3, or 4 shapes were presented in a 2 x 2 invisible grid in the periphery of the
target (‘search array’). Participants had to respond as quickly and accurately as possible whether
the target shape was present or absent in the periphery using a simple button press. The trial
terminated as soon as a response was made. To modify sample-test-similarity, one of the items in
the search array was an exact match to the target on one third of trials, a similar non-match on
one third of trials, or a dissimilar non-match on the final third of trials. All other items in the
search array were neutral with respect to similarity with the target item and wit h respect to each
other. On half of the total trials shapes were complex, and on the other half they were simple. Set
size (4 levels), similarity (3 levels), and complexity (2 levels) were pseudo-randomised. There
were 15 trials per individual condition, yielding 360 trials in total; an example trial is illustrated
in Figure 1b.Examples of complex and simple shapes are provided in Figure 1c.
Figure 1 about here
Visual Search Results
Accuracy
Accuracy (proportion correct) on all trials was averaged for each participant and entered
into a repeated-measures ANOVA with set size (1, 2, 3, 4), complexity (complex, simple), and
similarity (match, similar non-match, dissimilar non-match) as within factors. There was a
significant three-way interaction between complexity, similarity, and set size (F(6, 192) = 3.44,
For the match data, a repeated-measures ANOVA with set size and complexity as within
factors revealed a significant main effect of set size (F(3, 96) = 13.58, p < .001, ŋp2 = .30) with
accuracy decreasing as set size increased, but the main effect of complexity and the complexity
by set size interaction were non-significant (both Fs < 1.0).
For the non-match data, a repeated-measures ANOVA with set size, complexity, and
similarity (similar, dissimilar) as within factors showed significant main effects of set size (F(3,
96) = 4.58, p = .005, ŋp2 = .13), complexity (F(1, 32) = 7.68, p = .009, ŋp2 = .19), and similarity
(F(1, 32) = 66.87, p < .001, ŋp2 = .68). Accuracy declined as set size increased, and performance
was poorer for complex than simple items and in similar than dissimilar conditions. There was
also a significant three-way interaction (F(3, 96) = 5.76, p = .001, ŋp2 = .15). To examine this
interaction, we looked at complexity effects in similar and dissimilar conditions separately. In
the similar condition, search was significantly more accurate for simple than complex items
overall (F(1, 32) = 9.31, p = .005, ŋp2 = .23). A significant complexity by set size interaction
(F(3, 96) = 8.99, p < .001, ŋp2 = .22) revealed however that a complexity effect was only present
at set size 2 (t(32) = 6.10, p < .001). Complexity effects were non-significant at set sizes 1 (p =
.54), 3 (p = .75) and 4 (p = .28). In the dissimilar condition, the main effect of complexity was
non-significant (F(1, 32) = 0.78, p = .38) as was the complexity by load interaction (F(3, 96) =
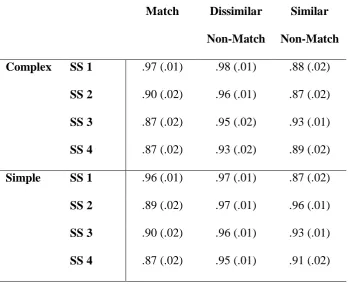
0.47, p = .71). Accuracy scores are reported in Table 1.
Table 1 about here
Search Slopes
A repeated-measures ANOVA on search slopes with complexity (complex, simple), and
similarity (match, similar non-match, dissimilar non-match) as within factors showed a
separated the non-match and match data. For match data, search slopes were significantly
steeper for complex than simple items (t(32) = 2.94, p = .006) to the magnitude of 45.16ms per
item difference. For non-match data, a repeated-measures ANOVA with complexity and
similarity as within factors showed a significant main effect of complexity (F(1, 32) = 68.43, p <
.001, ŋp2 = .68): search slopes were steeper for complex compared to simple items, indicating
that search became proportionately less efficient for complex than simple items as set size
increased. The main effect of similarity was non-significant (F(1, 32) = 0.16, p = .69, ŋp2 = .005).
There was a marginally significant interaction between complexity and similarity (F(1, 32) =
3.38, p = .08, ŋp2 = .10). Search slopes were significantly steeper for complex than simple items
in both similar (t(32) = 6.58, p < .001; Figure 2b) and dissimilar (t(32) = 7.34, p < .001; Figure
2c) conditions, but this complexity effect was larger overall in the similar (Mcomplex-simple =
115.19 ms per item) than dissimilar (Mcomplex-simple = 83.65 ms per item) condition, a marginally
significant difference (t(32) = 1.84, p = .075).
Figure 2 about here
To summarize, a complexity effect was found in all similarity conditions, but was most
evident when the target was similar to one of the search items and weakest when it was an
identical match. Importantly, differences in the magnitude of complexity effects across similarity
conditions supports the proposition that complex items are perceived as more similar to one
another than are simple items (Awh et al., 2007), likely due to a greater amount of overlapping
features. To the best of our knowledge, this is the first time that the interaction between
complexity and similarity in visual search has been investigated using a homogenous stimulus
category.
Procedure
Participants were presented with 1, 2, 3, or 4 polygons for encoding. All encoding items
were presented concurrently in a 2 x 2 invisible grid for either 600ms (load 1), 1200ms (load 2)
1800ms (load 3) or 2400ms (load 4), to provide equivalent encoding time per item. We chose
these durations in order to ensure that sufficient opportunity was provided for all participants to
encode all items in the encoding array, whether complex or simple. RTs from the visual search
task showed that participants required on average 450ms and 350ms per item to accurately
search for complex and simple items respectively. This confirms that WM encoding durations
were ample and means that any modulation of WM performance found here was not due to
insufficient perceptual processing under time-constraint (see Jackson & Raymond, 2008). We
also included an extra load 1 condition with a long encoding time of 2400ms, to check that
600ms per shape was sufficient for perceptual processing. After a 2000ms blank maintenance
interval, a single test shape was presented for retrieval for 3000ms. The use of a 3000ms window
ensures that responses are provided within WM maintenance and decay timeframes such as those
suggested by Zhang & Luck (2009). Participants were asked to respond within the 3000ms
period as to whether the test shape matched or mismatched one of the encoding items, using a
simple button press. To modify sample-test-similarity, the probe was an exact match on one third
of trials, a similar non-match on one third of trials, or a dissimilar non-match on the final third of
trials. All other items at encoding were neutral with respect to similarity with the test item and
with respect to each other. On half of trials the polygons were complex, and on the other half
they were simple. Sample-test-similarity and complexity were pseudo-randomised. WM load
was blocked with the order of blocks randomised across participants. There were 15 trials per
Figure 3 about here
Results
To provide a complete picture of WM performance, we present the results in three forms
of data: percent correct, d’, and Cowan’s k.
Percent Correct
WM performance was first analysed using percent correct scores, to allow for direct
comparison of performance across match and non-match trials. First we determined that 600ms
was sufficient encoding time per item in the WM task by comparing the short versus long
encoding time conditions at load 1. A repeated-measures ANOVA on load 1 percent correct
score with encoding time (short, long), complexity (complex, simple), and similarity (similar,
dissimilar, match) as within factors showed no significant effect of encoding time (F(1, 30) <
1.0) nor any significant interactions with time (complexity x time (F(1, 30) = 2.54, p = .12),
similarity x time (F < 1.0), three-way interaction (F < 1.0)).
For the main analysis, a repeated-measures ANOVA with load (1, 2, 3, 4), complexity
(complex, simple), and similarity (match, similar non-match, dissimilar non-match) as within
factors revealed a significant three-way interaction (F(6, 192) = 3.49, p = .003). To examine this
interaction we separated out the match from the non-match data.
In the match condition, the main effect of complexity was non-significant (F(1, 30) =
0.03, p = .86) as was the interaction between complexity and load (F(3, 90) = 0.43, p = .73;
For the non-match data, a repeated-measures ANOVA with complexity, similarity, and
load as within factors showed significant main effects of complexity (F(1, 30) = 60.24, p < .001),
similarity (F(1, 30) = 119.49, p < .001) and load (F(3, 90) = 53.95, p < .001); accuracy was better
for simple than complex items and better in dissimilar than similar conditions; accuracy
decreased as load increased. Importantly, there was a significant interaction between complexity
and similarity (F(1, 30) = 67.03, p < .001): WM accuracy was significantly better for simple than
complex items in the similar condition (F(1, 30) = 135.45, p < .001; Figure 4b), but the effect of
complexity was non-significant in the dissimilar condition (F(1, 30) = 0.20, p = .66; Figure 4c).
The 3-way interaction between complexity, similarity, and load was also significant (F(3, 90) =
11.37, p < .001). To explore this we separated data by load condition. At loads 1, 2, and 4, a
significant complexity effect was present in the similar but not in the dissimilar condition.
Specifically, at load 1, there was a marginally significant interaction between complexity and
similarity (F(1, 30) = 3.92, p = .057): a significant complexity effect in the similar condition
(t(30) = 3.61, p = .001) but not in the dissimilar condition (t(30) = 1.12, p = .27). At load 2, there
was a significant interaction between complexity and similarity (F(1, 30) = 20.49, p < .001:
complexity effect in the similar condition (t(30) = 6.94, p < .001), but not in the dissimilar
condition (t(30) = 0.40, p = .69). At load 4, there was a significant interaction between
complexity and similarity (F(1, 30) = 7.28, p = .01): complexity effect in the similar condition
(t(30) = 5.39, p < .001), but not in the dissimilar condition (t(30) = 1.37, p = .18). At load 3,
there was a significant interaction between complexity and similarity (F = 53.79, p < .001) but
the patters of results was different: WM performance was significantly better for simple than
for complex than simple items in the dissimilar condition (t(30) = 4.69, p < .001). It is difficult to
account for this anomaly.
Figure 4 about here
d’
Next, we analysed performance using d’ values [Z(hits) – Z(False Alarms)], in order to
assess performance as a combined function of both signal and noise. To compute d’, Hits were
used from match trials and False Alarms (FAs) were used from non-match trials to compare
similar versus dissimilar conditions. A repeated-measures ANOVA with load (1, 2, 3, 4),
complexity (complex, simple), and similarity (similar, dissimilar) as within factors revealed very
similar patterns of results to those obtained using percent correct values. There were significant
main effects of complexity (F(1, 30) = 11.69, p = .002, ŋp2 = .28), similarity (F(1, 30) = 138.87, p
< .001, ŋp2 = .82) and load (F(3, 90) = 144.40, p < .001, ŋp2 = .83); accuracy was better for
simple than complex items and better in dissimilar than similar conditions; accuracy decreased as
load increased. There was a significant interaction between complexity and similarity (F(1, 30) =
53.08, p < .001, ŋp2 = .64): WM accuracy was significantly better for simple than complex items
in the similar condition (F(1, 30) = 50.85, p < .001, ŋp2 = .63), but the effect of complexity was
non-significant in the dissimilar condition (F(1, 30) = 0.03, p = .86).
A significant three-way interaction was also found (F(3, 90) = 7.90, p < .001, ŋp2 = .21).
To explore this we separated data by load condition. Unlike percent correct data, at load 1 using
d’ there was a non-significant interaction between complexity and similarity (F(1, 30) = 1.35, p =
.26). There was a non-significant main effect of complexity (F(1, 30) = 0.05, p = .82), but a
significant main effect of similarity (F(1, 30) = 143.32, p < .001, ŋp2 = .83) (better WM at load 1
complexity and similarity (F(1, 30) = 14.41, p = .001, ŋp2 = .32): a significant complexity effect
in the similar condition (t(30) = 5.61, p < .001) but only a marginal effect in the dissimilar
condition (t(30) = 1.76, p = .09). At load 3, there was a significant interaction between
complexity and similarity (F(1, 30) = 53.35, p < .001, ŋp2 = .64): while there was a significant
complexity effect in the similar condition (t(30) = 4.29, p < .001) indicating better WM for
simple than complex items, in the dissimilar condition a significant complexity effect (t(30) =
0.40, p = .69) indicated better WM for complex than simple items, mirroring the pattern found
with percent correct data. Once again, it is difficult to account for this. Finally, at load 4 there
was a significant interaction between complexity and similarity (F(1, 30) = 10.00, p = .004, ŋp2 =
.25): complexity effect in the similar (t(30) = 3.97, p < .001) but not dissimilar condition (t(30) =
1.09, p = .28).
Capacity estimates (k)
We computed k-iterative (see Jackson & Raymond, 2009) to obtain a numerical estimate of
WM capacity as a function of complexity and similarity (Table 2). A repeated-measures
ANOVA with complexity and similarity as within factors showed significant main effects of
complexity (F(1, 30) = 6.40, p = .02, ŋp2 = .18) and similarity (F(1, 30) = 19.92, p < .001, ŋp2 =
.40); better for simple than complex items and better in the dissimilar than similar condition.
There was also a significant interaction between complexity and similarity (F(1, 30) = 36.03, p <
.001, ŋp2 = .55). This interaction reflects a significant complexity effect in the similar condition
(t(30) = 4.60, p < .001), but not in the dissimilar condition (t(30) = 0.38, p = .71). In the similar
condition capacity was estimated to be k = 1.58 (0.11) simple items and k = 0.95 (0.10) complex
1.52 (0.11) complex items. Thus, supporting the analyses using percent correct and d’ values, we
find that more simple than complex items could be retrieved from WM when the test item was
similar to one of the encoding items, but equivalent capacity estimates for simple and complex
items when the test item was dissimilar. It is also worth noting here that we find capacity
estimates to be markedly lower than any coloured squares capacity estimates obtained elsewhere,
while Awh et al. (2007) found equivalent k estimates for colours (k = 3.6) and between-category
changes (cubes k = 4.2; characters k = 3.5) even when a complex item changed. This suggests
that in Awh et al’s study there may have been some categorical grouping of characters and cubes
at encoding which could have boosted WM and potentially account for such high capacity
estimates. In our study there was no possibility to group by category (or complexity).
Table 2 about here
To summarize, WM was significantly poorer for complex than simple items in the similar
condition but a dissimilar (or identical) test item effectively abolished this complexity effect
(Fig. 4). Thus, increased similarity (or confusability) between complex sample and test items
appears to increase comparison errors at retrieval. This is in line with previous findings and
provides support for the theory that complexity effects in WM are driven by the magnitude of
perceived similarity between items (Awh et al., 2007). Note also that in contrast to Awh et al’s
(2007) paradigm we used a single test item that is presented in the centre of the screen and thus
not spatially related in any way to the encoding items. This is important because it removes the
opportunity for spatial WM resources to enhance recall, and allows for a clearer interpretation of
To assess whether the larger proportion of non-match (66%) to match (33%) trials drove
different response criteria strategies related to similarity and complexity, an additional and final
analyses was conducted on response bias values (c = 0.5*(zHits+zFA)). If participants
inadvertently expected more match trials than there were, perhaps this led them to adopt a more
liberal ‘same’ response on non-match similar trials than on non-match dissimilar trials. An
ANOVA on c values (where c > 0 indicates a bias to respond ‘same’ and c < 0 indicates a bias to
respond ‘different’) revealed a significant interaction between complexity and similarity (F(1,
30) = 51.20, p < .001, ŋp2 = .63). For complex items, participants were more inclined to respond
‘same’ on similar trials (c = 0.20) and ‘different’ on dissimilar trials (c = -0.17) (F(1, 30) =
186.81, p < .001, ŋp2 = .86). For simple items, participants were more inclined to respond
‘different’ when the test item was both similar (-.07) and dissimilar (c = -.17) with a greater bias
in the dissimilar condition (F(1, 30) = 11.82, p = .002, ŋp2 = .28). This data suggests that it is not
simply the overall proportion of match to non-match trials that alters response criteria per se, but
that complexity critically determines same/different threshold settings. This makes sense if we
consider that complex sample-test items in the similar condition were more confusable than
those in the simple similar condition, thus producing a larger criterion shift to respond same.2
2
A very similar pattern of results was found when the same response bias analysis was
computed for visual search accuracy scores from Experiment 1. There was a marginally
significant interaction between complexity and similarity (F(1, 32) = 4.16, p = .050, ŋp2 = .12).
For complex items participants were more inclined to respond ‘target present’ on similar trials (c
= .017) and ‘target not present’ on dissimilar trials (c = -0.23) (F(1, 32) = 67.12, p < .001, ŋp2 =
DISCUSSION
Our main finding was that, using a homogenous set of stimuli, complexity effects in WM
were observed only when the test item was similar to one of the encoding items but not when it
was dissimilar or an exact match. This provides clear evidence that complexity effects in WM
can be attributed to greater similarity between different complex than simple items (Awh et al.,
2007). These results are important in two regards. First, they shed more light on the locus of
capacity limits within the WM process, specifically on the question of whether performance is
determined by encoding and/or retrieval processes. Traditional theories of WM capacity focus on
resource demands during the front-end encoding phase, with quantitative limits defined in terms
of both the number of items and the amount of information / complexity per item (Alvarez &
Cavanagh; Eng et al., 2005). However, our data add to mounting evidence that comparison
processes at retrieval are also pivotal in determining WM performance (Awh et al., 2007; Luria
et al., 2010).
Second, our results help ascertain the nature of WM capacity limits with regards to slots
versus resource models. The slots model, which states that each item is encoded into one of a
determined number of fixed capacity slots (e.g., Cowan, 2001; Fukuda, Awh, & Vogel, 2010;
Vogel, Woodman, & Luck, 2001), cannot explain complexity effects in WM if one slot does not
have sufficient capacity to store one complex item. However, slot-based models cannot account
for the influence of similarity on WM performance. If we consider our load 4 data, the slots
averaging model might predict that two complex items are encoded into four slots and the other
two items would not gain access to WM at all (while four simple items would inhabit one slot
similar (c = -.07) and dissimilar (c = -.25) trials, with a greater bias in the dissimilar condition
each). If this were the case, the similarity of the test item to one of the encoding items should not
matter and, due to the proportion of trials probing memory for complex items that were not
stored in WM, performance should have been significantly worse for complex than simple items
regardless of similarity.
The resource model states that all items in a display gain access to WM but capacity
limits are defined by a large, limited resource pool flexibly distributed among all items (Bays,
Catalao, & Husain, 2009; Bays & Husain, 2008; see Ma, Husain, & Bays, 2014 for a review).
The resource model can adequately account for complexity effects in WM as follows: if complex
items require a larger share of the resource pool than simple items, then at larger loads complex
items will be stored at proportionately lower precision than simple items because the resource
pool is depleted more rapidly. However, the absence of a complexity effect on dissimilar and
match trials in our data is problematic for a resource account. If four complex items are encoded
with less precision than four simple items, comparisons at retrieval should be significantly harder
due to poorer discriminability between the test item and the low quality stored items, and
complexity effects should have been observed at load 4 in all similarity conditions. However, our
dissimilar and match data could be reconciled with resource theory if we consider that perhaps
the amount of information required to make a correct match and dissimilar non-match decision is
substantially less than the amount of information required to make a correct non-match similar
decision. In this sense, even four complex items appear to have been encoded with sufficient
precision, compared to simple items, to make an accurate retrieval response when the test item is
either highly discriminable from or an exact match with an item at encoding. Thus, it appears
that representational precision does not need to be perfect in order to make a correct match or
However, greater precision aids comparison processes when there is more ambiguity between
sample and test items, i.e., when they look similar but do not match.
It is notable that the majority of debate on slots and resource models focuses on WM
capacity limits that are inextricably determined during encoding. There is less consideration for
how resource distribution at encoding (whether fixed or flexible) subsequently influences the
ease with which sample and test items are compared at retrieval. Awh and colleagues propose a
2-factor model which attempts to accommodate both encoding and retrieval processes while also
integrating slots and resource accounts (Awh et al., 2007; Barton, Ester, and Awh, 2009; Fukuda
et al., 2010). The 2-factor model states that there are a fixed number of representations that can
be encoded into WM (i.e., 4) regardless of complexity, but memory accuracy is also sensitive to
the ability to make qualitative discriminations between representations held in WM and the test
item(s) at retrieval. In terms of explaining complexity effects, complex items inhabit one slot
each but are stored within each slot at lower precision than simple items due to individual
slot-based resource limits. Awh et al. (2007) suggest that high precision at encoding is required in
order to successfully discriminate between similar sample-test items. Complex items encoded
with less precision will be harder to discriminate from similar test items than simple items
encoded with greater precision. This 2-factor model appears to provide the best fit with our data.
If we also consider how the magnitude of the complexity effect in the similar condition
changes as load increases, resource models might predict that the precision of mnemonic
representations would decline more rapidly with increasing load for complex than simple items,
resulting in increasing complexity effect sizes with increasing load3. When we probe this
directly, there is a significant interaction between complexity and load in the similar condition
(F(3, 90) = 4.88, p = .003, ŋp2 = .14). However, our data do not support this when we examine
3
how t values and difference scores between simple and complex items change across loads in the
similar condition. While the magnitude of the complexity effect increases from load 1 (0.05)
through load 2 (0.18) to load 3 (0.21), it decreases at load 4 (0.16). This pattern of results does
not suggest that precision declines more rapidly with increasing load for complex than simple
items, and in our opinion better supports the 2-factor model in which both slots and precision are
intertwined. Some form of limit appears to have been reached at around 3 items in our study,
beyond which complexity effects diminish.
In contrast to the 2-factor model which proposes that encoding can influence retrieval,
there is also evidence to suggest dissociation between these two processes. Luria et al. (2010;
Experiment 4) presented coloured squares at encoding that were either all similar in colour to
one another or dissimilar. Therefore the number of items, information load per item, and
resource allocation (precision) per item were the same across similar versus dissimilar encoding
conditions, confirmed by the fact that the SPCN amplitude was not different between similarity
conditions. However, WM accuracy was impaired in the similar versus dissimilar condition,
indicating that comparison processes at retrieval were more difficult despite equivalent encoding
demands. Other work further emphasises that WM maintenance and retrieval processes might be
distinct with regards to capacity limits. For example, using contralateral delay activity (CDA) as
a marker of WM maintenance processes (similar to the SPCN), Luria and Vogel (2011) found a
relatively small reduction in CDA amplitude but a large increase in retrieval errors for complex
(multi-feature) versus simple items. This suggests that comparison errors at retrieval may not
necessarily reflect storage limits per se.
To conclude, we provide clear evidence that perceptual similarity of the test item to the
matched or rejected as a non-match. Our findings enable the construction of a more complete and
rounded picture of factors that can limit WM performance and raise some important questions
regarding current slots and resource models of WM capacity. The role of the retrieval stage in
WM is further emphasized: measures and models of WM capacity should consider not only the
quantity and quality of encoded/stored information but also how memory for that information is
probed (see Makovski Watson, Koustaal, & Jiang, 2010). It may be beneficial for future research
to examine the combined influence of complexity and similarity on WM accuracy using a more
fine-grained retrieval response to measure precision, such as the “shape wheel” used by Zhang
and Luck (2009).
REFERENCES
Alvarez, G.A., & Cavanagh, P. (2004). The capacity of visual short-term memory is set both by visual information load and by number of objects. Psychological Science, 15(2), 106-111.
Awh, E., Barton, B., & Vogel, E.K. (2007). Visual working memory represents a fixed number of items regardless of complexity. Psychological Science, 18(7), 622-628.
Barton, B., Ester, E.F., and Awh, E. (2009). Discrete resource allocation in visual working
memory. Journal of Experimental Psychology: Human Perception and Performance,
35(5), 1359-1367.
Bays, P.M., Catalao, R.F.G., & Husain, M. (2009). The precision of visual working memory is
set by allocation of a shared resource. Journal of Vision, 9(10), 1-11.
Bays, P.M. & Husain, M. (2008). Dynamic shifts of limited working memory resources in
Cowan, N. (2001). The magical number 4 in short-term memory: A reconsideration of mental storage capacity. Behavioural & Brain Sciences, 24, 87-185.
Duncan, J. & Humphreys, G.W. (1989). Visual search and stimulus similarity. Psychological
Review, 96(3), 433-458.
Eng, H.Y., Chen, D., & Jiang, Y. (2005). Visual working memory for simple and complex visual stimuli. Psychonomic Bulletin & Review, 12(6), 1127-1133.
Fukuda, K., Awh, E., & Vogel, E.K. (2010). Discrete capacity limits in visual working memory.
Current Opinion in Neurobiology, 20, 177-182.
Jackson, M.C. & Raymond, J.E. (2008). Familiarity enhances visual working memory for faces.
Journal of Experimental Psychology: Human Perception & Performance, 34(3),
556-568.
Jackson, M.C., Wu, C-Y., Linden, D.E.J., & Raymond, J.E. (2009). Enhanced visual short-term memory for angry faces. Journal of Experimental Psychology: Human Perception &
Performance, 35(2), 363-374.
Luck, S.J., & Vogel, E.K. (1997). The capacity of visual working memory for features and conjunctions. Nature, 390(6657), 279-281.
Luria, R., Sessa, P., Gotler, A., Jolicoeur, P., & Dell’Acqua, R. (2010). Visual short-term
memory capacity for simple and complex objects. Journal of Cognitive Neuroscience,
22, 496-512.
Luria, R. & Vogel, E.K. (2011). Shape and color conjunction stimuli are represented as bound
Ma, W.J., Husain, M., & Bays, P.M. (2014). Changing concepts of working memory. Nature
Neuroscience, 17(3), 347-356.
Makovski, T., Watson, L.M., Koustaal, W., & Jiang, Y.V (2010). Method matters: Systematic
effects of testing procedure on visual working memory sensitivity. Journal of
Experimental Psychology: Learning, Memory, & Cognition, 36(6), 1466-1479.
Shapiro, K.L. & Miller, C.E. (2011). The role of biased competition in visual short-term
memory. Neuropsychologia, 49, 1506-1517.
Vogel, E.K., Woodman, G.F., & Luck, S.J. (2001). Storage of features, conjunctions, and objects in visual working memory. Journal of Experimental Psychology: Human Perception &
Performance, 27, 92-114.
Zhang, W. & Luck, S.J. (2009). Sudden death and gradual decay in visual working memory.
Figure Captions
Figure 1. (a) Similarity rating task. This illustration shows an example shape on the left to which
participants compared a range of other shapes presented one by one. Participants rated each
shape on a scale of 1 to 5 where 1 = very dissimilar, 2 = dissimilar, 3 = somewhat dissimilar, 4 =
similar, 5 = very similar. Ratings were averaged into ‘similar’, ‘dissimilar’, or ‘neutral’
categories into which relating comparison items were placed for subsequent visual search and
WM experiments. Shapes were simple or complex, simple is shown here. (b) Visual search task
(Experiment 1). Participants viewed a single shape (target) and 600 ms later searched a visual
display of between 1 and 4 items for a match to the target. The target stayed visible in the centre
of the screen for the entire length of trial. A third of trials contained an exact target match, a third
contained a non-match but similar shape to the target, and the final third of trials contained a
non-match, dissimilar shape to the target. All other shapes in the search display were neutral with
respect to similarity to the target. Participants responded ‘yes’ (match present) or ‘no’ (no match
present) as quickly and accurately as possible within an unlimited time period. (c) Examples of a
complex and simple shape.
Figure 2. Reaction times (RTs) in milliseconds on correct trials only from the visual search task
(Experiment 1). Complex and simple search arrays contained an item that was (a) an exact
match, (b) a similar non-match, and (c) a dissimilar non-match to the target. Bars represent one
standard error above and below the mean.
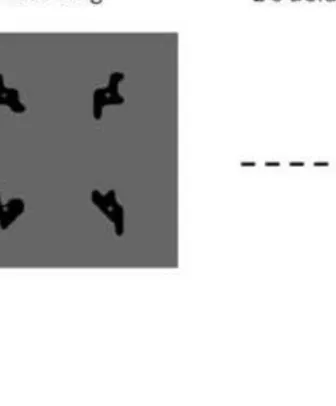
Figure 3. Visual working memory task (Experiment 2). Participants were required to remember
3), and 2400 ms (load 4). All items in a single trial were either complex or simple. A single item
was presented in the centre of the screen at retrieval. The test item was either an exact match, a
non-match but similar shape, or a non-match, dissimilar shape to one of the encoding items.
Participants responded ‘yes’ (match) or ‘no’ (non-match) as accurately as possible within a 3
second response window. A dissimilar non-match simple trial example is illustrated here.
Figure 4. Percent correct scores in the visual working memory task (Experiment 2). Complex
and simple encoding displays contained an item that was (a) an exact match, (b) a similar
non-match, and (c) a dissimilar non-match to the test item at retrieval. Bars represent one standard
Table Captions
Table 1. Visual search proportion correct accuracy scores (standard errors in brackets) as a
function of complexity, set size (SS), and similarity.
Table 2. k-iterative capacity estimates (standard errors in brackets) as a function of complexity
Table 1
Match Dissimilar
Non-Match
Similar
Non-Match
Complex SS 1 .97 (.01) .98 (.01) .88 (.02)
SS 2 .90 (.02) .96 (.01) .87 (.02)
SS 3 .87 (.02) .95 (.02) .93 (.01)
SS 4 .87 (.02) .93 (.02) .89 (.02)
Simple SS 1 .96 (.01) .97 (.01) .87 (.02)
SS 2 .89 (.02) .97 (.01) .96 (.01)
SS 3 .90 (.02) .96 (.01) .93 (.01)
[image:29.595.123.474.94.375.2]Table 2
Dissimilar
Non-Match
Similar
Non-Match
Complex 1.52 (.11) 0.95 (.10)