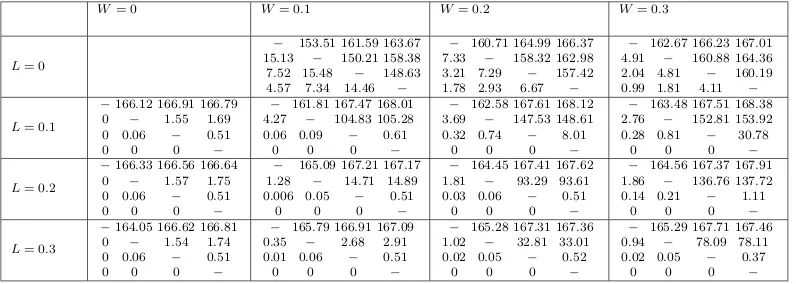
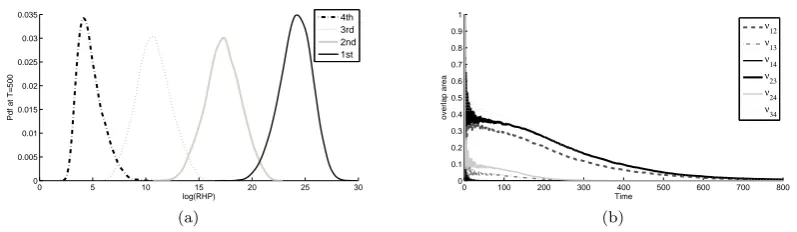
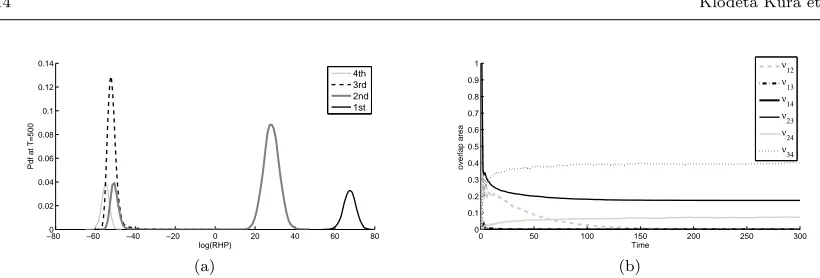
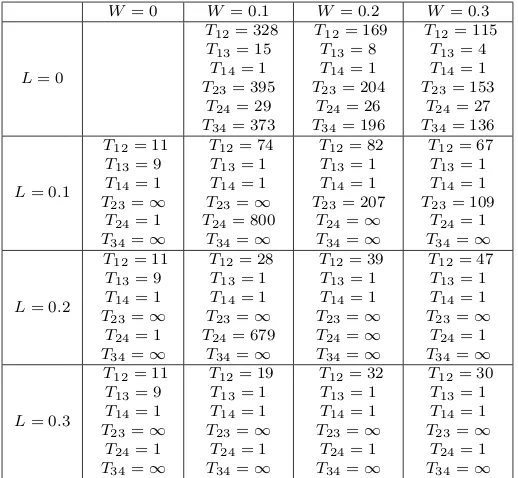
Modelling Dominance Hierarchies Under Winner and Loser Effects
Full text
Figure


Related documents
ValChoice is working to help the entire insurance industry – from consumers buying insurance to the agents selling insurance and companies offering insurance products – to
Based on the results obtained for the control sample as shown in the Table 4, there is statistical significant difference (p<0.05) between the samples of different
Life Cycle Assessment of Diesel, Natural Gas, and Hydrogen Fuel Cell Bus Transportation
The increase in Direct intercept and reduction in Slider slope both support the hypothesis that ageing is associated with an increased weighting of predictive models,
In this real-life primary care cohort, one in seven patients started ICS treatment prior to their diagnosis and approximately half of the patients started with a combination
compared to the good ad condition (2.5 percentage point delta, 6 percentage points for answer at bottom of
This study also investigated whether the form of feedback, video or traditional feedback, enabled learners incorporate more correction with feedback from different categories
Correlation analysis (Table 7) showed that diversity and richness indices of herbaceous plants and cover percentage significantly positively correlated in
