City, University of London Institutional Repository
Citation
:
Guo, L., Gao, S. & Fu, F. (2015). Structural performance of semi-rigid composite frame under column loss. Engineering Structures, 95, pp. 112-126. doi:10.1016/j.engstruct.2015.03.049
This is the accepted version of the paper.
This version of the publication may differ from the final published
version.
Permanent repository link:
http://openaccess.city.ac.uk/20055/Link to published version
:
http://dx.doi.org/10.1016/j.engstruct.2015.03.049Copyright and reuse:
City Research Online aims to make research
outputs of City, University of London available to a wider audience.
Copyright and Moral Rights remain with the author(s) and/or copyright
holders. URLs from City Research Online may be freely distributed and
linked to.
City Research Online: http://openaccess.city.ac.uk/ [email protected]
*Corresponding author. Tel.: +86 451 86289100
E-mail address: [email protected] (L.H. Guo).
Structural Performance of semi-rigid composite frame
under column loss
Lanhui Guo
a,b, Shan Gao
b, Feng Fu
ca. Key Lab of Structures Dynamic Behavior and Control, Ministry of Education, Harbin 150090, China
b. School of Civil Engineering, Harbin Institute of Technology, Harbin 150090, China
c. School of Engineering and Mathematical Science, City University London, London, EC1V0HB
Abstract: The catenary action associated to significant second order effects plays an important role in resisting the additional loads when structural column is destroyed under unexpected loads. The capacity and ductility of
beam-to-column connectionis one of the key factors in the formation and performance of catenary action. To study
the behavior of the semi-rigid connection under single column removal scenario, a pseudo-static test of a composite
frame with flush-endplate connections under the loss of middle column was carried out. Also, a FE model using both
3-D elements and 2-D elements was developed and analyzed. The accuracy of FE analysis results are validated by
comparing with the experimental results. The analytical results showed that the progressive collapse resistance is
sensitive to the properties of bolts. Increasing the fracture strain of bolts, the progressive collapse resistance of
composite frame improves obviously. Increasing the diameter of bolts shank could also increase the
loading-capacity and ductility of the connection. At last, some measures are suggested to improve the behavior of
connection in resisting progressive collapse. Among them, a new technique called angle-steel reinforcement method
is proved to be a good way to improve the progressive resistance of semi-rigid composite frame.
Keywords: composite frame; semi-rigid connection; material fracture; progressive collapse; reinforcement
1.
Introduction
The partial collapse of the Roman Point apartment in UK in 1968 is a milestone of the research in the structural
integrity of buildings. But the most recent catastrophes, such as the terrorist attack of the World Trade Center in
2001, have attracted increasing interest in engineering community on this topic. According to national design codes
such as British Standard [1], Eurocode [2] and ACI [3], the structural integrity should be ensured through
appropriate measures. But for different kinds of structures, it is difficult to find common guidelines to achieve this
goal. *Manuscript
After a vertical structural component is destroyed in an exceptional event, the loads on superstructures cannot
continue to be transferred downwards due to the loss of the member. Instead, the membrane effect was triggered in
the structure systems to carry the additional loads and redistribute the internal force. Based on this phenomenon, a
series of design codes, standards and guidelines have been published to prevent the progressive collapse of the
structure, such as GSA2003 [4], DoD2009 [5] and ASCE7-05 [6]. In these codes and standards, several methods are
proposed, including Alternate Load Path, Tie Force and especially so called “catenary action”.
The behavior of the beam-to-column connections plays an important role in the formation and performance of
catenary action. The connections are withstanding to a combined bending moment and tensional force, as a result of
column loss. Compared with bare steel connections and reinforcement concrete (RC) connections, composite
connections consisting of steel beams and RC slabs exhibit a higher load resistance and better deformation ability
[7-10]. In addition, the steel mesh in the composite slabs are also contributing to “catenary action” while the bare
steel connections can not satisfy the rotation demand for forming catenary action [5].
Many analytical and numerical studies on the behavior of structure under column loss have been performed. A
concise methodology for evaluating the predisposition of a structure to progressive collapse was proposed by
Buscemi and Marjanishvili [11]. The progressive collapse issue was reduced to a conventional dynamic problem by
using the pendulum analogy method. Khandelwal and EI-Tawil [12] performed a computational simulation to
investigate catenary action in moment resisting steel frames. Some parameters such as hardening, softening and
ductile fracture behavior of steel were considered. A new design-oriented methodology for progressive collapse
assessment of multi-storey composite buildings was developed by Izzuddin et al. [13]. Structural robustness at
various levels of structural idealization could be easily assessed by using this new methodology which makes
progressive collapse assessment more practical. Li and Wang [14] tested steel beam-to-tubular column moment
connections under a column removal scenario. Test results demonstrated that the beam-column assemblies resisted
the load applied at top the center column primarily by flexural action in the early stage of the response, and the
resistance mechanism gradually shifted towards relying on the catenary action as the vertical displacement increased.
Fu [15] developed a 3-D finite element model of 20-storey composite building. The numerical results represented
the overall behavior of the 20-storey building further to a sudden column loss and provided important information
for the assessment of high-rise buildings under column loss in practice.
Some tests of structure under the different scenarios of column loss have also been conducted. A 1/3 scaled
The experimental results showed that there were 4 phases which RC frame under column loss would go through.
Demonceau et al. [17] conducted a test simulating the loss of a column in a 2-D composite frame. Horizontal brace
was used as the lateral restraint of the frame. The catenary action in the frame was observed evidently and the
development of membrane force in the beams was confirmed by the experimental results. Yang and Tan [18]
conducted seven experimental tests focusing on the performance of bolted steel beam-column connections in
catenary action. The extremity of beams in the test was pinned as a simplified boundary condition. The experimental
results displayed the behavior and failure modes of different bolted connections, especially their deformation ability
in catenary action. The numerical analyses of the response of steel beam-column joints subjected to catenary action
were also performed [19]. Oosterhof and Driver [20] conducted a series of tests on steel shear connections under the
scenario of middle-column removal. Three types of shear connections were studied in a test set-up which is capable
of applying any independent combination of moment, shear and tension. The study indicated the relative
performance of three connection types under different combined loads. Li [21] finished two full-scale tests on steel
beam-to-tubular column moment connections. The results showed that the bolted-web connection provided extra
redundancy in terms of strength and deformability than the welded-web connection. Guo [22] conducted a 1/3
scaled progressive collapse resistance test of a rigid steel-concrete composite frame. The results showed that the
rigid composite frame exhibited good progressive collapse resistance behavior.
In the past, most of the studies on progressive collapse are focused on numerical and theoretical analysis.
Although some experimental studies were conducted recently to investigate the performance of the connection
under the scenario of column loss, in these tests, only the beam-to-column connections were tested within a
simplified boundary condition and no entire frame tests has been done so far. And also, as a result of using simplified
boundary condition, only the performance of the connections directly above the removal column was studied, and
the global behavior of the frame was not investigated.
In this paper, a composite frame with flush-endplate connections which is a typical semi-rigid connection was
tested under the loss of middle column. No extra lateral restraint on the frame is provided which allows the
connections to be tested in practical frame level. In addition, a finite element model incorporating the criteria of
material fracture was developed using ABAQUS to investigate the performance of semi-rigid composite frame
under column loss. Based on the analytical results, mitigating measurements to prevent the progressive collapse
2.
Experimental program
2.1. Design and fabrication of specimen
A 4-bay one-storey semi-rigid composite frame was designed and fabricated in 1/3 scale. The dimension and
material properties are same with the specimen in Re. [22]. The main difference is that the rigid connection was
applied in Re. [22]. In this test, the flush-endplate bolted connection, which is a typical semi-rigid connection, was
chosen throughout the frame. M16 high-strength bolts with grade 10.9 were used in the connections. The height of
storey was 1.2 m with a span of 2 m. The cross sections of steel beam and column were H200×100×5.5×8 and
H200×200×8×12 respectively [H-overall depth (d) ×flange width (bf) ×web thickness (tw) ×flange thickness (tf)].
The thickness of the endplate was 12 mm which was equal to the thickness of column flange. The depth and width of
RC slab were designed as 100 mm and 800 mm respectively. In the slab, two layers of 12-mm-diameter plane
reinforcements were placed in longitudinal plane with equal spacing along the width of the slab. Eight-mm-diameter
bars were used as transverse reinforcement to prevent longitudinal splitting failure of the concrete slab. The shear
studs of 16-mm-diameter with spacing of 100 mm were welded in the beam to achieve full shear interaction. The
strength of studs is 235 MPa. Detailed dimension of the specimen is shown in Fig. 1. The middle column was not
supported which is to simulate the loss of a column.
In the test, grade Q235 structural steel was used for all beams and columns, whereas grade HPB235 steel was
used for the steel reinforcement. Grade 10.9 bolts with a nominal ultimate tensile strength of 1000 MPa and nominal
yield strength of 900 MPa were used. The results of material test are listed in Table 1, where fy, fu, Es are yield stress,
tensile strength and elastic modulus of structural steel respectively. The 150×150 mm cubes tests for strength and
150×150×300 mm cylinder tests for Young’s modulus were carried out at the same time. They were cured in similar
conditions as the composite slab. The average compressive strength of concrete cubes obtained is 26.4 MPa. The
Young’s modulus of concrete is 4
2.65 10 MPa
.
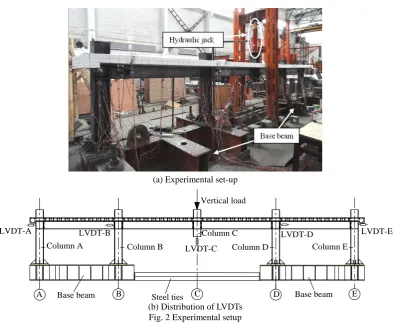
2.2. Experimental setup
The bottom of columns A, B, D and E were welded to two base beams which were fixed on the ground. Column
C was not supported, and this is to simulate the loss of column C. A 500 kN hydraulic jack was installed at the top of
the middle column C to apply vertical load in succession (see Fig. 2 (a)). It is easy to observe and investigate the
method. In elastic phase, the vertical load was applied with a load control method. After yielding was observed for
the steel members, displacement control method was adopted until the frame lost its load-bearing capacity.
One linear variable displacement transducers (LVDT) was placed vertically underneath middle column C to
monitor its vertical displacement, while four LVDTs were placed horizontally to measure the horizontal
displacement of columns A, B, D and E. The locations of LVDTs are shown in Fig. 2 (b).
3.
Experimental results and discussions
3.1. Observations
The initial behavior of the specimen was elastic without any evident change. The first cracks appeared at the top
of RC slab when the load reached 60 kN as shown in Fig. 3(b). At the load of 200 kN, the flange and web of steel
beams at the inner side of columns B and D tended to buckle as shown in Fig. 3(c). After the load exceeded 220 kN
(corresponding to the vertical displacement of 60 mm), the resistance of the frame began to decrease and the vertical
displacement of column C increased rapidly. The gap between the endplate and flange of column C was about 10
mm as shown in Fig. 3(d).
The displacement control method was adopted subsequently. When the vertical displacement of column C was
increased to 70 mm, slight crushing of RC slab around the flanges of column C was observed as shown in Fig. 3 (e).
When the vertical displacement of column C reached 90 mm, some debris of concrete at the bottom of slab near
column C began to peel off while the flange and web of steel beam BC on the inner side of columns B and D buckled
severely. After the vertical displacement of column C exceeded 150 mm, the load began to increase. When the
vertical displacement reached 338 mm, fracture of the bolts was observed in lower row of connection at column C
while the test was terminated. It indicates that the tensile strength and deformation ability of bolts are both important
factors need to be considered in design to resist progressive collapse for frame with semi-rigid connections.
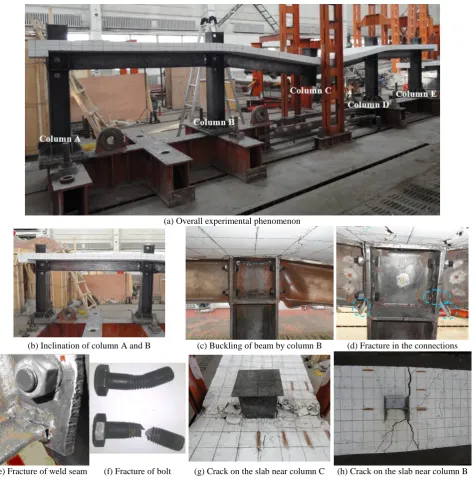
The phenomena of the frame after test are shown in Fig. 4. As shown in Fig. 4(b), columns B and D were
obviously inclined inwards to column C under catenary action. Severe buckling was observed on the bottom flange
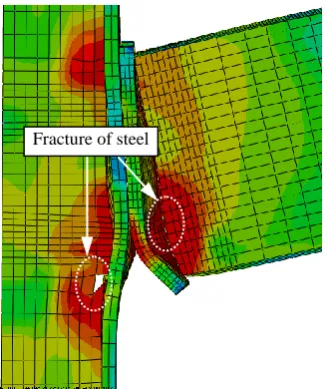
and web of the steel beams BC and CD as shown in Fig. 4(c). The weld seams between endplate and beam were
fractured on both sides of column C as shown in Fig. 4(d)-Fig. 4(e). Meanwhile the bolts at lower row of the
connections were fractured in tension as shown in Fig. 4(f) which also caused the loss of load-bearing capacity of the
frame. The crushing at the top of RC slab around column C was severe as shown in Fig. 4(g). The cracks which
3.2. Results and discussions
Fig. 5 shows the relationship between the vertical load and the vertical displacement of column C which is not
supported. Except the descending phase (after point F), the curve consists of six phases including: elastic phase,
elastic-plastic phase, arch phase, plastic phase, transient phase and catenary phase.
The part OA in the curve represents the first phase: "elastic phase". The load-deformation relationship of the
frame in elastic phase is linear as the specimen is almost in elastic and the deformation is small. After the load
reaches 107 kN, the curve goes into the second phase "elastic-plastic phase" which is from point A to point B.
Within this phase, the load increases non-linearly with the increase of displacement, meanwhile the stiffness of the
curve decreases.
The third phase is from point B to point C. This phase in which the curve presents a trend as arch is named as
"Arch phase". The resistance of the frame increases until it reaches the peak value of 220 kN which is defined as
"Peak resistance" when it starts to reverse. The load value of 206 kN at start-point B and end-point C is defined as
"Plastic resistance". This phenomenon is as a result of "Arch action" which refers to the feature of composite joints.
The "Arch phase" also appeared in the test of rigid composite frame, and the mechanical behavior of "Arch phase" was
introduced clearly in Re. [22].
After the "Arch phase", the resistance of the frame returns to the load of 206 kN which is the plastic resistance.
And then the fourth phase from point C to point D defined as "plastic phase" begins, when plastic hinges are fully
formed in the joint C and inner-side of joints B and D. During this phase, the resistance of the frame maintains about
206 kN while the vertical deflection increases successively.
During the "Plastic phase", 65 mm of extra vertical displacement was observed before the resistance of the frame
begins to rise. And then the curve enters the "transient phase" from point D to point E. During this phase, the
load-bearing mechanism of frame transforms from "plastic hinge action" to "catenary action".
After a slight declination in the stiffness of frame, the curve goes into the final phase named "catenary phase".
During this phase, the vertical load is sustained by catenary action. The loss of the moment resistance in the joints of
column C and the inner-side joints of columns B and D ceased "plastic hinge action". The slab reinforcement and
steel beam provided the tensional force caused by catenary action. The vertical load increases linearly with the
increase of vertical displacement.
The maximum resistance of frame before the collapse happens is defined as "Ultimate resistance" which is 1.1
correspondent to the ultimate resistance is 4 times bigger than the displacement correspondent to the peak resistance.
The composite frame with semi-rigid connections exhibited good progressive resistance behavior. However, the
composite frame with flush-endplate connections under middle column removal do not perform as well as the rigid
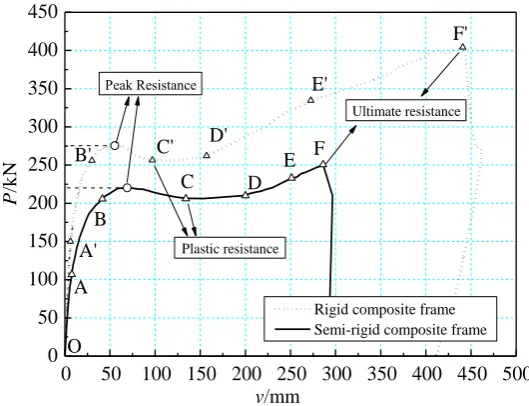
composite frame in Ref. [22]. A comparison of vertical load-displacement of middle column is shown in Fig. 6.
From Fig. 6, it can be seen that the rigidity and loading-capacity of semi-rigid composite frame are both lower than
those of rigid composite frame. Specially, in the catenary phase, the ultimate displacement of semi-rigid composite
frame is obviously smaller than that of rigid composite frame. In the following FE analysis, the reason of early
failure of semi-rigid composite frame is discussed.
Fig. 7 shows the relationship between the horizontal displacement at the top of columns and the vertical
displacement of middle column C. The vertical lines refer to the vertical displacement of point A to point F in Fig. 5,
while the bold vertical line refers to the vertical displacement at the peak resistance. Displacement moving towards
column C is defined as positive value. As shown in Fig. 7, the horizontal displacement at the top of each column is
negative value before the bold vertical line which means all the columns deform outwards from column C. This
phenomenon verified the existence of "arch action" presented in Fig. 5. Moreover, it reveals the fact that "arch
action" starts as soon as the load is applied, not purely existing in the arch phase. The horizontal displacement
increases reversely after the bold vertical line plotted in Fig. 5 corresponding to peak resistance while all the
columns begin to move towards column C. When "arch phase" ends at point C in Fig. 5, the horizontal displacement
of all the columns in Fig. 7 becomes zero. Subsequently, the horizontal displacement of column top continues to
increase following the increase of vertical displacement, until the test finishes. The horizontal displacement of
columns B and column D becomes larger than that of column A and column E during the loading process, especially
after the plastic phase. This is because column B and column D are withstanding hogging moment and tensional
force simultaneously while column A and column E are only withstanding tensional force caused by catenary action.
4.
Numerical analysis
4.1. Finite element modeling
In addition to the aforementioned analytical studies, a finite element model using ABAQUS [23] is developed to
simulate the test introduced in this paper. In order to investigate the behavior of flush-endplate connection in detail,
a solid model is employed in the middle joint, where solid element (C3D8R) is used to simulate the concrete slab,
reinforcements are fully embedded in the concrete slab ignoring the slippage between concrete slab and
reinforcement. The remaining components of the frame are simulated by shell element (S4R) and beam element
(B31), where steel beams and reinforced concrete slabs are coupled together using *Tie command to simulate the
composite action. For concrete slabs, the “Shell-to-Solid Coupling” command is used to connect the solid element
and shell element of concrete slab. For steel beam, the “Coupling” command is used to connect the shell element and
beam element. In the middle joint of the model, the preloads in bolts are chosen as the same as the test. The
surface-to-surface interaction contact between endplate and column flange is considered. The finite element model
is shown in Fig. 8. Due to the symmetrical arrangement of the test, the model only replicates 1/2 of the test specimen
with corresponding symmetrical boundary condition applied. The dimensions and properties are identical to these of
the test specimen. A reversed vertical load is applied on the top of middle column successively to simulate the
scenario of column removal.
In the simulation, the material properties of steel member and bolts were the same as the material test. Fracture
strain of steel member and bolts were 0.3 and 0.15 respectively according to the results of the material test. The
concrete damage plasticity model from ABAQUS library is used to model the concrete material. The compressive
and tensile stress-strain relationship curves are shown in Fig. 9. 10% of compressive strength of concrete is taken as
the tensile strength of concrete. The remaining strength after concrete cracking in tension is 0.5 MPa.
4.2. Simulation strategy
In this paper, both static and quasi-static solvers are used to conduct numerical simulations. Although static
solver is widely used, convergence requires more efforts in the analysis. Specially, the material fracture is difficult to
be captured in the static solver. In the progressive collapse resistance analysis, modeling material fracture as well as
modeling complex contact makes the convergence more challenging. Quasi-static solver which is performed by the
explicit dynamic solver can overcome the convergence difficulties of material fracture. In order to minimize the
dynamic effect, loading duration should be longer than 10 times of the fundamental period of the structure. A
loading period of 1.25 s was adopted in the following simulation. The material fracture criterion in ABAQUS [23] is
a phenomenological model for predicting the damage. Once the fracture strain is reached, the damaged elements
would be deleted from the model.
4.3. Model validation and result analysis
The FE model was validated against the experimental results as shown in Fig. 10. Good agreement is achieved in
is because the limitation of the 2D beam elements and 2D shell elements used in the simulation. Due to the dynamic
effect, the result of quasi-static analysis is slightly smaller than the result of static analysis. Without considering
material fracture, the result of static analysis can’t present the ultimate status of the structure. However, the
quasi-static model can predict the ultimate status of the structure accurately. The detailed results of the test and
simulation are listed in Table 2.
In the test, the structure failed by the fracture of the bolts in middle joint. Similar result is achieved in the
simulation. As shown in Fig. 11, the damage of the model was also caused by the fracture of the bolts in middle joint.
It is found that the quasi-static analysis using explicit dynamic solver could simulate the fracture initiation and
evolution until complete failure of the bolts. The fracture on the bolts initiated near the endplate due to the bending
deformation of endplate. The failure mode is similar to the experimental results as shown in Fig. 4 (f). There is no
fracture observed near the bottom flange of the steel beam. This is because the weld was not simulated in the model
and the flange was directly connected to the web in the simulation.
5.
Parametric analysis
It is seen from the experimental results and simulation results that, the behavior of bolts in the connection plays an
important role in the performance of model under column removal. Hence the parameters which were chosen for the
study are those which affect the behavior of bolts are adopted in the following analysis as shown in Table 3. In the
study, only one parameter is changed at each group of analysis, the remaining factors are the same.
5.1. Effect of fracture strain of bolt
In the test, the fracture strain observed was 0.15. In the following analysis, the fracture strain of bolt was chosen
as 0.1, 0.15 and 0.2 respectively in this study. The analytical results are shown in Fig. 12. It can be seen that the
failure of the semi-rigid composite frame is caused by the fracture of bolts. With the loss of middle column, the
adjacent connection is subjected to sagging moment and tension. In this case, the bolts at lower row are subjected to
high tension, therefore fail due to high strain. The failure phenomenon of bolt is shown in Fig. 12 a).
The P-v relationship curves from modeling result are shown in Fig. 12b). It is can be seen that, although the
model with the fracture strain of 0.1 presents good rotation capacity after column removal, it did not finish the
transition of load-bearing mechanism in the transient phase, and less ductility was observed. The model adopting the
fracture strain of 0.15 went through the transient phase but did not perform well in the catenary phase. The model
preventing progressive collapse has a higher demand to the fracture strain of bolt. The ultimate displacement of this
model reaches 325 mm which is still smaller than that of rigid composite frame (443 mm) in Ref. [22].
5.2. Effect of bolt diameters
In this study, M16 (diameter of 16 mm) and M20 (diameter of 20 mm) bolts are chosen for the analysis. As
discussed in section 5.1, increasing the fracture strain of bolt could improve the behavior of the semi-rigid composite
frame under column removal. And yet, high-strength bolts with large fracture strain are not feasible in practice.
Therefore replacing the bolts in the lower row with larger diameter bolts would decrease the stress (or strain) of the
bolt, which is also a practical way to avoid the early brittle failure of bolts.
As shown in Fig. 13, increasing the diameter of bolts in the lower row improves the behavior of the frame under
column removal. The ultimate displacement of the model with M20 enhanced to 503 mm, which is larger than that of
rigid composite frame in the test of Re. [22]. It is worth noting that the failure mode of the model has changed when
the specimen reaches its ultimate resistance. For specimen with bolt of M20, when it reaches its ultimate resistance,
the maximum strain of the bolts is lower than the fracture strain. However, the strain of beam web near bottom flange
and the strain near beam web reach the fracture strain of steel (as shown in Fig. 14), which is selected as 0.3 in FE
model . After the ultimate stage, the fracture of steel developed rapidly, and the solution is not convergent. Based on
the analytical results of bolt diameters, it can be found that increasing the diameter of bolts can avoid its early failure of the
connection, and both load-capacity and ductility increase obviouly, thus the progressive resistance is improved.
6.
Measure to mitigate progressive collapse
Through above results and analysis, the bolts in the lower row of the middle joint play an important role in
catenary phase. It indicates that the tension zone of the connection should be reinforced or enhanced to prevent the
progressive collapse. However, it is difficult to change bolts for existing building, alternative reinforcement methods
are proposed in this study and it is found to be an effective way to improve the progressive collapse resistance of
composite frame with semi-rigid connection.
6.1. Welding reinforcement
Welding reinforcement is a simple way to mitigate the progressive collapse resistance of composite frame with
semi-rigid connection. As shown in Fig. 15, a 8 mm leg-size welding seam is added to the bottom of the endplate.
the fracture strain of the welding seam is defined as 0.2. In the FE model, the welding seam is simulated by solid
element, and ties the bottom of endplate and column flange together.
The comparison of vertical load-displacement relatioship curves is shown in Fig. 16. It can be seen that there is
no obvious influence on the initial rigidity of connection. The reason is that the connection is mainly subjected to
bending moment in the elastic phase, the preload in the bolts make the flush-endplate and column flange contact
tightly. Therefore, in the elastic phase, the weding between flush-endplate and column flange is subjected to little
force. In the plastic phase, the tension of beam increases, and the flush-endplate and column flange have the trend to
separate. At this time, the weld is subjected to tension. When the vertical displacement reaches 260 mm, the vertical
load decreases 10% which is caused by the material failure of welding seam. Then the bottom bolts continue to resist
the tension of the beam in catenary phase.
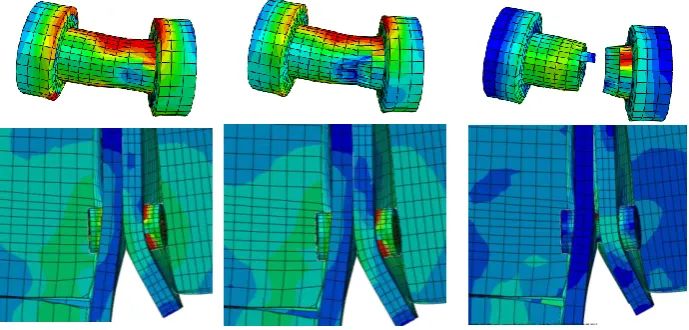
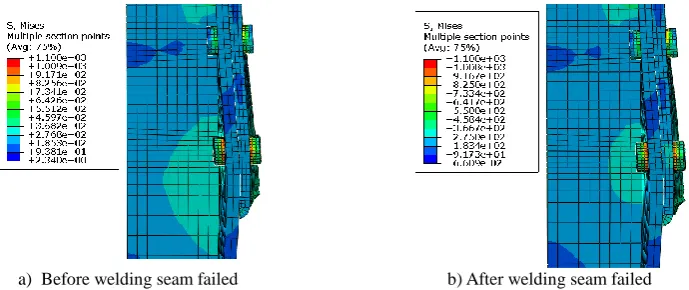
As shown in Fig. 17, the welding seam make the deformation of the endplate decrease. The welding seam carries
tensile load with the bolts in the lower row. After the welding seam fails, the stress on the column web is
redistributed when the behavior of the model is similar to the unreinforced model. As shown in Fig. 18, the failure of
the model is caused by the fracture of the bolts in the lower row.
Based on the above analysis, it can be seen that welding reinforcement could improve the behavior of connection.
Although this method does not change the final failure mode of the model, it brings an alternative way to carry and
redistribute the tensile load. However, it is important to ensure the property of welding seam and avoid it from
premature fracture.
6.2. Haunch reinforcement
Among a variety of retrofit methods, welding a triangle haunch beneath the beam has been shown to be very
effective for repair, rehabilitation or new construction [4-5]. In the appendix D of GSA guideline [4], rigid steel
connection with haunch is recommended to use in the design of preventing progressive collapse, as shown in Fig. 19.
According to SAC design criteria [24], a haunch plate made from a 100 8 mm section of Q235 steel is adopted and
added beneath the beam, as shown in Fig. 20.
As shown in Fig. 21, the improvement in resistance of progressive collapse through haunch reinforcement is
remarkable. The initial stiffness and plastic resistance of the model are increased by 33% and 25% respectively. For
specimen with haunch reinforcement, the vertical load does not increase anymore when fracture failure initiates on
the bolts and the edge of haunch plate with the displacement of 370 mm. After that, the force on the haunch plate
about 390 mm. The failure of the model is caused by the fracture of bolts which is a brittle failure mode. Based on the
analytical results, it is worthwhile to note that the haunch reinforcement improves the behavior of the model
remarkably, although it still failed with brittle failure mode. In this study, the tensile resistance of haunch plate (220
kN) is closed to that of the bolts in the lower row (191 kN). In practical design, haunch plate should possess
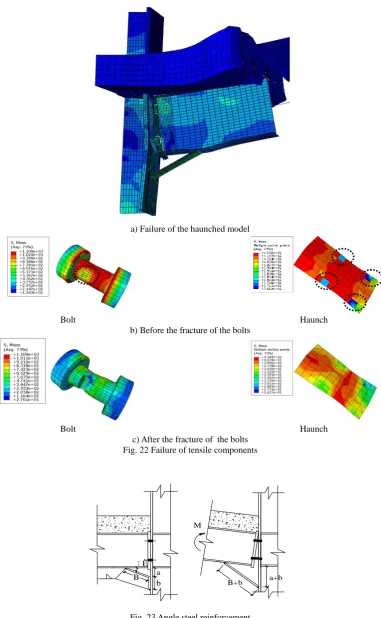
sufficient strength to carry and redistribute the additional load brought by the fracture of the bolts. Fig. 22 shows the
failure mode of the connection with haunch reinforcement. The fracture failure of bolt appears when the model
reaches its the ultimate resistance.
6.3. Angle-steel reinforcement
As shown in the experimental test results (in Fig. 5), the flush-endplate connection still behaved well in transit
phase, and then failed in the early stage of catenary phase. Both the welding reinforcement method and the haunch
reinforcement method not only improve the behavior of the joint in the catenary phase, but also change the initial
stiffness and platic resistance of the joint. As we know, the rigidity of connection would influence the load
distribution of beams and columns. If the behavior of joint could satisfy the design demands under service loads,
there is no need to change the initial stiffness and plastic resistance of the joint, but only improve the behavior of the
joint in transient and catenary phase.
Based on this purpose, a new angle-steel reinforcement method is proposed in this research as shown in Fig. 23.
An angle unit is added beneath steel beam whose tips are welded to the flanges of beam and column respectively.
Under service loads, angle unit is not involved in load-resistance. Following the increase of joint rotation, angle steel
is straightened under tensile stress ( the load is the dynamic load cause by the removal) and involved in
load-resistance gradually. Comparing to haunch and other reinforcing methods, this new method does not influence
the design under service loads meanwhile it improves the robustness of joint to prevent the failure. Based on the
design guideline for haunch reinforcement, the design parameters used for angle-steel reinforcement in this study is
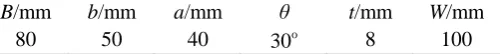
shown in Table 4. The symbol of t and W represents the thickness and the width of the angle steel respectively.
Fig. 24 a) shows the influence of angle-steel reinforcement. In the early phase, two curves are almost identical to
each other. When the vertical displacement reaches 100 mm, the model reinforced with angle steel enters into the
transient phase. However, the original model without reinforcement is still in the plastic phase. When the
displacement reaches 175 mm, the reinforced model enters into the catenary phase, where the vertical load increase
with the displacement linearly. The failure of the model is caused by the fracture of the bolts in the lower row and
Fig. 24 b) shows the deformation of angle steel. L represents the distance between two tips of the angel steel.
With the increase of the vertical displacement, the distance between two tips increases linearly. As soon as the
vertical displacement reaches 172 mm, the slope of the curve decreases. The distance L is about 130 mm which
equals to the sum of B and b. It indicates that the angle steel has been straightened and involved in load-resistance.
When the bolts fractured at 380 mm, the slope of the curve increases remarkably which means the angel steel doesn’t
have enough strength to carry the additional load brought by the fracture of the bolts in the lower row.
For angle steel reinforcement, the bending angle of the section is an important parameter. In the following analysis,
the total length of two angle width keeps constant of 130 mm. The width and thickness of angle steel are same as
presented in Table 4. The bending angle is changed by changing the distance a between the bottom flange of beam
and angle steel as shown in Fig. 25. The bending angle changes from 104o to 140o. The varied models are named by
the parameter of a, such as AS40 which represents the distance “a” being 40 mm.
Fig. 26 and Table 5 show the influence of bending angle on the structural performance. For those three models, the
failure mode is the same, which is the fracture failure of bolts result in the final failure of semi-rigid composite frame.
In the model, the angle steel resists a little load before it takes any load. The angle of angle steel AS20 is the smallest,
the way to be straight is the longest. Before the angle steel becomes straight, the lower row bolts have resisted large
tensile load. The bolts in AS20 model firstly fails. Hence the ultimate displacement of AS20 is smallest in these three
models. As shown in Fig. 26 b), when the angle steel of AS40 is straightened at the vertical displacement of 175 mm,
the curves of AS 40 and AS60 in Fig. 26 a) become consistent. When the angle steel of AS20 is straightened at about
225 mm, three curves in Fig. 26 a) almost overlap together. It is worthy to note that after the angle steel has been
straightened, the angle between the angel steel and beam has no obvious effect on the behavior of the model.
Based on the above analysis, it can be seen that angle steel reinforcement is a good way to improve the progressive
resistance of semi-rigid composite frame. Because it doesn’t change the initial rigidity of the connection, thus it
wouldn’t influence the distribution of force under service load. Only in the centenary phase, after the angle steel is
fully straightened, the behavior of the semi-rigid composite frame would be improved remarkably.
7.
Conclusions
A steel-concrete composite frame with semi-rigid flush-endplate connections was tested. The performance of the
frame under column removal in different phases was studied. Based on the analysis results, a finite element model
Both static solver and quasi-static solver are used. Based on the experimental and numerical analysis, following
conclusions are made.
1. The composite frame with flush-endplate connection exhibits good progressive resistance. The flush-endplate
connection fails by fracture of bolts under catenary action. Comparing with the experimental result of rigid
composite frame, the load resistance and deformation capacity are both higher than those of semi-rigid
composite frame.
2. The design of preventing progressive collapse has a higher demand to the fracture strain of bolt than
conventional design. Increasing the diameter of bolts or fracture strain of bolts, the progressive resistance of
semi-rigid composite frame can be improved.
3. Welding and haunch reinforcement could enhance the resistance to collapse under column removal. While the
rigidity of the connection would be changed in the frame, which would influence the distribution of force for
frame under service load.
4. A new angle-steel reinforcement measurement was proposed which could improve the behavior of the frame in
transient and catenary phase.
Acknowledgements
The project is supported by National Natural Science Foundation of China (NO. 50878066), China Scholarship
Council and Heilongjiang Postdoctoral Science Foundation, which are gratefully acknowledged.
References
[1] British Standard Institute. BS6399: loading for buildings, part 1: code of practice for dead and imposed loads.
London (United Kingdom). 1996.
[2] European Committee for Standardization. EN 1994-1-1: 2003, Eurocode 4: design of composite steel and
concrete structures. Part 1: general rules and rules for buildings. Brussels (Belgium). 2003.
[3] American Concrete Institute (ACI). Building code requirements for structural concrete and commentary (ACI
318m-08). Detroit (Michigan). 2008.
[4] United States General Services Administration (GSA). Progressive collapse analysis and design guidelines for
new federal office buildings and major modernization projects. Washington (DC). 2003.
[5] Department of Defense (DoD). Unified facilities criteria (UFC): design of structures to resist progressive
collapse. Washington (DC). 2009.
[6] American Society of Civil Engineers (ASCE). Minimum design loads for buildings and other structures
(ASCE7-05). Reston (VA). 2005.
[8] Anderson D., Najafi AA. Performance of composite connections major axis end plate joints. J Constr Steel Res
1994; 31(1):31-57.
[9] Liew Richard J.Y., Teo T.H., Shanmugam N.E., Yu C.H. Testing of steel concrete composite connections and
appraisal of results. J Constr Steel Res 2000; 56(2):117-150.
[10] Li Y., Lu X., Guan H., Ye L. An improved tie force method for progressive collapse resistance design of
reinforced concrete frame structures. Eng Struct 2011; 33:2931-2942
[11] Buscemi N., Marjanishvili S. SDOF model for progressive collapse analysis. Proceedings of the 2005
Structures Congress. ASCE. 2005.
[12] Khandelwal K., EI-Tawil S. Collapse behavior of steel special moment resisting frame connections. J Struct
Eng-ASCE 2007; 133(5):646-655.
[13] Izzuddin B.A., Vlassis A.G., Elghazouli A.Y., Nethercot D.A. Progressive collapse of multi-storey buildings
due to sudden column loss-Part 1: Simplified assessment framework. Eng Struct 2008; 30(5): 1308-1318.
[14] Li L., Wang W., Chen Y.Y., Lu Y. Experimental investigation of beam-to-tubular column moment connections
under column removal scenario. J Constr Steel Res 2013; 88:244-255.
[15] Fu F. Progressive collapse analysis of high-rise building with 3-D finite element modeling method. J Constr
Steel Res 2009; 64:1269-1278.
[16] Yi W.J., He Q.F., Xiao Y. Collapse performance of RC frame structure. J Building Struct 2007; 28(5):104-117.
(in Chinese)
[17] Demonceau J.F., Jaspart J.P. Experimental test simulating a column loss in a composite frame. Adv Steel
Constr 2010; 6:891-913.
[18] Yang B., Tan K.H. Experimental tests of different types of bolted steel beam–column joints under a
central-column-removal scenario. Eng Struct 2013; 54:112-130
[19] Yang B., Tan K.H. Numerical analyses of steel beam–column joints subjected to catenary action. J Constr
Steel Res 2012; 70:1-11
[20] Oosterhof S.A., Driver R.G. Performance of steel shear connections under combined moment, shear and
tension. The Structures congress, 2012.
[21] Li L., Wang W., Chen Y.Y., Lu Y. Experimental investigation of beam-to-tubular column moment connections
under column removal scenario. J Constr Steel Res 2013; 88:244-255
[22] Guo L.H., Gao S., Fu F., Wang Y.Y. Experimental study and numerical analysis of progressive collapse
resistance of composite frames. J Constr Steel Res 2013; 89:236-251.
[23] ABAQUS theory manual. Version 10.0.1 Hibbitt. Pawtucket (RI): Karlsson and Sorensen, Inc. 2003.
Tables
Table 1 Mechanical properties of steel
Se. f(y MPa) f(u MPa)
Es
(105MPa) Beam Flange 269 401 1.96
Web 275 411 2.09
Column Flange 247 396 2.00 Web 276 415 1.98
[image:17.595.94.511.256.323.2]Reinforcement Φ12 Φ8 325 487 - 331 464 1.95 Grade 10.9 bolt Φ16 1067.4 1186 2.00
Table 2 Detailed results of test and simulation Plastic resistance
(kN)
Ultimate resistance (kN)
Initial stiffness (kN/mm)
Ultimate displacement (mm)
Test 203.7 250.9 15.8 286.2
Static analysis 198.0 - 14.6 -
[image:17.595.140.457.349.417.2]Quasi-Static analysis 197.5 238.5 14.7 276
Table 3 Parameters adopted in the analysis
Fracture strain of bolt Diameter of bolt Concrete slab
Test model 0.15 M16 Existing
Models in Part 5.1 0.10 M16 Existing
0.20 M16 Existing
Models in Part 5.2 0.15 M20 Existing
[image:17.595.177.428.456.483.2].
Table 4 Design parameters of angle-steel reinforcement
B/mm b/mm a/mm θ t/mm W/mm
80 50 40 o
[image:17.595.61.537.523.571.2]30 8 100
Table 5 Analytical results under different bending angles
Plastic resistance(kN) Ultimate resistance(kN) Initial stiffness(kN/mm) Ultimate displacement(mm) AS20 197.6 322.9 14.7 356
AS40 197.5 334.9 14.7 380 AS60 198.2 338.0 14.7 392 Table
Figures
A B C D E
(a) Detail dimension of frame (mm)
-130x12 220
d0=18mm
(b) Flush-endplate beam-to-column connection (c) Cross section of composite beam Fig. 1 Details and layout of frame
(a) Experimental set-up
A B C D E
Column A LVDT-A
Column B Column D Column E
Column C Vertical load
Base beam Steel ties Base beam
LVDT-B
LVDT-C
LVDT-D LVDT-E
(b) Distribution of LVDTs Fig. 2 Experimental setup Figure
[image:18.595.102.498.396.719.2](a) Positions of observation
(b) First crack at the top surface (c) Slightly buckling (d) Gap in the connection (e) Crush of concrete Fig. 3 Phenomena of frame during experiment
柱A
柱B
柱C
(d)
(b)
(c)
(a) Overall experimental phenomenon
(b) Inclination of column A and B (c) Buckling of beam by column B (d) Fracture in the connections
(e) Fracture of weld seam (f) Fracture of bolt (g) Crack on the slab near column C (h) Crack on the slab near column B Fig. 4 Phenomena of frame after experiment
0 50 100 150 200 250 300 350
0 50 100 150 200 250 300 350
Plastic resistance
Peak resistance
3.Arch phase 4.Plastic phase 5.Transient phase 6.Catenary phase
2.Elastic-Plastic phase
1.Elastic phase
F
O
Ultimate resistance
E
D C B
A
L
o
ad
o
f
co
lu
m
n
C
/k
N
[image:20.595.65.542.67.546.2]Displacement of column C/mm
0 50 100 150 200 250 300 350 400 450 500 0 50 100 150 200 250 300 350 400 450
Rigid composite frame Semi-rigid composite frame
F'
E'
D' C'
B
A' Plastic resistance
Peak Resistance F O Ultimate resistance E D C B' A P /k N v/mm
Fig.6 Comparison between rigid composite frame and semi-rigid composite frame
0 50 100 150 200 250 300 350 -3 0 3 6 9 12 F D C B A E column D column B column E column A
Vertical displacement of column C/mm
[image:21.595.169.434.71.274.2]H o ri z o n ta l d is p la c e m e n t o f c o lu m n t o p /mm
Fig. 7 Horizontal displacement of column top v.s. vertical displacement of middle column curves
(a) Overall model
[image:21.595.179.414.311.489.2](a) Compressive relationship (b) Tensile relationship Fig. 9 Stress-strain relationship of concrete
0 50 100 150 200 250 300 350 400 450 500 0
50 100 150 200 250 300 350
Test result Quasi-static analysis Static analysis
O
L
o
ad
o
f
co
lu
m
n
C
/k
N
Displacement of column C/mm
Fig. 10 Vertical load vs. displacement of middle column relationship curve
[image:22.595.124.469.424.589.2]
0 50 100 150 200 250 300 350 0
50 100 150 200 250
fracture strain=0.20 fracture strain=0.15 fracture strain=0.10
P
/k
N
v/mm
[image:23.595.244.465.338.493.2]a) Position of fractured bolts b) P-v relationship curves
Fig. 12 Effect of fracture strain of bolts
Bolts in the lower row
0 50 100 150 200 250 300 350 400 450 500 550 0
50 100 150 200 250 300 350 400
M16 M20
O
P
/k
N
v/mm
[image:23.595.224.388.522.717.2]Ultimate status
Fig. 13 Effect of bolt diameters
Fig. 14 Fracture of steel corresponding to the ultimate resistance
Fig. 15 Welding reinforcement
0 50 100 150 200 250 300 350 400 450
0 50 100 150 200 250 300
Welding reinforcement No reinforcement
O
P
/k
N
[image:24.595.191.404.272.432.2]v/mm
Fig. 16 Analysis result of welding reinforcement
[image:24.595.128.473.463.608.2]a) Before bolts fractured
[image:25.595.119.488.85.315.2]b) After bolts fractured
Fig. 18 Mises stress contour before and after bolts fractured
30¡ã
[image:25.595.367.464.355.487.2]80
Fig. 19 Rigid steel connection with haunch Fig. 20 Semi-rigid composite joint with haunch
0 50 100 150 200 250 300 350 400 450
0 50 100 150 200 250 300 350 400
Haunch reinforcement No reinforcement
O
P
/k
N
v/mm
[image:25.595.100.250.361.483.2] [image:25.595.191.405.517.672.2]a) Failure of the haunched model
Bolt Haunch
b) Before the fracture of the bolts
Bolt Haunch
c) After the fracture of the bolts Fig. 22 Failure of tensile components
B b ¦ È
a
M
[image:26.595.107.489.91.710.2]B+b a+b
0 50 100 150 200 250 300 350 400 450 0 50 100 150 200 250 300 350 400 Angle-steel reinforcement No reinforcement O P /k N v/mm
0 50 100 150 200 250 300 350 400 450
110 115 120 125 130 135 140
Distance between two tips of angle steel
L
/m
m
v/mm
a) Vertical load-displacement curves b) Deformation curve of angle steel Fig. 24 Analysis result of angle steel reinforcement
80
50 20
104¡ã 80 50 40 120¡ã 80 50 60 140¡ã
a) AS20 b) AS40 c) AS60 Fig. 25 Local dimension of AS20, AS40 and AS60
0 50 100 150 200 250 300 350 400 450
0 50 100 150 200 250 300 350 AS60 AS40 AS20 O P /k N v/mm
0 50 100 150 200 250 300 350 400 450
100 110 120 130 140 AS60 AS40 AS20 l /m m v/mm