City, University of London Institutional Repository
Citation
:
Kaparias, I., Liu, P., Tsakarestos, A., Eden, N., Schmitz, P., Hoadley, S. and Hauptmann, S. (2015). Development and testing of a predictive traffic safety evaluation tool for road traffic management and ITS impact assessment. Paper presented at the mobil.TUM 2015 International Scientific Conference on Mobility and Transport, 30-6-2015 - 1-7-2015, Munich.This is the accepted version of the paper.
This version of the publication may differ from the final published
version.
Permanent repository link:
http://openaccess.city.ac.uk/12184/Link to published version
:
Copyright and reuse:
City Research Online aims to make research
outputs of City, University of London available to a wider audience.
Copyright and Moral Rights remain with the author(s) and/or copyright
holders. URLs from City Research Online may be freely distributed and
linked to.
City Research Online: http://openaccess.city.ac.uk/ [email protected]
Development and testing of a predictive traffic safety evaluation tool for road traffic management and ITS impact assessment
Ioannis Kaparias
Collaborative Transport Hub, City University London,
Northampton Square, London EC1V 0HB, UK
Peng Liu
Collaborative Transport Hub, City University London,
Northampton Square, London EC1V 0HB, UK
Antonios Tsakarestos
Chair of Traffic Engineering and Control, Technische Universität München,
Arcisstraße 21, 80333 München, Germany
Niv Eden
Transportation Research Institute, Technion – Israel Institute of Technology,
Technion City, Haifa 32000, Israel
Pierre Schmitz
Bruxelles Mobilité, Brussels Capital Region,
Rue du Progrés 80, Brussels 1035, Belgium
Suzanne Hoadley
POLIS – European Cities and Regions Networking for Innovative Transport Solutions,
Rue du Trône 98, Brussels 1050, Belgium
Susanna Hauptmann
International Traffic & Transport Associations, Kapsch TrafficCom,
Am Europlatz 2, Vienna 1120, Austria
Abstract
1. Introduction
Cities today share common transport problems and objectives with respect to road traffic management, and put great focus on Intelligent Transport Systems (ITS). The market offers decision-makers a variety of solutions, from which they are required to choose the most suitable and effective ones. Making this choice is a non-trivial task, however, especially given that transport problems are multi-dimensional by nature. Hence, a performance evaluation framework that addresses the various dimensions of transport problems, while at the same time reflecting the perspectives and priorities of decision-makers, is required [1].
In recent research work (FP7 CONDUITS) such an evaluation framework was formulated, consisting of a set of Key Performance Indicators (KPIs) for four strategic themes of road traffic management: efficiency, safety, pollution reduction and social inclusion [2]. The KPIs were subsequently validated through before- and after- evaluation of real-world case studies in the cities of Paris, Rome, Tel Aviv and Munich, using real data supplied by the local authorities and transport operators [3-4]. Through the conduct of the case studies, it was concluded that the KPIs were easy to apply and required already available data, thus forming a very useful evaluation tool for assisting decision-makers in the field of road traffic management and ITS, and to some extent for identifying best practice and lessons learnt elsewhere.
Yet the necessity for extending the CONDUITS framework from its current state of a tool for evaluating existing systems to a tool for evaluating future systems becomes apparent, given the current economic climate and the increasing need of making as informed decisions as possible. Follow-up work within the context of the CONDUITS-DST spinoff project, sponsored by Kapsch TrafficCom, has concentrated on integrating the CONDUITS KPIs with microscopic traffic simulation. The outcome has been a predictive evaluation tool for road traffic management and ITS, called CONDUITS_DST, in which two of the four KPI categories have been integrated to date: the pollution generated by the various transport modes in the form of greenhouse gas emissions, and the traffic efficiency, expressed through measures such as travel time and network reliability. Preliminary testing of the tool in three European cities (Brussels, Stuttgart and Tel Aviv) using existing microscopic traffic simulation models has, again, confirmed the validity of the methodology and has demonstrated the viability, usefulness and timeliness of the approach [5-7].
The main advantages of the predictive evaluation approach using the KPIs and CONDUITS_DST are that it provides the means to present results to non-expert audiences (such as politicians) in a simple, fast and effective way, but also that it allows estimating impacts of policies and measures before they actually occur. And while for the evaluation in terms of traffic efficiency and pollution the latter is a useful feature that contributes to the effectiveness of the transport policy- and decision-making process, for the theme of traffic safety it is absolutely critical, as conclusions need to be reached and decisions be taken before any accidents happen. In practical terms this means that CONDUITS_DST should be able to estimate traffic safety impacts using surrogate measures relating to traffic characteristics, as available from microscopic traffic simulation; historical data (e.g. accident numbers), then, when available, would only be used as a complement.
The paper is structured as follows: Section 2 introduces the background of the study, including the CONDUITS performance evaluation framework (KPIs) for traffic safety and a review of existing traffic safety impact assessment measures from the literature. Section 3 then goes on to formulate the methodology for the predictive safety evaluation in terms of accident numbers, direct safety impacts and indirect safety impacts. The results of the testing of the method on the case study in Brussels are reported in Section 4, along with a discussion of the analysis carried out. Finally, Section 5 concludes the paper and identifies areas of future work.
2. Background
2.1 The CONDUITS traffic safety KPIs
Performance measures have the ability to effectively evaluate the outputs of specific solutions. However, when attempting to conduct a higher-level evaluation through a multi-dimensional benchmarking scheme comparing different cities with each other, performance measures are generally not suitable. The reason is that such a task necessitates the systematic and synthetic description of the cities’ transport policies and infrastructures and the analysis of their impacts, which can only be expressed by a set of measures reflecting each individual scheme evaluated [8]. This issue creates difficulties in the communication of the results to non-technical audiences, such as politicians and the general public, and a common way to deal with it is to combine individual performance measures into composite performance indices (KPIs) [9-10].
The main advantage of KPIs is simplicity, as it is much easier to understand and grasp a single number rather than a large collection of individual measures, whose meaning often requires trained insight and careful analysis. The disadvantage, nevertheless, is that an aggregate number does not provide immediate insight into which aspects of the performance are changing or why, making it difficult to distinguish the sensitivity of an index to changes in its component measures. However, this ambiguity may lead to some other advantages. The index increases the opportunity for all modes and markets to be included, conveys the idea that each service is important, and elevates the discussion about how to best measure and report system performance. This cooperation between modes and sectors enhances awareness, broadens perspectives and leads to more comprehensive solutions.
In line with the European Commission’s strategy on the future of transport, as presented in the 2001 and 2011 white papers [11-12], a performance evaluation framework was defined by the FP7 CONDUITS project, consisting of a set of measures and KPIs for the four strategic themes of traffic efficiency, traffic safety, pollution reduction, and social inclusion [2]. Among the KPIs of the complete framework, this study focuses on the theme of traffic safety, which is addressed through three indices, namely accidents, direct safety impacts and indirect safety impacts.
Starting from the accidents index, this relies on the quantification of the safety impact as the number of people injured or killed [13], and hence the main factors considered in the KPI are the ones influencing road injuries: exposure (the amount of travel), accident rate (the risk of accident per unit of exposure), and accident severity (the outcome of accidents concerning injuries). The accidents KPI is thus formulated as follows:
𝐼
𝐴𝐶𝐷= ∑ {𝑤
𝑙∙ ∑ [𝑤
𝑠𝑒∙ ∑ (𝑤
𝑚∙
𝐴𝐶𝐷
𝑙,𝑠𝑒,𝑚𝐷𝑇𝑉
𝑙)
𝑚
]
𝑠𝑒
}
𝑙
(1)
where IACD is the value of the accidents KPI (with lower values indicating lower accident
impacts, and hence better performance), wse denotes the weighting factor representing the
the weighting factor representing the importance of reducing the number of casualties in accidents involving a specific traffic mode m from the set of possible traffic modes (car, truck, bus, motorcycle, bicycle, pedestrian, etc.), wl is the weighting factor representing the
importance of link (or junction) l among the set of links (and junctions) of the network in terms of safety, ACDl,se,m is the number of casualties of severity se involving users of mode m on link
l on an average day, and DTVl is the daily traffic volume on link l in million vehicles.
Moving onto the direct safety impacts index, this quantifies the safety impact as the number of actions/interventions taken by systems or users, which have the objective of averting a safety-critical situation; these include, for example, vehicle braking occurrences by drivers, or collision warning events by vehicle-based systems. The direct impacts KPI is thus formulated as follows:
𝐼
𝐷𝑆= ∑ [𝑤
𝑙∙ ∑ (𝑤
𝑚∙
𝐼𝑁𝑇𝐸𝑅𝑉
𝑙,𝑚𝐷𝑇𝑉
𝑙)
𝑚
]
𝑙
(2)
where IDS is the value of the direct safety impacts KPI (with lower values indicating lower safety
impact, and hence better performance), INTERVl,m denotes the number of actions/interventions
for mode m on link (or junction) l on an average day, while wl and wm are the weighting factors
representing the importance of mode m and link l in the network, and DTVl is the daily traffic
volume on link l in million vehicles.
Finally, for the indirect safety impacts index, this considers the total duration of critical occurrences/situations, which are not necessarily a result of users avoiding a safety hazard, but which can be associated with an adverse safety impact as a side-effect. These include, for example, exceedance of the speed limit, or instances of traffic flow breakdown on motorways. The indirect safety KPI is thus formulated as follows:
𝐼
𝐼𝑆= ∑ [𝑤
𝑙∙ ∑ (𝑤
𝑚∙
𝐶𝑆
𝑙,𝑚𝑇
)
𝑚
]
𝑙
(3)
where IIS is the value of the indirect safety impacts KPI (again with lower values indicating
lower safety impact, and hence better performance), CSl denotes the total duration of critical
occurrences/situations on link l, wl and wm are the weighting factors representing the
importance of mode m and link l, and T is the total time of observation.
Depending on the type of evaluation, the data sources of the ACD, INTERV and CS input quantities to the KPIs vary. Specifically, in a before- and after- evaluation of an already realised/implemented scheme, the values can be obtained from actual data collected from the field. In the case of predictive evaluation of a proposed scheme, on the other hand, the values can be calculated from the output of microscopic traffic simulation models (such as PTV VISSIM, PARAMICS or AIMSUN). Naturally, this only relates to the INTERV and CS quantities, as ACD would not be available before implementation of the scheme. The values of the weights wl, wse and wm are the policy-aware element of the KPIs, and can be set by the decision-maker
to reflect high-level policy objectives, just like it is done in the case of the pollution KPI [7].
2.2 Brief overview of traffic safety impact assessment measures
The European Transport Safety Council defines transport safety performance measures as “any measurement that is causally related to crashes or injuries, used in addition to a count of crashes or injuries in order to indicate safety performance or understand the process that leads to accidents” [14]. However, using the counts of accidents or injuries is usually insufficient to represent transport safety as a whole, due to a number of limitations. For example, the number of crashes or injuries depends on probability fluctuations of random events, and this implies that the underlying, long-term problems cannot necessarily be revealed by short-term recordings. Also, hazardous situations that did not cause an accident are often not recorded as near-miss incidents [15]. Instead, the use of wider safety performance measures can indicate risky problems at an early stage (before accidents happen) and allows to distinguish systematic improvements form random fluctuations.
In most countries, road user behaviour and road and vehicle engineering characteristics are employed to describe road safety performance. With respect of road user behaviour, commonly used safety performance measures include [14]:
Speeding, with respect both to mean speed, variance, and speed limit violations;
Percentage use of seat belts and child restraints;
Percentage use of crash helmets;
Incidence of drinking and driving;
Failure to stop or yield at junctions or at pedestrian crossings;
Inadequate headways – close following;
Use of daytime running lights;
Use of reflective devices, especially for cyclists and pedestrians; and
Use of pedestrian crossing facilities (by pedestrians).
Many of these safety performance measures have formed the basis of various predictive safety models, which have been developed and tested both in simulation and real-world environments. For example, speed is one of the key parameters necessary to calculate time-to-collision, a fundamental variable in traffic conflicts models (e.g. the Swedish Traffic Conflicts Technique [16]). Speed is also the basis of Nilsson’s power model [17], which predicts changes in accident rates as a function of average speed changes. Alternatively, car-following behaviour with shorter headways than what is considered safe is commonly viewed as a near-accident situation and hence a safety risk, and forms the basis of various models.
Most existing applications of such models focus predominantly on a particular phenomenon or localised case study rather than on a comprehensive assessment of performance of the network or parts thereof in terms of safety. Still, many such measures can be used in conjunction with the CONUITS safety KPIs, as they can provide the input necessary for their computation. This is tackled in the next section.
3. Predictive traffic safety evaluation methodology
3.1 Methodology requirements and overview
(nodes/links/routes) and different transport modes. A list of variables included in vehicle record file produced by the PTV VISSIM microscopic traffic simulation package is given in Table 1.
Variable Description [t] [Link] [VehNr] [Type] [VehTypeName] [WorldX] [WorldY] [WorldZ] [Grad] [a] [vMS] [DistX] [IntacP] Simulation second Link number Vehicle ID Vehicle type ID Vehicle type name
Simulation network X coordinate Simulation network Y coordinate Simulation network Z coordinate Road gradient
Acceleration [m/sec2]
Velocity [m/sec]
Distance travelled by car [m]
The travel status of vehicle (free, following, stop)
Table 1: Variables included in vehicle record files of PTV VISSIM
The data contained in vehicle record files can be readily input in the CONDUITS KPIs for traffic efficiency. Coupled with an appropriate emissions modelling tool (such as COPERT or AIRE II), appropriate input data for the KPIs for pollution can also be derived. In the case of safety, though, the required input data are not readily available, and need to be either processed, or coupled with another existing predictive safety model. The next sub-sections describe how this is done for the three KPIs introduced in Section 2.1.
3.2 Evaluation of accident numbers
As accident numbers are not output from microscopic traffic simulation models, it is necessary to identify a proxy, which can be used as input to the relevant KPI in equation (1). The selected measure here is the average speed. In fact, it is recognised that driving speed plays an important role in road traffic safety measurement, as higher driving speed provides less time to respond to emergencies for both drivers and pedestrians, and as high speed injects additional momentum, increasing the severity of accidents [18]. It has been reported that excess and unsuitable speeds are responsible for a high proportion of road accidents and contribute to about one third of fatal crashes and 12% of all road crashes as main crash causal factors [19].
Looking in more detail at the relationship between speed and accidents, various empirical studies have suggested that that for every increase of average speed by 1 km/h, the number of accidents is likely to increase 3-4%, with more significant impacts found for serious accidents. Conversely, every 1 km/h of reduction in the average driving speed leads to a 5% decrease of the number of fatal accidents [14, 19]. A more formal expression of these findings is proposed by Nilsson’s power model [17], which relates average speed changes with the number of crashes by severity (Table 2).
Speed measure for accidents and injuries prediction
Accidents (y) Injured (z) Fatal accidents Fatalities
y1=(vv1 0)
4
y0 z1=(vv1
0) 4
y0 + (vv1 0)
8
(z0− y0)
Fatal and serious injury accidents Fatalities and severe injuries
y1=(vv1 0)
3
y0 z1=(vv1
0) 3
y0 + (vv1 0)
6
(z0− y0)
All injury accidents All injuries (including fatalities)
y1=(vv1 0)
2
y0 z1=(vv1
0) 2
y0 + (vv1 0)
4
(z0− y0)
where y0 (z0) is the initial number of accidents (injuries) before the speed change , y1(z1) is the number
of accidents (injuries) after the speed change, and v0 and v1 are the before and after average speed.
Nilsson’s power model is a suitable method for generating input for the CONDUITS accidents KPI on the basis of microscopic traffic simulation, as it relates accident numbers with traffic characteristics (left column of Table 2). However, it relies on the fundamental assumption that reliable initial accident numbers, differentiated by type, are known, which is, however, rarely the case, as such data are often either not available at all, or statistically insignificant. As such, it is very likely that the KPI of equation (1) cannot be computed as an absolute value. Instead, the present study proposes calculating the CONDUITS KPI for accidents in relative terms, i.e. as
Δ𝐼
𝐴𝐶𝐷=
𝐼
𝐴𝐶𝐷,0− 𝐼
𝐴𝐶𝐷,1𝐼
𝐴𝐶𝐷,0 (4)where IACD is the improvement (positive) or deterioration (negative) in terms of accidents, and
IACD,0 and IACD,1 are the values of the accidents KPI before and after the change in average
speed respectively. It should be noted that although the y0 term is not known, it cancels out in
equation (4), and therefore the calculation of IACD is possible.
3.3 Evaluation of direct safety impacts
Direct safety impacts include actions/interventions taken by systems or users, which have the objective of averting a safety-critical situation, and the selected measure in this category is vehicle deceleration, which corresponds to vehicle braking occurrences. In fact, acceleration and deceleration are important properties of vehicle performance and usually lead to accidents when vehicles start and brake suddenly without sufficient safety distance [20], and hence significant changes in acceleration and deceleration are empirically considered as responses to emergency situations and indicators for rear-end collisions. For instance, studies have suggested that deceleration, which usually refers to the braking rate, is closely related to the severity of accidents [21].
Figure 1: Severity of accident risk based on braking rate (deceleration) [21]
3.4 Evaluation of indirect safety impacts
Indirect safety impacts consider the total duration of critical occurrences/situations over the total duration of the period of observation. The situations considered are the ones which are not necessarily a result of users avoiding a safety hazard, but which can be associated with an adverse safety impact as a side-effect. The selected measure in this category is the speeding rate, i.e. the frequency of exceedance of the speed limit. Speeding behaviour is, in fact, one of the most commonly used indicators illustrating the relationship between driving behaviour and road safety, but it does not involve an action aimed at averting a safety hazard, so it is an appropriate measure for this category of safety impact.
The speeding rate can be extracted directly from the vehicle record files of microscopic traffic simulation packages, as the total time of exceedance of the speed limit (usually 50 km/h in urban areas) in vehicle-hours over the total time of observation, also in vehicle hours. This provides the values of the necessary CS and T input variables of the indirect safety impacts KPI of equation (3). The calculation can also be performed in a stratified manner disaggregated by mode, and the result can then be aggregated using appropriate weights in the KPI.
4. Application and results
4.1 Application case study
The research described has been carried out in close cooperation with city authorities, with the predictive evaluation framework being validated through an existing case study in the city of Brussels. Following the EU directive and the high interest of the Brussels-Capital Region to provide a better quality of life to its citizens, the city authority has been constantly seeking for ways to deliver a more efficient transport system on one hand, but a safer and less polluting one on the other. One of the measures pursued involves increasing the share of public transport in the modal split, which requires making it more competitive compared to motorised private transport. With an already dense public transport network (70 public transport lines with a total length of more than 700 km), though, any improvements must be based on the existing system.
One of the means to introduce a more competitive public transport system is by reducing travel times. To achieve this, the Brussels-Capital Region has introduced a program aiming at increasing the operational speed of most of its public transport lines. The programme focuses on reducing delays around signalised intersections by giving priority to public transport vehicles over other traffic. This strategy promotes the attractiveness of public transport, both in the short- and the long-term, by offering lower travel times; however, it is also likely to have an undesired side-effect of increased pollution levels from traffic, especially in the short-term, due to increased waiting (idle) times and more stops and accelerations by private transport vehicles. There is also the possibility of a safety impact side-effect, positive or negative, which needs to be investigated.
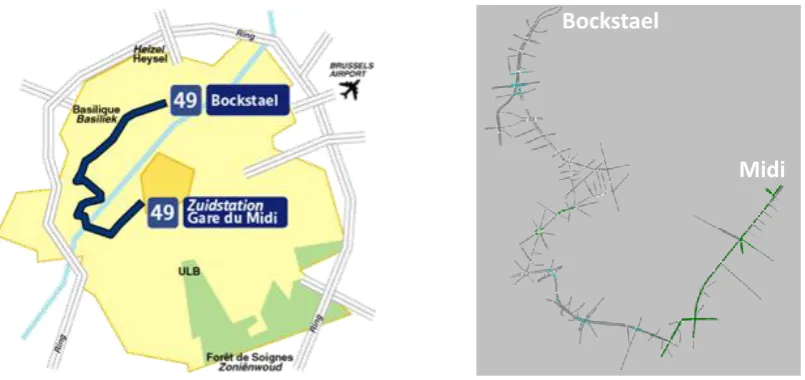
The pollution impact has been previously calculated [5-7], so it is the safety side-effect that is evaluated in the present study. More specifically, the prospective performance change in terms of accidents, direct safety impacts and indirect safety impacts of the introduction of priority signals along bus line no. 49 is analysed. The study consists of four cases, representing the states before and after the implementation of the system in the morning and evening peak periods, respectively. From the planning phase of the signal control a calibrated PTV VISSIM simulation network has been developed for all four cases (Figure 2). Several simulation runs are carried out over an evaluation period spanning three hours in the respective peak, producing corresponding vehicle record files.
network level using each of the three KPIs, and then the same procedure is followed for four individual selected network links, so as to demonstrate applicability of the approach in both conditions.
Figure 2: Location of bus line no. 49 in Brussels (left), and simulation network (right)
4.2 Network-level results
Using equation (4) the value of IACD is calculated as the improvement (positive) or
deterioration (negative) of safety performance in terms of accidents. The calculation is carried out separately for the three different accident severity categories (fatality, serious injury, minor injury), which are then aggregated using the weights employed in [4], i.e. wfat = 0.85, wsinj =
0.10 and wminj = 0.05 for fatalities, serious and minor injuries, respectively. The calculation is
also carried out separately for the different traffic modes (car, HGV, bus, other public transport), so as to get a better mode-specific insight into the impacts. The results are shown in Table 3, where it can be seen that on average accident reductions of the order of 15% are foreseen for car and HGV traffic, arising mostly from the morning peak for cars and from the evening peak for HGVs. On the other hand, average increases of the order of 14% and 23% are foreseen for the accidents involving buses and other public transport. This is an expected result, as the average speed for car and HGV traffic has decreased after the implementation of the priority scheme, while that of public transport has increased. It should be noted, though, that this result is in relation to existing accident numbers, and hence the projected increases or decreases can be deemed significant or not depending on the accident data available. It should be also further stated that the result can be largely attributed to the trends in terms of fatalities, which are most heavily weighted in the KPI calculation, thus reflecting high-level policy objectives (and the near-zero tolerance to fatalities).
IACD Fatality Serious injury Minor injury TOTAL
Car Morning Evening 0.245 0.067 0.190 0.051 0.131 0.034 0.234 0.064
TOTAL 0.157
HGV Morning Evening 0.055 0.253 0.042 0.197 0.028 0.136 0.052 0.242
TOTAL 0.151
Bus Morning Evening -0.041 -0.165 -0.028 -0.122 -0.061 -0.080 -0.119 -0.157
TOTAL -0.137
Other public transport
Morning -0.165 -0.121 -0.079 -0.156 Evening -0.320 -0.231 -0.149 -0.302
TOTAL -0.226
Table 3: Accidents KPI change between before- and after-evaluation
Bockstael
[image:10.595.87.508.584.738.2]Considering direct safety impacts, as illustrated by the braking behaviour of drivers around the network, the relevant KPI is calculated using equation (2), and the results, differentiated by braking severity type and traffic mode before and after the implementation of the scheme, are shown in Table 4. As can be seen, the public transport priority system appears to slightly reduce the number of extreme braking events per vehicle (with deceleration of more than 7 m/s2), while slightly increasing the number of hard/medium braking occurrences (between 2m/s2 and 7m/s2), especially for buses. This suggests a marginal overall improvement in terms of direct safety impacts.
IDS
(actions/vehicle)
Uncontrolled Hard/Medium Normal
Before After Before After Before After
Car
Morning 0.020 0.023 4.77 4.89 6.75 6.62 Evening 0.041 0.036 4.97 4.96 8.01 8.07
Total 0.030 0.029 4.87 4.93 7.38 7.35
HGV
Morning 0 0 0.98 1.07 19.09 18.78 Evening 0 0 1.40 1.41 21.15 21.25
Total 0 0 1.19 1.24 20.12 20.02
Bus
Morning 0.071 0.075 1.34 1.57 11.14 12.33 Evening 0.136 0.111 1.74 1.80 13.54 13.7
Total 0.103 0.093 1.54 1.68 12.34 13.01
Other public transport
Morning 0.004 0.005 1.97 0.889 9.84 6.89 Evening 0 0 1.09 1.48 6.46 4.69
[image:11.595.85.509.185.347.2]Total 0.002 0.002 1.23 0.95 6.57 4.67 Table 4: Index for direct safety impacts calculated by braking severity and traffic mode
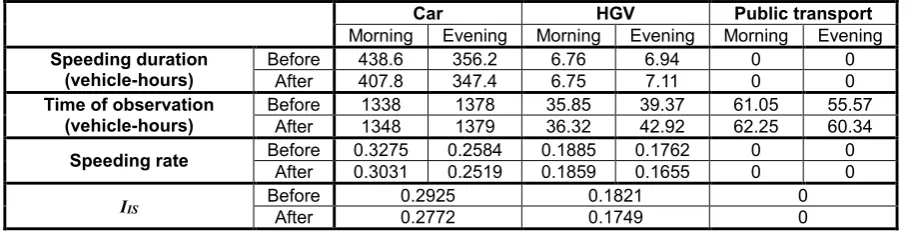
As concerns the indirect safety impacts as portrayed by the speeding behaviour of drivers in the network, the relevant KPI is calculated using equation (3), and the results, differentiated by traffic mode, are shown in Table 5. Marginal speeding rate (total time of exceedance of 50 km/h over total time of observation in vehicle-hours) reductions can be observed across the board, which can be reflected in the reduced KPI value. Considering the reduction in the total speeding duration over the entire period of observation as a pure number, however, this accounts to almost 40 hours, which is still a significant reduction, even though it may be slightly “downplayed” by the smaller KPI value reduction, which takes into account the traffic volume. As such, it can be concluded that the priority system appears to deliver better safety in terms of indirect impacts. It should be further noted that no speeding occurrences are recorded for public transport, either before or after the implementation of the system.
Car HGV Public transport
Morning Evening Morning Evening Morning Evening
Speeding duration (vehicle-hours)
Before 438.6 356.2 6.76 6.94 0 0 After 407.8 347.4 6.75 7.11 0 0
Time of observation (vehicle-hours)
Before 1338 1378 35.85 39.37 61.05 55.57 After 1348 1379 36.32 42.92 62.25 60.34
Speeding rate Before 0.3275 0.2584 0.1885 0.1762 0 0
After 0.3031 0.2519 0.1859 0.1655 0 0
IIS Before After 0.2925 0.2772 0.1821 0.1749 0 0
Table 5: Index for indirect safety impacts calculated by traffic mode
4.3 Link-level results
[image:11.595.72.527.523.639.2]found that the average speed has slightly increased on all four of them, and this has often been accompanied with reduced speed variance (and hence more stable traffic flow). The links, therefore, appear to benefit from better mobility following implementation of the priority system, which may, however, be associated with worse safety. In particular in the case of Link 130, the 85th percentile speed exceeds the speed limit, which implies a high speeding rate.
Applying the relative accidents KPI of equation (4) to each of the four links with the same weights as in the network-level evaluation, the results of Table 6 are obtained. As expected given the speed increase, an improvement in terms of accidents is only reported on Link 50 in the morning peak, with decreased index values of different magnitudes found in all other links and times. The highest drop can be identified on Link 130, which can be attributed to the sharp increase in the expected fatality rate, which dominates the calculation due to the higher weight assigned; the severe average speed increase on this link explains this result.
IACD Fatality Serious injury Minor injury TOTAL
Link 50
Morning 0.105 0.100 0.054 0.100 Evening -0.223 -0.211 -0.106 -0.211
TOTAL -0.035
Link 93 Morning Evening -0.207 -0.255 -0.151 -0.186 -0.098 -0.120 0.052 0.242
TOTAL -0.218
Link 130 Morning Evening -0.304 -0.548 -0.220 -0.388 -0.142 -0.244 -0.119 -0.157
TOTAL -0.391
Link 177
Morning -0.158 -0.116 -0.076 -0.156 Evening -0.106 -0.078 -0.051 -0.302
[image:12.595.84.514.249.398.2]TOTAL -0.125
Table 6: Accidents KPI change between before- and after-evaluation for the four links
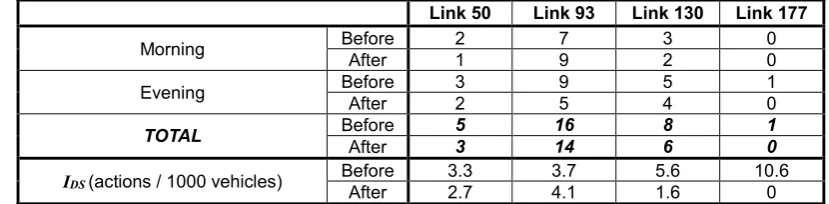
Considering direct safety impacts as described by the braking behaviour of drivers, the critical (more than 7 m/s2) occurrences and the corresponding KPI values calculated through equation (2) for each of the four links are given in Table 7. The results suggest that the implemented priority system generates positive direct safety impacts on the links with lower average traffic volume (50 and 130). However, a negative direct safety impact appears to arise on the more heavily trafficked Link 93, attributed mostly to the morning peak. As concerns the very lightly trafficked Link 177, this cannot be considered as statistically significant, as only a single occurrence of critical braking is identified.
Link 50 Link 93 Link 130 Link 177
Morning Before After 2 1 7 9 3 2 0 0 Evening Before After 3 2 9 5 5 4 1 0
TOTAL Before After 5 3 16 14 8 6 1 0 IDS (actions / 1000 vehicles) Before After 3.3 2.7 3.7 4.1 5.6 1.6 10.6 0
Table 7: Critical braking occurrences and direct safety impacts KPI values for the four links
[image:12.595.87.502.535.637.2]Speeding rate Link 50 Link 93 Link 130 Link 177
Morning Evening Morning Evening Morning Evening Morning Evening
IIS
Before 0.0131 0.0168 0.0546 0.0511 0.2513 0.1868 0 0
After 0.0147 0.0151 0.0560 0.0547 0.1312 0.2327 0 0
Before 0.0145 0.0529 0.2212 0
After 0.0149 0.0552 0.1837 0
Table 8: Indirect safety impacts KPI values for the four links
5. Conclusions
A predictive evaluation framework for the theme of traffic safety of road traffic management has been introduced in this paper, with the objective of being used in conjunction with the CONDUITS KPIs and being implemented as a dedicated module to the CONDUITS_DST software. A number of models and metrics linking traffic characteristics with road safety impacts have been identified and proposed, which enable the extraction of the necessary input data for each of the three CONDUITS KPIs for traffic safety (accidents, direct impacts, and indirect impacts) directly from microscopic traffic simulation models. The proposed models and metrics have then been tested in conjunction with the KPIs using data from simulation models before and after the implementation of a bus priority signalling system in the city of Brussels. Testing has been carried out both at the network- and at the individual-link-level, and the results appear to capture the expected safety impacts adequately well.
While the present study has shed some light on the topic of predictive evaluation of traffic safety impacts, work in this direction continues. It is an essential next step for the proposed models and metrics to be incorporated into the CONDUITS_DST software, complementing the already integrated and validated pollution and traffic efficiency modules. Apart from the user-friendliness of the evaluation process, the integration will additionally enable the consideration of traffic safety as part of a broader multi-objective problem alongside the other themes, rather than individually. This means that solutions will be able to be compared by decision-makers directly on the basis of their KPI values in the different themes, thus providing a more informed and comprehensive evaluation process. As it is likely that trade-offs will have to be made between meeting objectives in different themes to varying extents, the decision-making process can become a highly complex problem, opening great prospects of further research in the development of multi-objective optimisation algorithms using the different KPIs as decision variables to facilitate this.
Acknowledgements
The authors would like to thank Kapsch TrafficCom for sponsoring the work reported here as part of the CONDUITS-DST project, and the Brussels-Capital Region for providing the data and microscopic traffic simulation models used.
References
[1] Zavitsas, K., Kaparias, I., Bell, M.G.H., “Transport problems in cities”, CONDUITS Deliverable 1.1, (2011).
[2] Kaparias, I., Bell, M.G.H., Eden, N., Gal-Tzur, A., Komar, O., Prato, C.G., Tartakovsky, L., Aronov, B., Zvirin, Y., Gerstenberger, M., Tsakarestos, A., Nocera, S., Busch, F, “Key Performance Indicators for traffic management and Intelligent Transport Systems”,
CONDUITS Deliverable 3.5, (2011).
[4] Kaparias, I., Eden, N., Tsakarestos, A., Gal-Tzur, A., Gerstenberger, M., Hoadley, S., Lefebvre, P., Ledoux, J., Bell, M.G.H., “Development and application of an evaluation framework for urban traffic management and Intelligent Transport Systems”, Transport Research Arena Europe 2012, Athens, Greece, (2012).
[5] Eden, N., Tsakarestos, A., Kaparias, I., Gal-Tzur, A., Schmitz, P., Hauptmann, S., Hoadley, S., “Using Key Performance Indicators for traffic management and Intelligent Transport Systems as a prediction tool”, 19th World Congress on Intelligent Transport Systems, Vienna, Austria, (2012).
[6] Eden, N., Kaparias, I., Tsakarestos, A., Gal-Tzur, A., Schmitz, P., Hoadley, S., Harrich, M., “Using Key Performance Indicators for multi-criteria traffic management strategic decisions”, 9th European Intelligent Transport Systems Congress, Dublin, Ireland (2013).
[7] Kaparias, I., Manassa, E., Eden, N., Tsakarestos, A., Schmitz, P, Hoadley, S., Hauptmann, S., “Policy-aware environmental impact assessment for urban mobility and Intelligent Transport Systems”, 18th IEEE International Conference on Intelligent Transportation Systems, Las Palmas, Spain, (2015).
[8] Cianfano, M., Gentile, G., Nussio, F., Tuffanelli, G., Rossi, P, Vergini, R., Terenzi, G., “Transport and mobility indicators based on traffic measures – Good practices guidebook”, CITEAIR II Deliverable, (2011).
[9] Cambridge Systematics Inc., PB Consult Inc., System Metrics Group, “Analytical tools for asset management”, NCHRP report 545, Transportation Research Board, (2005). [10] Zhou, P. Ang, B.W., Poh, K.L., “Comparing aggregating methods for constructing the
composite environmental index: An objective measure”, Ecological Economics, 59, pp. 305-311, (2006).
[11] European Commission, “European transport policy for 2010: time to decide”, White Paper, (2001).
[12] European Commission, “Roadmap to a single European Transport Area - Towards a competitive and resource efficient transport system”, White Paper, (2011).
[13] Elvik, R., Høye, A., Vaa, T., Sørensen, M., The handbook of road safety measures, Bingley: Emerald Group Publishing Ltd., (2009).
[14] European Transport Safety Council, Transport Safety Performance Indicators, (2001). [15] Sigfridsson, S.E., Heijster, C., Lang, J., Plaza Rubio, J.A., Stoop, J., Taylor, F.,
Valkama-Joutsen, P., Walta, W., “Transport accident and incident investigation in the European Union”, European Transport Safety Council report, (2001).
[16] Hydén, C., “The development of a method for traffic safety evaluation: The Swedish traffic conflicts technique”, Department of Technology and Society, Lund University, (1987).
[17] Nilsson,G., “Traffic safety dimensions and the power model to describe the effect of speed on safety”, Lund Institute of Technology and Society, Traffic Engineering, Bulletin 221, (2004)
[18] Organisation for Economic Cooperation and Development (OECD), “Speed management”, European Conference of Ministers of Transport, Paris, France, (2006). [19] Bowie, N.N., Waltz, M., “Data-analysis of the speed related crash issue”, Auto and Traffic
Safety, 2, pp. 31-38, (1994).
[20] Bared, J., Giering, G.L., Warren, D.L., “Safety evaluation of acceleration and deceleration lane lengths”, ITE Journal, 69, pp. 50-54, (1999).