Capturing uncertainty in operation, behavior and weather in building performance assessment : an Egyptian case study.
14
0
0
Full text
(2) (Tuohy 2007), lighting use and occupancy (Reinhart 2004), (Mahdavi et al. 2009). There are problems with this approach with both a lack of a comprehensive set of algorithms with sufficiently detailed and validated parameters appropriate to specific contexts and the computational power that would be required to incorporate these within the required multi-domain building performance assessment modeling tools. While this bottom up approach has the potential to provide a virtual reality to designers in future there are significant challenges to be overcome before this is available for building practitioners. An alternate approach proposed and explored in this paper is to capture variations and uncertainties in building operations, user behaviors and weather within higher level parameter sets representing realistic distributions, and then to evaluate the energy and comfort performance of buildings across these ranges. This approach is developed and illustrated here using Egyptian office buildings as an example. First, the baseline energy and comfort performance is explored for existing offices and a typical model created. Next, parameter sets are developed representing variations in operation, behavior and weather. Finally, the energy and comfort performance of the typical office and the impact of possible upgrades are evaluated across these ranges. The general applicability of the approach in building design is then discussed. Insights into the energy and comfort performance of Egyptian office buildings are also generated by this work which may be useful in characterizing the Egyptian building stock. 2 Energy and Comfort Performance of Existing Egyptian Office Buildings The current energy and comfort performance of offices in Egypt is explored through a simple energy survey of multiple offices and a more detailed investigation of an individual office building. The observed indoor environment is compared against adaptive and nonadaptive thermal comfort standards. 2.1 Energy Survey of Multiple Offices Historical surveys such as ECON19 0in the UK have underpinned energy performance calculation methods however no historical survey data is available for Egyptian offices. ECON19 categorizes buildings by their HVAC strategy and type. As a first step in the exploration of the energy performance of Egyptian offices, electricity bill data was gathered for 59 offices in Alexandria. The energy performance was then analyzed for 3 HVAC types: 1. Natural Ventilation and no cooling (11 offices); 2. Natural Ventilation and local unitary AC systems (41 offices); 3. Central HVAC with mechanical ventilation.. Statistical Analysis for the Egyptian Offices Power Consumption With Central A/C and Mechanical Ventilation (Type 3). 10.00. 10.00. 10.00. 8.00. 8.00. 8.00. Oct. Dec. Sep. Figure 1 Monthly power consumption for Egyptian office Buildings According to HVAC system. Nov. Jul. Aug. Jun. Apr. Dec. Oct. Nov. Jul. Sep. Jun. Aug. Apr. May. Mar. Jan. Feb. Dec. Oct. Nov. Sep. Jul. Aug. 0.00. Jun. 2.00. 0.00 Apr. 2.00. 0.00 Mar. 2.00. May. 4.00. Jan. 4.00. May. 6.00. 4.00. Jan. 6.00. Feb. 6.00. kWh/m2. 12.00. kWh/m2. 12.00. Mar. Statistical Analysis for the Egyptian Offices Power Consumption With Split A/C and no Mechanial Ventilation (Type 2). 12.00. Feb. kWh/m2. Statistical Analysis for the Egyptian Offices Power Consumption with No HVAC System (Type 1).
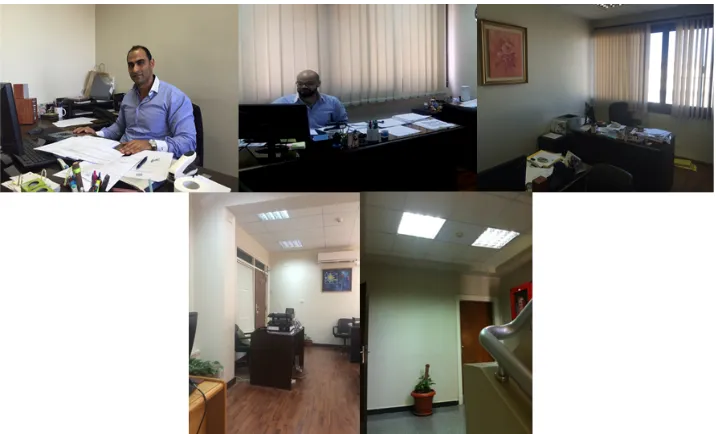
(3) Figure 1 shows the summary results, the central grey/black box shows the 25th, 50th, and 75th percentiles and the whiskers show the max and min for each month. This high level data provides only some high level insight, more detailed information is required to better understand Egyptian building performance. The same trend is seen as for the ECON19 study such that more highly serviced buildings consume more energy. 2.2 Energy and Indoor Environment for an Office, comparison to Comfort Standards. Type 2 (Natural ventilation and local cooling) was found to be the most prevalent category. A more detailed investigation of an individual Type 2 office building was then carried out. The office was chosen as it is a common building type found in Egypt. In addition to the measurements the occupancy and patterns of use were recorded including window and blind use, local cooling system setpoints, and the clothing being worn by the occupants. Local weather station data was also available. The investigation involved energy and environmental monitoring during 2014. Measurements were made of space resultant temperature, humidity, carbon dioxide and electrical power. The monitoring instruments were moved around to various locations to facilitate gathering of useful data and also to capture variations. The survey was designed to allow a calibration of a dynamic simulation model as well as provide further data on current building performance. The building configuration and external views are shown in figure 2, internal views in figure 3. The external and internal views highlight the variation in use of windows and blinds.. Figure 2. The type 2 case study building - example floor plan and external views.. Figure 3. The case study building – example internal views..
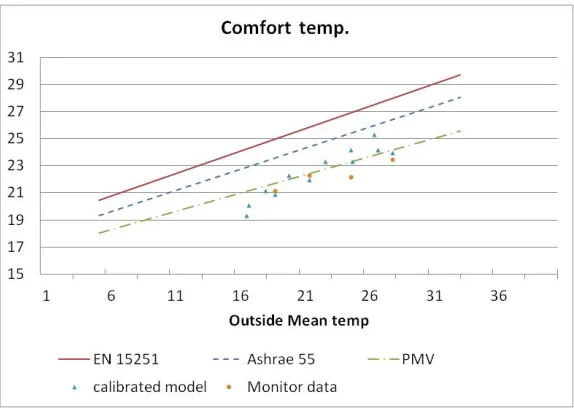
(4) The monitoring data highlighted high variability in internal conditions during working hours. Some spaces were observed to have the local cooling setpoint set to 16C and the system running throughout the working day, others had setpoints of 22 or 24C, while others ran the local cooling set at 22C for an initial period and then switched it off. Behaviours in offices varied based on time of year and also day to day. The behaviour shown in figure 5 for office S08 where the cooling setpoint is set at 22C and the room operative temp achieved was around 23.5C was the most typical and representative of the summer conditions across the majority of the space.. Time. Figure 4. Actual inside room temperature during the day for one of the colder offices. Inside Room Temprature F10 (12/11/2014) 26.0 °C 25.0 °C 24.0 °C 23.0 °C 22.0 °C 21.0 °C. Time. Figure 5. Actual inside room temperature during the day for one of the typical offices. 20.0 °C. 0:06 1:36 3:06 4:36 6:06 7:36 9:06 10:36 12:06 13:36 15:06 16:36 18:06 19:36 21:06 22:36. 29.00 28.00 27.00 26.00 25.00 24.00 23.00 22.00 21.00 20.00 0:00 1:30 3:00 4:30 6:00 7:30 9:00 10:30 12:00 13:30 15:00 16:30 18:00 19:30 21:00 22:30. 30.0 °C 28.0 °C 26.0 °C 24.0 °C 22.0 °C 20.0 °C 18.0 °C 16.0 °C 14.0 °C 12.0 °C 10.0 °C. Inside Room Temperature S08 (19/8/2014). 00:05:00 01:35:00 03:05:00 04:35:00 06:05:00 07:35:00 09:05:00 10:35:00 12:05:00 13:35:00 15:05:00 16:35:00 18:05:00 19:35:00 21:05:00 22:35:00. Inside Room Temperature S02 (21/8/2014). Time. Figure 6. Actual inside room temperature during the day for one of the hotter offices. The internal conditions for the typical office S08 are shown plotted against the various comfort criteria from international standards in figure 7 (ASHRAE Standard 55-2004), (Cen, E. N. "15251" 2007). The measured internal temperatures for this type 2 office with available cooling appear to most closely follow the comfort temperature predicted by the PMV method.. Figure 7. Internal conditions and predicted comfort temperature v. outdoor mean temperature..
(5) 3 Energy and Comfort Assessment Methodology for Upgrades A methodology is proposed for assessing energy and comfort impacts of retrofit or new build measures. The methodology involves creation of: a typical model; input parameter sets representing variation and uncertainties in operating conditions and behaviors; and, inputs representing variation in weather. The typical model is then used as the base and changes evaluated against this base performance across the range in operations, behaviors and weather. The output is then a performance map allowing energy and thermal comfort performance to be assessed. 3.1 Creation of the typical model A double calibration process is used to create the typical model: first a calibrated model is created for the case study building for which detailed information is available, and then the calibrated model is adjusted to be more representative of typical performance determined from the multi-building survey. The case study building used to create the calibrated model is situated in Alexandria on the Mediterranean coast.. Figure 8. Location of the detailed monitoring building.. 3.1.1 Calibrated model from detailed monitoring study Standard methods (Raftery et al. 2009), (Tahmasebi et al. 2013), (Royapoor et al. 2015), (Westphal et al. 2005) were used to create a calibrated model of the case study building. The creation of the calibrated model has been reported in detail elsewhere (Elharidi et al. 2013) and is only briefly summarized here. First a best guess model was created from construction and monitored data; next a parametric study was carried out to identify the uncertain parameters with the greatest influence on building performance; then a sequential calibration process in order of decreasing influence was carried out to set parameters for minimum root square mean variance (RSMV). The base building is typical Egyptian un-insulated solid wall and single glazed construction. The calibration process was partitioned to allow parameters to be independently calibrated i.e. calibration of electric power use was first done in the winter period to establish lighting and equipment performance, then summer calibration carried out to establish cooling performance, air infiltration rate was calibrated using occupancy and carbon dioxide measurements etc. The results of the model calibration process are illustrated in figure 9..
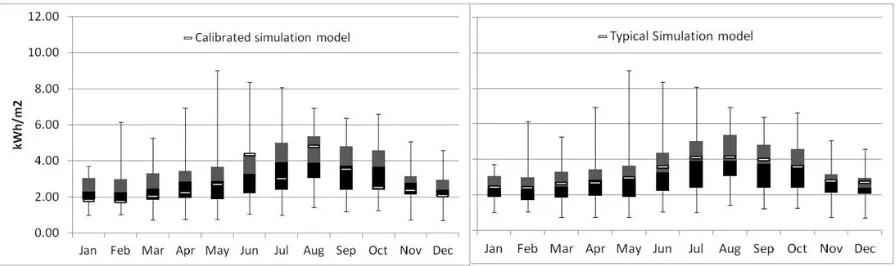
(6) Figure 9. Calibrated model energy and carbon dioxide performance.. Figure 10. Internal temperature (real and model), predicted comfort v. outdoor mean temperature.. 3.1.2 Adjusted Calibrated Model to Represent Typical Performance The calibrated model while giving good agreement with the measured data has a different monthly energy use profile from that seen in the multi-building survey as shown in figure 11. The case study building is the administration building for the University and had very high occupancy and energy use in June and August associated with the University calendar, either side of Ramadan which was in July and had low occupancy and activity levels, to create a more typical profile these months were adjusted in the model to have a more consistent occupancy pattern similar to non-academic buildings. The winter occupancy and associated equipment and lighting use was adjusted up to represent a more typical occupancy pattern, with these adjustments the model gave results close to the 50th percentile of the survey data. The model then is tuned to represent performance of a typical type 2 office, figure 11 however highlights the variability in performance seen in the energy survey, and it would appear to be important to also represent this variability in assessing energy performance..
(7) Figure 11. Monthly power consumption for type 2 offices from the survey and simulation results from the calibrated model of the single office and the 'typical' model.. 3.2 Realistic worst case parameter sets for operations and behavior. From the parametric screening study and literature (Lam et al. 1996), (Tian 2013) the primary input parameters which affect energy use and their likely ranges were determined. The ranges are tabulated in table 1, the max and min extremes have been labeled as + and 3 standard deviations, this superimposes a notional normal distribution on each parameter for which the standard deviations have been determined. Table 1: Primary input parameters and ranges (D.F. = Diversity Factor) Parameter Equipment load Equipment D.F Lighting Load Lighting D.F Occupancy Load Occupancy D.F A/C Set point Infiltration Rate. W/m2 W/m2 m2 / person °C l/s.m2. Max (+3 σ) 30 1 18.8 1 16 1 26 1.3. Min (-3 σ) 10 0.2 7.8 0.2 4 0.2 18 0.3. σ 3.33 0.13 1.83 0.13 2.00 0.13 1.33 0.17. Mean 20 0.6 13.3 0.6 10 0.6 22 0.8. The impact of these parameters on the energy performance of the building are either positive or negative e.g. increasing equipment loads will positively increase power consumption (equipment plus cooling), while increasing the cooling setpoint will reduce power consumption (less cooling). The infiltration rate as described in table 1 is the daytime sum of infiltration due to window and door openings, extract fans, and unintended fabric air leakage. In the model the daytime and nighttime infiltration due to the use of openings and fans are separately specified from the unintended fabric leakage so that each can be separately specified, for simplicity this was not shown here. Variations in these parameters will depend on how the building is operated and equipped, over the life of a building it is reasonable to expect that these parameters will be varied over time. In order to capture this likely variation it would seem reasonable to combine these uncertain parameters into best case and worst case parameter sets to represent likely variations and uncertainties. The offices were assumed to have occupancy based around an 8 hour work day as this was found to be the case in the survey. Combining the extremes (max, min) of each parameter would give a possible but very unlikely worst case range, rather by applying adjustment of 1 standard deviation to each parameter and combining settings based on positive or negative effect a more realistic set of worst case parameters.
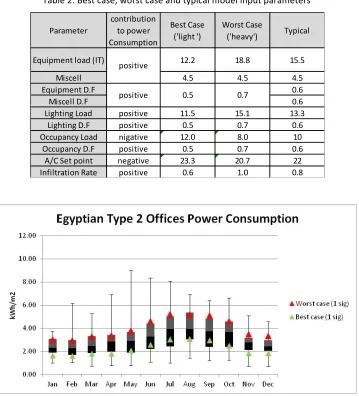
(8) was established (table 2 and figure 12). It was then proposed that this best case, worst case and typical parameter sets be considered in assessment of likely building performance. Table 2: Best case, worst case and typical model input parameters Parameter Equipment load (IT) Miscell Equipment D.F Miscell D.F Lighting Load Lighting D.F Occupancy Load Occupancy D.F A/C Set point Infiltration Rate. contribution to power Consumption. Best Case ('light '). Worst Case ('heavy'). Typical. 12.2. 18.8. 15.5. 4.5. 4.5. positive. 0.5. 0.7. positive positive nigative positive negative positive. 11.5 0.5 12.0 0.5 23.3 0.6. 15.1 0.7 8.0 0.7 20.7 1.0. 4.5 0.6 0.6 13.3 0.6 10 0.6 22 0.8. positive. Figure 12. Realistic worst case parameter sets superimposed on monthly power consumption.. 3.3 Realistic worst case weather datasets. The weather was measured during the monitoring period and used in the modeling described above however the variation in weather also should be considered in assessing likely building performance. To address this point the statistical analysis as proposed by Crawley (Crawley 2007, 2015) was used to create weather files representing realistic spreads in weather. First cooling degree days were analyzed for recent years and the highest and lowest degree day’s climate files identified for use as extremes, 2006 as a 'cool' year, and 2010 as a 'warm' year. These years are shown in figure 13, it can be seen that the difference is largely due to extension of the warmer summer period into the autumn. The difference in degree days and peak temperatures between the cool and warm years for Alexandria is relatively small (20%) compared to other regions, possibly due to its coastal location..
(9) Figure 13. Weather files for Alexandria: cooling degree days and dry bulb temperatures.. 3.4 Application of the Methodology Now with a typical model and parameter sets representing uncertainties in operations and behavior and weather it is possible to include these likely variations and uncertainties in evaluating typical building performance and the impact of potential upgrades. The modeling results (Total Annual Energy Use and Summer PPD) for the typical office are illustrated in figure 14 for each combination of weather and occupancy behavior pattern. The occupancy and behavior related variation in energy consumption is very large while the impact of weather is relatively small. Similarly the impact of the cooling setpoint is apparent with the light and typical with higher cooling setpoints having accordingly higher calculated PPDs.. Occupancy + Behavior. Total Energy (MWh/year). Summer PPD. heavy. 50.5. 51.8. 52.9. heavy. 20.1. 20.3. 20.9. typical. 38.5. 39.5. 40.4. typical. 26.4. 26.5. 27.3. light. 28.3. 29.0. 29.7. light. 34.2. 34.3. 35.2. cool. average. warm. cool. average. warm. Weather. Weather. Figure 14. Performance for typical office building.. An upgrade scenario is illustrated in figure 15, in this scenario the lighting and IT equipment is replaced with the most energy efficient available, 7.8 and 10 W/m2 respectively see table 1. The variations in lighting and IT equipment use patterns of use as represented by the diversity factors of table 1 are the same as for the typical building evaluation. In this scenario the reduction in energy consumption is very apparent compared to the typical case; there is a small but consistent improvement in PPD..
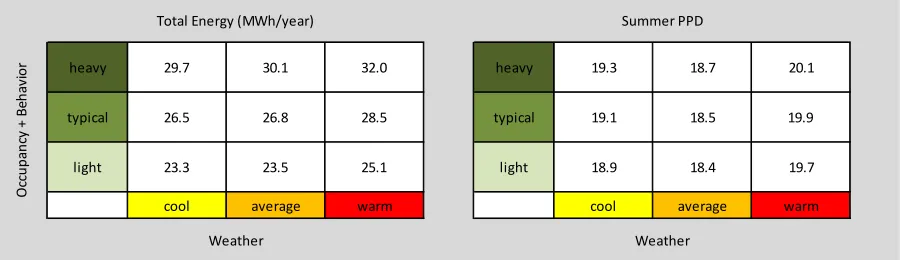
(10) Occupancy + Behavior. Total Energy (MWh/year). Summer PPD. heavy. 29.7. 30.1. 32.0. heavy. 19.3. 18.7. 20.1. typical. 25.1. 25.3. 26.9. typical. 25.8. 25.2. 26.7. light. 20.8. 20.9. 22.2. light. 33.8. 33.1. 34.8. cool. average. warm. cool. average. warm. Weather. Weather. Figure 15. Performance for typical office building with low energy lighting and IT equipment.. A further scenario is illustrated in figure 16, where in addition to the lighting and IT upgrade the lower cooling system setpoint temperature is applied in all cases. Here the calculated PPD shows a corresponding improvement but the energy penalty associated with this is made clear.. Occupancy + Behavior. Total Energy (MWh/year). Summer PPD. heavy. 29.7. 30.1. 32.0. heavy. 19.3. 18.7. 20.1. typical. 26.5. 26.8. 28.5. typical. 19.1. 18.5. 19.9. light. 23.3. 23.5. 25.1. light. 18.9. 18.4. 19.7. cool. average. warm. cool. average. warm. Weather. Weather o. Figure 16. Typical office with low energy lighting and IT equipment and lower cooling setpoint (20.7 C).. These scenarios are used to illustrate the potential use of the methodology, there are of course many other possible upgrades. The performance views are intended to capture energy and comfort performance across the range of conditions likely to be experienced over building lifetime. The performance information is intended to usefully inform design and operational decision making. The scenarios here are for type 2 offices with a single main occupancy period of 8 hours with reduced occupancy outside these times (security and cleaning etc), separate performance scenarios would be generated for type 2 offices with 16 or 24 hour occupancy periods. 4 Discussion The general principle that buildings should work across likely patterns of use and ranges in weather would appear to be obvious, however how this should be assessed is rarely addressed, and there is no standard approach commonly used. The method proposed and then explored here is an attempt to move discussion forward. The illustration of the method for the Egyptian context is purely circumstantial, the method is intended to be applicable elsewhere, in other countries there may be more established datasets. Starting from scratch in the Egyptian context has however provided some useful insights..
(11) The simple performance views illustrated here may be easily augmented to give a more comprehensive performance dashboard with individual energy uses and more complex or alternative performance metrics e.g. indoor air quality etc. or alternative time periods. The performance views containing energy and comfort performance across the different operation and weather scenarios may be useful in design stage but can also serve as a communication vehicle to the operations team and could in future be linked into a real time feedback system. Any perceived performance gap may in part be explained by the different operating conditions or weather from that used to show compliance to specifications. The choice of the notional best and worst case datasets made here, and the selection of PPD as the comfort criteria were choices made by the authors and different choices may be made by others. The PPD criteria for these type 2 offices with available cooling would not necessarily apply in the naturally ventilated offices with no cooling systems where the adaptive standards may apply. The survey of the Egyptian office buildings is not extensive but shows the same trend in increasing energy use in the more highly serviced buildings as found in other situations such as in the ECON19 UK survey. There is scope for further survey to be carried out to give a more comprehensive picture. The focus of the work presented in this paper was to develop a method for assessing building performance including variation in operation, behavior and weather, the next steps are to develop the method further (alternative office types / comfort criteria, performance view extension etc), and investigate the use of the method in support of design and policy. 5 Conclusions Building operating conditions, weather and the behavior of occupants are inherently variable and uncertain. This paper proposes a simple method for including the impact of these variations and uncertainties in building performance assessment for use in design or policy. The current energy and environmental performance of offices in Egypt is characterized through a simple energy survey of multiple offices. A more detailed investigation of an individual office building with natural ventilation and independently controlled local cooling systems is carried out. The method demonstrated includes the creation of a calibrated model, a typical model, and parameter sets representing likely variations in operations, behavior and weather. The observed indoor environment is compared against adaptive and non-adaptive thermal comfort standards. The application of the proposed method is demonstrated for a typical Egyptian office and the same office with changes applied. The more general use and applicability of the method in design and policy is highlighted, and potential usefulness in operation phase discussed..
(12) References Aerts, D., et al. "A method for the identification and modelling of realistic domestic occupancy sequences for building energy demand simulations and peer comparison." Building and environment 75 (2014): 67-78. Ahmed, A. N., Samaan, M. M., Farag, O. M., & El Aishy, A. S. USING SIMULATION TOOLS FOR ENHANCING RESIDENTIAL BUILDINGS ENERGY CODE IN EGYPT. 12th Conference of International Building Performance Simulation Association, Sydney, 14-16 November Annual report of the Egyptian electric holding company, 2009/2010. ANSI/ASHRAE/IESNA standard 90.1-2010, energy standard for building except law rise residential building. ANSI/ASHRAE/IESNA standard 90.1-2013, energy standard for building except law rise residential building. ASHRAE 2001fundamentals handbook (si). Ashrae, A. N. S. I. "Standard 55-2004, Thermal environmental conditions for human occupancy." American Society of Heating, Refrigerating and Air-Conditioning Engineering, Atlanta, GA (2004). Attia, Shady, and Jan LM Hensen. "Investigating the impact of different thermal comfort models for zero energy buildings in hot climates."Proceedings 1st Int. Conf. on Energy and Indoor Environment for Hot Climates. 2014. Cen, E. N. "15251, Indoor environmental input parameters for design and assessment of energy performance of buildings addressing indoor air quality, thermal environment, lighting and acoustics." European Committee for Standardization, Brussels, Belgium (2007). Cena, Krzysztof, and Richard de Dear. "Thermal comfort and behavioural strategies in office buildings located in a hot-arid climate." Journal of Thermal Biology 26.4 (2001): 409-414. Chinazzo, Giorgia, Parag Rastogi, and Marilyne Andersen. "Assessing robustness regarding weather uncertainties for energy-efficiency-driven building refurbishments." Energy Procedia 78 (2015): 931-936. CIBSE TM37 (Design for Improved Solar Shading Control) APPENDEX A. Crawley, Drury B. "Creating weather files for climate change and urbanization impacts analysis." Building Simulation. IBPSA Beijing, 2007. Crawley, Drury B., and Linda K. Lawrie. "RETHINKING THE TMY: IS THE ‘TYPICAL’METEOROLOGICAL YEAR BEST FOR BUILDING PERFORMANCE SIMULATION?." Conference: Building Simulation 2015, At Hyderabad, India. Dabaieh, Marwa, et al. "Reducing cooling demands in a hot dry climate: A simulation study for non-insulated passive cool roof thermal performance in residential buildings." Energy and Buildings 89 (2015): 142-152. De Dear, Richard J. "A global database of thermal comfort field experiments." ASHRAE transactions 104 (1998): 1141. Elharidi, Aly Mohamed, et al. "CALIBRATION OF NUMERICAL SIMULATIONS MODELING OF NONRESIDENTIAL BUILDING IN HOT HUMID CLIMATE REGION." Fabi, Valentina, et al. "Description of occupant behaviour in building energy simulation: state-of-art and concepts for improvements." Building Simulation 2011 (2011)..
(13) Fabi, Valentina, V. Camisassi, and Stefano Paolo Corgnati. "Verification of the impact of occupancy-related assumptions on the energy performance of an office building in different climates." (2014): 123-128. Farghal, Amgad, and Andreas Wagner. "Studying the adaptive comfort model a case study in a hot dry climate, Cairo, Egypt." Proceedings of Conference, Adapting to Change: New Thinking on Comfort. 2010. Kamilaris, Andreas, et al. "A literature survey on measuring energy usage for miscellaneous electric loads in offices and commercial buildings."Renewable and Sustainable Energy Reviews 34 (2014): 536-550. Karjalainen, Sami. "Should we design buildings that are less sensitive to occupant behaviour? A simulation study of effects of behaviour and design on office energy consumption." Energy Efficiency (2016): 1-14. Lam, Joseph C., and Sam CM Hui. "Sensitivity analysis of energy performance of office buildings." Building and Environment 31.1 (1996): 27-39. Linden, W., M. G. L. C. Loomans, and J. L. M. Hensen. "Adaptive thermal comfort explained by PMV." Proceedings of the 11th International Conference on Indoor Air Quality and Climate, Copenhagen. 2008. Macdonald, I. A., J. A. Clarke, and P. A. Strachan. "Assessing uncertainty in building simulation." Proc. Building Simulation. Vol. 99. 1999. Mahdavi A. Chapter 4: people in building performance simulation in Building performance simulation for design and operation. Routledge; 2011. pp. 56-83. Mahdavi, Ardeshir, and Claus Pröglhöf. "User behavior and energy performance in buildings." Wien, Austria: Internationalen Energiewirtschaftstagung an der TU Wien (IEWT) (2009). Menezes, A. C., et al. "Estimating the energy consumption and power demand of small power equipment in office buildings." Energy and Buildings75 (2014): 199-209. Morishita, Naomi, Kerstin Seif, and Thomas Bednar. "Consistent Modeling of Occupant Behavior in Detailed and Simplified Calculation Methods for Heating Energy Need." Energy Procedia 78 (2015): 645-650. Raftery, Paul, Marcus Keane, and Andrea Costa. "Calibration of a detailed simulation model to energy monitoring system data: a methodology and case study." Proceedings of the 11th IBPSA Conference, Glasgow, UK. 2009. Reinhart, Christoph F. "Lightswitch-2002: a model for manual and automated control of electric lighting and blinds." Solar Energy 77.1 (2004): 15-28. Royapoor, Mohammad, and Tony Roskilly. "Building model calibration using energy and environmental data." Energy and Buildings 94 (2015): 109-120. Tahmasebi, Farhang, and Ardeshir Mahdavi. "A two-staged simulation model calibration approach to virtual sensors for building performance data."Proceedings of the 13th Conference of International Building Performance Simulation Association, Chambéry, France. 2013. Taleghani, Mohammad, et al. "A review into thermal comfort in buildings. “Renewable and Sustainable Energy Reviews 26 (2013): 201-215. Tian, Wei. "A review of sensitivity analysis methods in building energy analysis." Renewable and Sustainable Energy Reviews 20 (2013): 411-419..
(14) Toe, Doris Hooi Chyee, and Tetsu Kubota. "Development of an adaptive thermal comfort equation for naturally ventilated buildings in hot–humid climates using ASHRAE RP-884 database." Frontiers of Architectural Research 2.3 (2013): 278-291. Tuohy, Paul Gerard, et al. "Comfort driven adaptive window opening behaviour and the influence of building design." (2007). Wang, Danni, Clifford C. Federspiel, and Francis Rubinstein. "Modeling occupancy in single person offices." Energy and buildings 37.2 (2005): 121-126. Westphal, Fernando Simon, and Roberto Lamberts. "Building simulation calibration using sensitivity analysis." Ninth International IBPSA Conference. 2005. Yang, Liu, et al. "A new method to develop typical weather years in different climates for building energy use studies." Energy 36.10 (2011): 6121-6129. Yun, Geun Young, Paul Tuohy, and Koen Steemers. "Thermal performance of a naturally ventilated building using a combined algorithm of probabilistic occupant behaviour and deterministic heat and mass balance models."Energy and buildings 41.5 (2009): 489-499..
(15)
Figure


+6

Related documents