City, University of London Institutional Repository
Citation:
Shittu, R., Healing, A., Ghanea-Hercock, R., Bloomfield, R. E. and Rajarajan, M.
(2015). Intrusion alert prioritisation and attack detection using post-correlation analysis.
Computers & Security, 50, pp. 1-15. doi: 10.1016/j.cose.2014.12.003
This is the accepted version of the paper.
This version of the publication may differ from the final published
version.
Permanent repository link:
http://openaccess.city.ac.uk/8680/
Link to published version:
http://dx.doi.org/10.1016/j.cose.2014.12.003
Copyright and reuse: City Research Online aims to make research
outputs of City, University of London available to a wider audience.
Copyright and Moral Rights remain with the author(s) and/or copyright
holders. URLs from City Research Online may be freely distributed and
linked to.
City Research Online:
http://openaccess.city.ac.uk/
[email protected]
Intrusion Alert Prioritisation and Attack Detection
using Post-Correlation Analysis
Riyanat Shittua,, Alex Healingb, Robert Ghanea-Hercockb, Robin Bloomfielda, Rajarajan Muttukrishnana
aSchool of Engineering and Mathematical Science, City University London, Northampton
Square EC1V 0HB, UK
bSecurity Futures Practice, Research & Innovation, British Telecom, Ipswich, IP5 3RE, UK
Abstract
Event Correlation used to be a widely used technique for interpreting alert logs
and discovering network attacks. However, due to the scale and complexity of today’s networks and attacks, alert logs produced by these modern networks are much larger in volume and difficult to analyse. In this research we show that adding post-correlation methods can be used alongside correlation to sig-nificantly improve the analysis of alert logs.
We proposed a new framework titledA Comprehensive System for Analysing
Intrusion Alerts (ACSAnIA). The post-correlation methods include a new
pri-oritisation metric based on anomaly detection and a novel approach to clustering events using correlation knowledge. One of the key benefits of the framework is that it significantly reduces false-positive alerts and it adds contextual infor-mation to true-positive alerts.
We evaluated the post-correlation methods of ACSAnIA using data from a 2012 cyber range experiment carried out by industrial partners of the British Telecom SATURN programme. In one scenario, our results show that false-positives were successfully reduced by 97% and in another scenario, 16%. It also showed that clustering correlated alerts aided in attack detection.
The proposed framework is also being developed and integrated into a pre-existing Visual Analytic tool developed by the British Telecom SATURN Re-search Team for the analysis of cyber security data.
1. Introduction
A 2013 study showed that 84% of attacked organisations had evidence of the attack in their event log files (Verizon, 2013). This demonstrates that the task
Email addresses: [email protected](Riyanat Shittu),
[email protected](Alex Healing),[email protected](Robert
Ghanea-Hercock),[email protected](Robin Bloomfield),
of successfully analysing event logs for the purpose of attack detection is non-trivial. Event Correlation is a process used to detect attacks by finding multiple network events and activities with similar properties. Take for instance, in intrusion detection, an alert indicating the exploit of a known vulnerability on a host can be correlated with the host’s list of vulnerabilities. This may prove useful in validating the intrusion alert as threatening or non-threatening.
Most widely used security event analysis tools such as IBM’s Intelligent Operation Center (IBM Corporation, 2013) and AlienVault’s USM (Alienvault, 2013) apply event correlation.
In our proposed framework - ACSAnIA, event correlation is the primary component and it is targeted at the analysis of Intrusion Detection System (IDS) alerts. The reason is that IDSs - particularly signature based IDSs - are known to generate a vast amount of low-level alerts with a high percentage being false positives. Using event correlation, IDS alerts can be grouped into high-level structures called meta-alerts. Meta-alerts make it easier to identify alerts that are interesting. Furthermore, meta-alerts significantly reduces the amount of data required to be assessed by a security analyst.
Post-correlation processes such as“Prioritisation Analysis”are used to anal-yse alerts after correlation has been performed (Salah et al., 2013). Prioritisation assigns a level of importance to each meta-alert. This aids a response system in determining the order IDS alerts should be addressed. In general, our ob-servation from literature is that a small amount of research has focussed on improving post-correlation methods.
1.1. Contributions
In ACSAnIA, we focus on improving attack detection and enhancing the output of the correlation by performing post-analysis. The main contributions presented in this paper are:
1. A new metric for prioritising alerts based on anomalous behaviour. 2. A new method for applying clustering on correlated alerts.
3. An improved data structure for representing robust attack patterns.
The first contribution is the prioritisation metric. Our hypothesis is that a set of correlated alerts should be prioritised if it represents anomalous network behaviour at a given time. The prioritisation metric is based on our previous work (Shittu et al., 2014). In our new work we have improved the correlation phase. It uses the LOF (Local Outlier Factor) algorithm (Breunig et al., 2000) to assign an outlier value between 1 and 4 to each group of correlated alerts. In this research, each group of correlated alerts is referred to as a meta-alert. Meta-alerts with higher outlier values indicate higher anomalies thus higher prioritisations.
attacks which involve many alerts. In our work, a meta-alert can be seen as an overview of an attack with potentially multiple steps. Clustering similar meta-alerts into groups allow the discovery of similar attack patterns. In our work, we apply a density based clustering method, DBSCAN (Ester et al., 1996) which finds arbitrary sized and shaped clusters within a given density scope.
The final contribution is that through investigating methodologies for un-derstanding attacks, we propose a new approach to extracting attack patterns from meta-alerts. Attack patterns are properties observed accross two or more meta-alerts that capture part of an attackers intention. Frequent pattern mining is applied to meta-alerts for pattern extraction using a graph mining algorithm, GSPAN (Yan, 2002).
To the authors’ knowledge, the contributions listed are novel and timely. In Contribution 1, others have proposed prioritisation metrics but not based on anomaly analysis. Our results show that anomaly behaviour is a suitable approach for prioritisation IF outlier alerts exist in the dataset. In one of the datasets which had distinct outliers we significantly reduced the false positives by upto 99.7%. In another scenario with lesser distinct outliers the false positives were reduced by 16%. For Contribution 2, it is acknowledged that Patel (2009) first proposed clustering meta-alerts however we improve on this by using more robust data structures and clustering approaches. To achieve this we adapt data structures from graph based analysis. For Contribution 3, to our knowledge, is an entirely new area of investigation used to detect new types of attack patterns based on meta-alerts.
2. Related Work
The related work in this section is taken from three key areas - alert priori-tisation, correlation and attack pattern extraction.
To the knowledge of the authors, very little work has been done on defining IDS alert prioritisation metrics. Porras et al. (2002) first proposed an alert rank-ing framework, M-Correlator, with a prioritisation component that consisted of two security metrics: relevance and the priority scoring. Relevance scoring mea-sured the validity of an alert while priority scoring meamea-sured the severity of an alert given the targeted asset’s value. The priority score also combined an inter-est score which measured the degree to which an analyst expressed interinter-est in the attack category the alert belonged. Using a Bayesian model they determine the overall priority of an alert based on the acquired evidence. A limitation in their approach is that knowledge from alert correlation is not taken into account during the prioritisation despite their framework consisting of a simi-larity based correlation component. Since it is solely based on user and network knowledge the framework is limited to discovering known incidents while novel attack incidents remain unprioritised.
it only used network knowledge and no alert or correlation context was taken into consideration. A more robust alert prioritisation system is proposed by Alsubhi et al. (2008, 2012) who define 7 metrics for prioritising alerts. One of the metrics, called alert relationship metric is relevant to our work. The alert relationship metric measures the degree to which the alert correlates with successive alerts. Using this prioritisation metric a high value could indicate the alert is potentially a causal alert. Our proposed outlier metric differs in two main ways. Firstly, we assign prioritisation at the meta-alert level rather than the alert level. Secondly, we not only measure the causality of alerts but furthermore, the unusualness of the causality.
Zomlot et al. (2011) also proposed a prioritisation model for the alert cor-relation system they had previously presented (Sundaramurthy et al., 2011). In their work on prioritisation, they use Dempster-Shafer to assign a degree of belief to each meta-alert (generated by the correlation system) which indicated the likelihood of true positivity given the quality of the IDS sensor which raised the alerts. Unlike alert prioritisation, more effort has been focussed on alert correlation techniques. Using Salah et al’s correlation model taxonomy, these can be classified into case-based, similarity-based and sequential-based methods. Case-based methods involve a rule language that uses expert domain knowledge to define alert types that may occur in a given attack scenario.Cuppens and Ortalo (2000); Cheung et al. (2003); Steven Eckmann (2002); C´edric Michel (2001) proposed LAMBDA, CAML, STATL, and ADELE respectively. More recent work in case-based models include work by Zali et al. (2013) and Alireza Sadighian (2013). Although these provide high-quality correlations capturing known attacks, their limitation is that they are difficult to implement and main-tain on large-scale complex networks. In similarity methods, the correlation is based on feature similarity. Valdes and Skinner (2001) as well as Dain and Cun-ningham (2001) first introduced this approach. Although simpler to implement, such methods do not capture complex nor hidden correlations. More Recently, Hofmann and Sick (2011) and Chen et al. (2014) both proposed improved simi-larity techniques using feature selection and probablistic and real-time clustering techniques. Sequential-based correlation is more suitable for capturing causally correlated alerts with little or no apriori knowledge. Sequential-based meth-ods include those proposed by Ning et al. (2001) and Debar and Wespi (2001). Both used rule-like pre-requisites and consequences for correlating alerts. Qin (2005) also used abstract pre-requisites and consequences combined with statis-tical evaluation for correlating alerts. Sequential-based alert correlation models which use little to no a priori knowledge are based on Bayesian inference. Exam-ples include work by Ahmadinejad and Jalili (2009); Ren et al. (2010); Marchetti et al. (2011) and Benferhat et al. (2013).
models this case is typical in real environments. In environments where a vast amount of alerts are produced, it is likely to generate a similarly vast amount of alert correlation graphs. Our work aims to address this challenge by introduc-ing post-correlation components to make analysintroduc-ing the graphs a more tractable problem for the human analyst.
In the study of attack pattern extraction and recognition many apply fre-quent pattern mining algorithms. Khan et al. (2010) developed two probabilistic models to integrate with a prior existing pattern mining algorithm, Prefix-Span for mining frequent structures in Subgraphs. In their work they test the algo-rithm on intrusion alert traffic and discover meaningful attack patterns. Sadod-din and Ghorbani (2009) also applied FP-Growth, a frequent pattern mining technique for discovering graph attack patterns. Other work using pattern min-ing algorithms include work by Lagzian (2012).
One of the main challenges with applying frequent pattern mining on ACGs is that ACGs are multi-attributed weighted graphs therefore most of the meth-ods cannot be used to mine such complex structures. In this research we investi-gate attack pattern structures and how frequent pattern mining can be applied on graph structures without the need for over-simplifying the data structures which may cause information loss.
3. Background on Alert Analysis
3.1. Low-level Alert
Figure 1 corresponds to a log entry of a single intrusion alert triggered by a Snort IDS.Line 1 identifies the type, classification and the default priority of the intrusion alert. Line 2 logs thetime the intrusion was detected and theIP
addresses and ports of the sender and recipient of the packet which triggered
the alert. In addition,lines 3 & 4 log details of the packet such as the packet’s Time to Live(TTL), network protocol, Type of Service(TOS), length and other packet header details.
ICMP - I N F O P I N G - > M i s c a c t i v i t y - > P r i o r i t y 3
0 3 / 0 7 - 1 5 : 4 5 : 3 7 . 1 3 7 3 4 4 - > 1 7 2 . 1 6 . 1 1 3 . 8 4 - > 1 3 5 . 1 3 . 2 1 6 . 1 9 1 I C M P TTL : 2 5 5 TOS :0 x0 ID : 1 3 3 2 i p L e n :20 D g m L e n :38
T y p e :8 C o d e :0 ID : 2 0 4 9 Seq : 5 6 3 2 E C H O
Figure 1: Snort IDS Alert Example
3.2. Meta-alert and Alert Correlation Graph
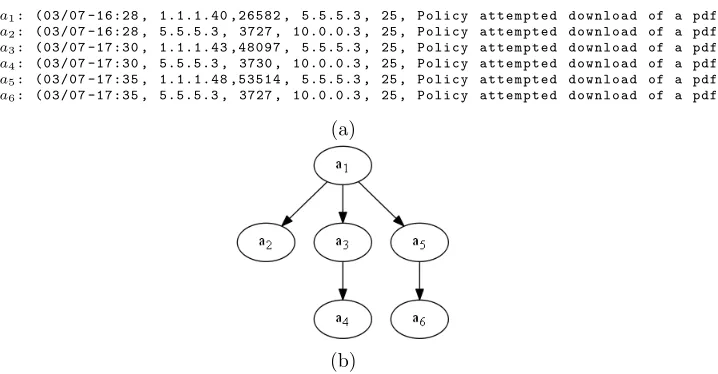
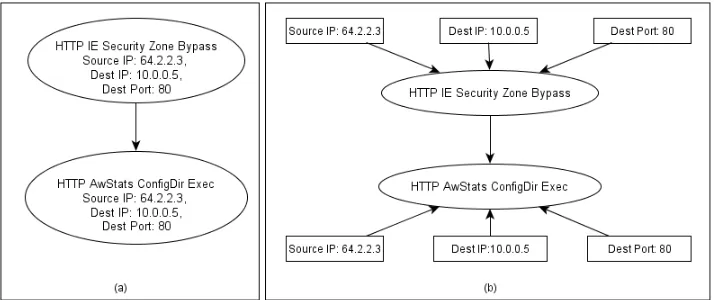
A meta-alert is a higher-level alert which contains one or more low-level alerts (e.g. Snort alerts) grouped together by an aggregation or correlation system. Figure 2(a) shows a set of intrusion alert tuples labelleda1 to a6. After some form of correlation, a logical relation such as Figure 2(b) is established and is referred to as an “Alert Correlation Graph”.
In prior research, a meta-alert has been referred to as a alert, hyper-alert graph, hyper-alert correlation graph and attack graph. To ensure clarity, only the terms meta-alert and alert correlation graph are used in this paper. In general, the term meta-alert is used when describing correlated alerts. As a more technical definition, particularly when referencing the “graph” data structure of the correlation alerts depicted in Figure 2(b), the term “Alert Correlation Graph” is used.
a1: ( 0 3 / 0 7 - 1 6 : 2 8 , 1 . 1 . 1 . 4 0 , 2 6 5 8 2 , 5 . 5 . 5 . 3 , 25 , P o l i c y a t t e m p t e d d o w n l o a d of a pdf ) a2: ( 0 3 / 0 7 - 1 6 : 2 8 , 5 . 5 . 5 . 3 , 3727 , 1 0 . 0 . 0 . 3 , 25 , P o l i c y a t t e m p t e d d o w n l o a d of a pdf )
a3: ( 0 3 / 0 7 - 1 7 : 3 0 , 1 . 1 . 1 . 4 3 , 4 8 0 9 7 , 5 . 5 . 5 . 3 , 25 , P o l i c y a t t e m p t e d d o w n l o a d of a pdf )
a4: ( 0 3 / 0 7 - 1 7 : 3 0 , 5 . 5 . 5 . 3 , 3730 , 1 0 . 0 . 0 . 3 , 25 , P o l i c y a t t e m p t e d d o w n l o a d of a pdf )
a5: ( 0 3 / 0 7 - 1 7 : 3 5 , 1 . 1 . 1 . 4 8 , 5 3 5 1 4 , 5 . 5 . 5 . 3 , 25 , P o l i c y a t t e m p t e d d o w n l o a d of a pdf )
a6: ( 0 3 / 0 7 - 1 7 : 3 5 , 5 . 5 . 5 . 3 , 3727 , 1 0 . 0 . 0 . 3 , 25 , P o l i c y a t t e m p t e d d o w n l o a d of a pdf )
(a)
(b)
Figure 2: (a)A set of alert tuples -(timestamp, source IP, source port, destination IP, destination Port, and intrusion type) before correlation and (b) A meta-alert/alert
correlation graph
An alert correlation graph is a weighted directed acyclic connected graph G = (V, E) where V represents a set of nodes and each node v ∈ V represents an 6-tuple low-level alert. Each edge, evi,vj ∈ E is a connection between two
nodesvi, vj which indicate that 1) viand vj are correlated and 2) vi represents
an alert that occurred before vj. The weight of the edge depicts the correlation
strength between both nodes.
4. Architecture of the Proposed System
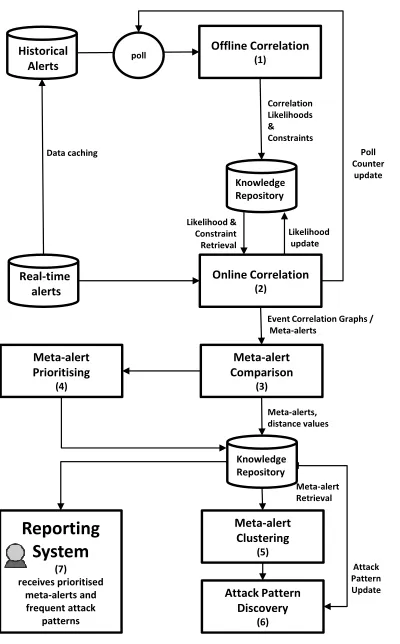
[image:7.612.134.493.295.482.2]System. A knowledge repository and database is also used to persist alert infor-mation and discovered knowledge. Figure 3 shows the architecture of ACSAnIA.
Offline Correlation (1) Online Correlation (2) Historical Alerts Real-time alerts Knowledge Repository Meta-alert Comparison (3) poll Likelihood update Likelihood & Constraint Retrieval Poll Counter update Correlation Likelihoods & Constraints
[image:8.612.224.424.160.482.2]Event Correlation Graphs / Meta-alerts Data caching Meta-alert Prioritising (4) Meta-alerts, distance values Knowledge Repository Meta-alert Clustering (5) Attack Pattern Discovery (6) Reporting System (7) receives prioritised meta-alerts and frequent attack patterns Attack Pattern Update Meta-alert Retrieval
Figure 3: Architecture of the ACSAnIA Framework
4.1. Offline Correlation
ACSAnIA uses a set of historic alerts to build a correlation model. The correlation model is built by the offline correlation component and is periodi-cally used and updated by the online correlation component. The correlation model consists of two knowledge tables: (i) Correlation Likelihood Table and (ii) Correlation Constraint Table. A correlation likelihood represents the strength between two alert typesTaandTb. More specifically, it refers to thelikelihoodof
an alert of typeTb occurring after an alert of typeTa. For any two alert types, Ta and Tb, the correlation likelihood L(Ta, Tb) is conditional to a constraint
being true. The relationship between correlation likelihood and constraint is represented in Eq.1.
A constraint, C, is a rule which captures the conditions under which two alerts are correlated. For example a constraint such as timea,b ≤20secs
indi-cates that both alert typesTa andTb are correlated when they occur within 20
seconds of each other. Another illustration of a constraint is{destIPa,b = 1},
this indicates that both alert type Ta and Tb are correlated when they share
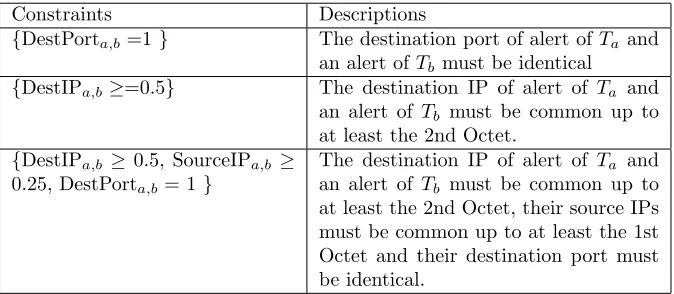
the same destination IP (In other words, the difference between their destina-tion IP addresses is zero). Table 1 illustrates further examples of constraints encountered.
Constraints Descriptions
{DestPorta,b=1} The destination port of alert ofTa and
an alert ofTb must be identical
{DestIPa,b ≥=0.5} The destination IP of alert of Ta and
an alert of Tb must be common up to
at least the 2nd Octet.
{DestIPa,b ≥0.5, SourceIPa,b ≥
0.25, DestPorta,b= 1}
The destination IP of alert of Ta and
an alert of Tb must be common up to
[image:9.612.134.471.229.376.2]at least the 2nd Octet, their source IPs must be common up to at least the 1st Octet and their destination port must be identical.
Table 1: Examples of Constraints between Alert Types
When two alert types haven:n >1 constraints between them, the correla-tion likelihood between the two alert types is the minimum likelihood of then
constraints:
L(Ta, Tb) = min{P(Ta→Tb|Ci)}ni=1 (2)
where the probability ofTa →Tb occurring givenCi is defined as:
P(Ta →Tb|Ci) =
P(Ci)∗P(Ci|Ta→Tb) P(Ta→Tb)
(3)
In Eq.3, given a set of historical alerts,P(Ta→Tb) refers to the number of
timesTboccurs afterTa in the same time windowW with respect to the number
of timesTaoccurs in that same window. P(Ci) refers to the number of times an
alert of TypeTb occurs after an alert ofTa where both types satisfy constraint Ci with respect to the number or times Ta occurs in the total historial alert
datasetH. Finally,P(Ci|Ta→Tb) is the probability ofCi given both TypeTa
andTb occur within the same time window.
Algorithm 1Offline Correlation Process
1: functionoffline Process
2: A= All alert attributes
3: H= Historic Alerts
4: T= All alert types in H
5: T0= All pairs of types in T
6: for allTa, Tb∈T0do 7: C(Ta, Tb) =
8: getConstraints(A, Ta, Tb) 9: L(Ta, Tb) =
10: min{
11: P(Ta→Tb|C(Ta, Tb)i)
12: }n
i=1 13: end for
14: end function
1: functiongetConstraints(C, Ta, Tb)
2: k= 1
3: C(Ta, Tb)← ∅
4: Get first order feature set
5: for allci∈Cdo
6: ifP(Ta→Tb|ci)> θthen 7: C(Ta, Tb)←C(Ta, Tb)k∪ci 8: end if
9: end for
10: Gets k relevant feature sets
11: k←2
12: C← ∅
13: while(C(Ta, Tb)k−16=∅)do 14: C←All k combinations from
15: C(Ta, Tb)k−1 16: for allci∈Cdo
17: if P(Ta→Tb|ci)> θthen 18: C(Ta, Tb)k←C(Ta, Tb)k∪ci 19: end if
20: end for
21: k+ 1
22: end while
23: returnC(Ta, Tb) 24: end function
Lines 1 to 5 describe the dataset required to initialise the offline process. Ais the set of alert fields used by ACSANIA i.e. (timestamp, source IP, source port,
destination IP, destination Port, and intrusion type), H is a set of historical
alerts used to train the model which are retrieved from log files or an alert database, T is a finite set of all values possible for field type and T0 is a set containing all 2-permutations of the set T where Ti0 represents the ith T
a, Tb
pair.
For each pair, the functiongetConstraintsgenerates a set of constraints by computing all possible k-combinations of the attributes inAusing an step-wise apriori approach. Firstly, we start with the k−combination where k= 1. This means we generate constraints of length 1, where each constraint,C only contains one attributea∈A. For each constraint, we measure the probability that Ta will occur before Tb given they have the constraint C in common. If
the probability does not exceed a given thresholdθ, it is pruned and considered as non-relevant to the pair Ta, Tb. At the end of each incremental stage,
non-pruned constraints are used to generate K+ 1 combinations :k <=|A|. This is how the Constraint 3 in Table 1 is generated.
4.2. Online Correlation
Each incoming alert aj, received in real-time is analysed against a set of
alertsS ={a1, a2, ..., an} that had occurred within the last Tθ seconds before
alert aj. To determine if aj and an alert in S are correlated, their types are
extracted and used to find the relevant correlation likelihood and constraints (stored in the knowledge repository by the offline component). Two alerts are correlated if:
1. The correlation likelihood of Typeaiand Typeaj is greater than or equal
2. At least one of the respective constraints of Type ai and Typeaj holds
true forai andaj.
Each analysed historic alert is stored as a node in the database. If the incoming alert aj is correlated with an existing alert ai, aj is added to the
meta-alert which ai belongs to. Consequently, an edge is added to the
meta-alert to depict the correlation.
4.3. Meta-alert Comparison
The correlation process typically produces multiple meta-alerts. Under in-tense traffic analysis, hundreds of meta-alerts may be produced within a short time frame. In order to make sense of the generated meta-alerts, a quantita-tive approach is used to measure the differences between each meta-alert. This is subsequently used by the Meta-alert Prioritising and Meta-alert Clustering Components.
The importance of such analysis is explained in this real example that was observed in the analysis of one of our networks. Two arbitrary meta-alerts,
m1, m2where pulled out from a large set of generated meta-alerts. m1consists of two connected nodes (v1m1, v2m1) wherev1m1 represented a suspicious ping from
a mail server to a web server and thev1m1 represented the response from the web
server to the mail server (the reply also triggered an intrusion). m2also consisted of two connected nodes however different context. v1m2 represented an intrusion
triggered on a packet from an external address routed to our networks DMZ mail server, the DMZ server then routed the packet to our internal mail server. This also triggered an alert which is represented byv2m2. Despite the similarity in
structure, visual analysis enables a security analyst to understand the attack patterns and their context (and that they are not the same type of intrusion). In addition, it was observed that many of the generated meta-alerts were similar to either but not both. Given thousands of meta-alerts detecting such attack patterns may prove infeasible to perform visually. Clustering analysis however could potentially solve this challenge.
As previously described in Section 3, the alert correlation graph (ACG) is the data structure of a meta-alert. Graph Edit Distance (GED) is used as the distance metric to compute the quantitative differences between alert correlation graphs (Shapiro and Haralick, 1981).
Algorithm 2Edit Distance between meta-alerts (Tekhov, 2009)
1: functionEditDistance(’acg1, ’acg2) 2: L←maximum cost allowed
3: Q← ∅ .A queue sorted by
4: minimum path cost
5: vi←random vertex from ’acg1 6:
7: forvjin ’acg2do
8: s = new substitutePath(vi,vj)
9: Q←Q∪s
10: end for
11: d←new deletePath(vi)
12: Q←Q∪d
13: whiletruedo
14: e = Q.firstPath()
15: ife.isComplete()then
16: returne
17: end if
18: ife.cost()>Lthen .The maximum cost has been exceeded
19: returnL
20: end if
21: Extend(e,acg1, ’acg2, Q) 22: end while
23: end function
1: functionExtend(e,acg1,acg2, Q) 2: ifacg1(V)⊆ethen
3: vi= next vertex inacg1:vi∈/e
4: forvj ∈acg2do
5: s←e∪new substitutePath(vi,vj)
6: Q←Q∪s;
7: end for
8: d←e∪new deletePath(vi)
9: Q←Q∪d
10: else
11: forvi∈acg2do
12: ifvi∈/ethen
13: i←e∪new insertPath(vi) 14: end if
15: end for
16: end if
17: end function
In Algorithm 2, there are three key operations -substitute path, delete path
andinsert path. Each operation requires a cost function which is used to sort
them in the queue. Using domain knowledge, a set of cost functions suitable for meta-alert comparison are defined.
Insert and Delete Path C(NI), C(ND). When comparing any two ACGs, if
one graph has more nodes (i.e. low-level alerts) than the other, a set of node insertions or deletions may be used to transform one graph into the other. For each intrusion type, we define a weightwN(T), In our experiments, all weights were defaulted to 1.
For edges, the cost of edge insertion/deletion is equivalent to the weight of the edge.
Substitute Path. The substitution of a node replaces an alert for another.
There-fore the more similar the alerts, the less the cost of substitution. We measure the similarity between the alerts using the Euclidean metric in eq.4.
C(NS) = d(vi,vj) =
v u u t n X k=1
(vi(αk)−vj(αk))2 (4)
Note that vi(αk) is the kth attribute of alert vi and n is the total number
of attributes. For categorical attributes, we use string edit distance and for IP attributes we use a common prefix metho. An example of the difference between two IP addresses is shown in Table 2.
Table 2: IP Similarity
172.16.113.20 10101100 . 00010000 . 01110001 . 11001111 172.16.115.20 10101100 . 00010000 . 01110011 . 00010100 Common Mask 11111111 . 11111111 . 11111100 . 00000000
22/32 = 0.68
C(ED) =|WEs−WEd| (5)
4.4. Meta-alert Prioritisation
The alert prioritisation component assigns a priority level to each meta-alert based on its dissimilarity to a set of other meta-meta-alerts. There are four priority levels, meta-alerts which are highly similar to others are typically as-sociated with a Priority 1 or 2 while highly dissimilar meta-alerts are assigned level 3 or 4.
Each meta-alert is mapped to a prioritising value based on the degree to which it is an outlier. The degree to which a meta-alert is an outlier is calculated using the Local Outlier Factor (LOF), of a point Breunig et al. (2000). The mapping between priority values and the LOF of a meta-alert is illustrated:
p(g) =
1 0.00≤nLOF(g)≤0.25 2 0.25<nLOF(g)≤0.50
3 0.50<nLOF(g)≤0.75 4 0.75<nLOF(g)≤1.00
(6)
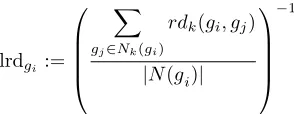
In equation 6,gis a meta-alert and nLOF is the weighted LOF value. nLOF is calculated over five steps using a point’s (meta-alert’s) neighbourhood, reach-ability distance and local density.
1. k-neighbourhood & k-distance: A k-neighbourhood of a meta-alert gi,
denoted as Nk(gi), is a set of other meta-alerts in which the difference
between any of the other meta-alerts and gi is less than or equal to the
k-distance. The k-distance of a gi is the distance between gi and the kth nearest meta-alert. k is a configurable parameter provided for the
algorithm’s computation.
2. reachability distance: This is the maximum between the distance between two meta-alerts and the latter meta-alert’s k-distance.
rdk(g,gj) = max{D(g, gj), k-distance(gj)} (7)
k-neighbourhood.
lrdgi:=
X
gj∈Nk(gi)
rdk(gi, gj)
|N(gi)|
−1
(8)
4. Local Outlier Factor: For each meta-alert,g, its LOF degree is calculated:
LOFgi=
X
gj∈Nk(gi)
lrdgi
lrdgj
|Ngi|
(9)
5. LOF Priority: Since the value LOF could range between 0 and∞, we use a weighted technique to map the LOF to a value between 0 and 1.
nLOF(g) = LOF(g)
max{LOF(gi)}|iG=0| (10)
Following the computation of the prioritisation value of each meta-alert, the meta-alert prioritisation component uses a filtering subcomponent which forwards all alerts with a threshold greater thanPθ to a reporting system for
further investigation.
4.5. Meta-alert Clustering
The meta-alert clustering component receives the set of meta-alerts,Gand groups them into clusters if|G| is greater than two. A given meta-alert,g is considered to belong to clusterCiif it is density reachable by an inlier member
of clusterCi. An inlier of a cluster is any meta-alert, gi∈Ci that has at least kother meta-alerts which is similar to it(i.e. the difference between gi and gj: gj∈Ci should be less than a threshold referred to as). The clustering process
uses the DBSCAN algorithm and is illustrated in Algorithm 4.
4.6. Attack Pattern Discovery
[image:14.612.244.391.146.203.2]The attack pattern discovery component receives the clusters of meta-alerts and attempts to extract a set of representative features for each cluster using frequent pattern mining. Prior to pattern mining, the attack pattern discovery component represents each meta-alert as a less complex graph structure. This graph structure is referred to as a pattern graph. An attack pattern graph is a graph representation of a meta-alert where each node either represents an alert type or attribute of an alert type and each edge either represents the correlation between two alert types or the association of an attribute to an alert type.
Algorithm 4DBSCAN algorithmic procedure (Ester et al., 1996)
1: functionClusterGraphs(G, k,)
2: i = 0 //the ith cluster
3: C =∅//A set of all clusters
4: for allg∈Gdo
5: if(state(g) == unvisited)then
6: state(g)←visited
7: N(g) =getNeighbors(g,)
8: if(sizeOf(N(g)<k)then
9: category(g)←NOISE
10: else
11: Ci← ∅
12: growCluster(g, N(g), Ci,, k) 13: end if
14: end if
15: end for
16: end function
17: functiongrowCluster(g, N(g), Ci,
, k)
18: Ci←Ci∪g
19: for allg’∈N(g)do
20: if(state(g’) is unvisited)then
21: (g’)←visited
22: N(g’) ← getNeighbors(g’,
)
23: end if
24: if(sizeOf(N(g’))geqk)then
25: N(g) ← N(g) ∪ neigh-bors(g’)
26: end if
27: if (category(g’) is NULL) then
28: Category(g’)←i
29: Ci←Ci∪g’
30: end if
31: end for
32: end function
mining is not suitable for multi-attribute nodes, each node is flattened into a single attributed labelled node. This is done by representing each attribute of an alert as a new node. In order to maintain all attributes and by associating each attribute node to the alert type node using an edge as illustrated in Figure 4 (b). Attribute nodes are distinguished from alert type nodes by using different shapes. A graph frequent pattern mining algorithm, GSPAN is used to extract
Figure 4: (a) An Alert Correlation Graph (b) Attack Pattern Graph of the Alert Correlation Graph
frequent patterns from each cluster. Given a set of graphs and a minimum support threshold value Sθ, a set of frequent patterns is extracted. Each frequent
pattern extracted from any cluster Ciis a subgraph common to at least Sθ
[image:15.612.128.485.410.560.2]4.7. Reporting System
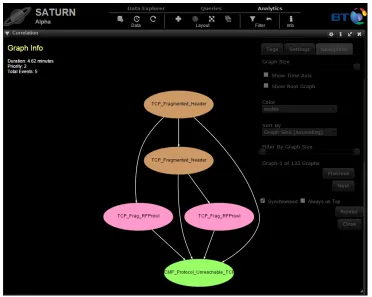
[image:16.612.131.503.197.494.2]The reporting system is a visual analytic web application and is integrated into the “Saturn Assure Analytics” tool-kit developed at British Telecom’s Se-curity Research Labs. This tool-kit is described in detail by (Rowlingson et al., 2013).
Figure 5: A snippet of the ACSANIA reporting system dashboard.
5. Evaluation Metrics
The ACSAnIA system is evaluated by using quantitative measures to mea-sure the quality of the prioritisation and clustering components.
5.1. Alert Prioritisation Quality
The quality of the prioritised meta-alerts is measured using the sensitivity metric typically known as the true positive rate (TPR). The TPR evaluates the ability of the system to correctly prioritise the right meta-alerts. It is defined as follows:
TPR =TP P =
# of correctly prioritised alerts
# of true positive alerts (11)
The false positive rate (FPR) is also measured as the system’s ability to ensure that unimportant meta-alerts are not prioritised.
FPR = FP N =
# of incorrectly prioritised alerts
# of prioritised alerts (12)
5.2. Cluster Quality
Intuitively a set of well clustered points are those where there is a high intra-similarity between the members of each cluster but a low inter-similarity between the various clusters. To measure this quality, the silhouette coefficient of each cluster is measured. The silhouette coefficient is defined as:
SC(Ci) =
|Ci|
X
k=1
bk−ak
max{ak, bk}
/|Ci| (13)
Such thatak andbk are the mean intra-cluster similarity and inter-cluster
sim-ilarity of thekth member of ClusterC
i respectively. For each member, g of a
clusterCi,aandbare defined as follows:
a=
X
gk∈Ci
D(g, gk)
|Ci|
andb=
X
gk∈Ci{D(g,gk) |C{
i|
Note thatC{
6. Experiments and Results
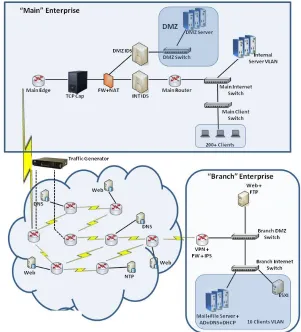
[image:18.612.158.459.264.596.2]As part of the British Telecom’s SATURN Research programme (Rowlingson et al., 2013), a cyber range experiment was carried out in 2012 by industrial partners (Winter, 2012). This experiment was used as a case study in evaluating ACSAnIA. The cyber range experiment models a simulated computer network which comprises of two sub-networks – a main network with approximately 200 workstation clients and a branch network comprising of 10 workstation clients. To model real network activities, the experiment utilised comprehensive scripts for simulating email sending, server activity and content download activities. Figure 6 shows the network architecture.
The cyber range experiment includes two simulated attacks on the modelled network. The alert logs generated from both the Delimitised Zone IDS and Internal IDS are analysed by ACSAnIA. (These are shown in Figure 6 as DMZ IDS and INT IDS).
During the experiments, ACSAnIA was deployed on a 64-bit Windows Sys-tem with an Intel(R)Core i5 CPU processor at 2.40GHz, JVM 1.4.2 and 6GB for maximum heap memory.
6.1. Attack 1 – Main Network DMZ
A web server in the DMZ zone of Figure 6 is attacked by an offsite attacker. The attack comprised of 4 phases – DMZ Scanning (Casual & Intense), vul-nerability assessment, exhaustive penetration and brute-force audit from the attacker on the web server. Normal network activity includes server activity such as email routing from a DMZ mail server to an internal mail server and network pinging between the DMZ mail and FTP servers.
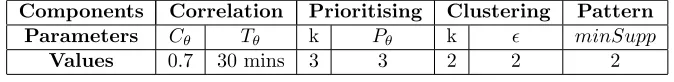
The following configurations were applied to the ACSAnIA system for analysing the intrusion logs from Attack 1.
Components Correlation Prioritising Clustering Pattern
Parameters Cθ Tθ k Pθ k minSupp
[image:19.612.137.474.343.384.2]Values 0.7 30 mins 3 3 2 2 2
Table 3: System Configurations for Experiment on Attack 1
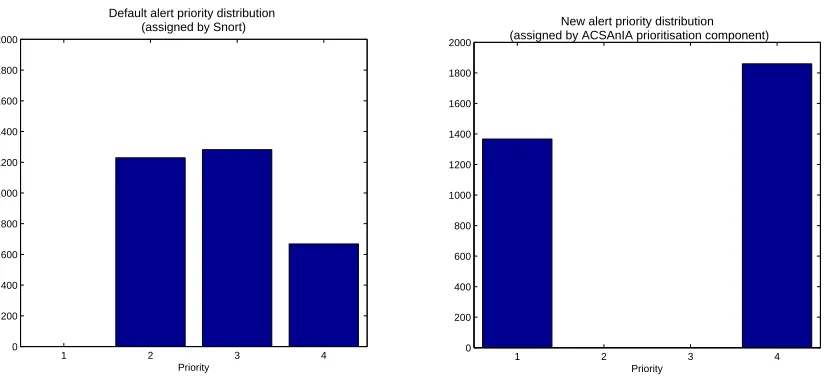
The Snort DMZ IDS (shown in Figure 6) captured 3225 alerts during the course of Attack 1. 649 alerts were false positives while 2577 were triggered as a result of the attack. Due to the low volume of alerts received, when ACSAnIA received the alerts for post processing, we allowed thecorrelation component to correlate alerts within a 30 minute time window. At the same time, in order to maintain high quality correlations, we set a correlation threshold of 0.7. The remaining parameters in Table 3 were set experimentally.
Our expected result was that the ACSAnIA prioritising component would filter out false positives and its clustering and attack pattern discovery compo-nents would aid in understanding the attack scenario.
6.1.1. Results
report alerts at Priority 4 and would achieve a TPR and FPR of 71% and 0.3% respectively.
1 2 3 4
0 200 400 600 800 1000 1200 1400 1600 1800 2000
Priority
[image:20.612.101.513.156.348.2]Default alert priority distribution (assigned by Snort)
Figure 7: Attack 1: Default priority assignment (before ACSAnIA)
1 2 3 4
0 200 400 600 800 1000 1200 1400 1600 1800 2000
Priority
[image:20.612.308.509.160.348.2]New alert priority distribution (assigned by ACSAnIA prioritisation component)
Figure 8: Attack 1: New Priority assignment (after ACSAnIA)
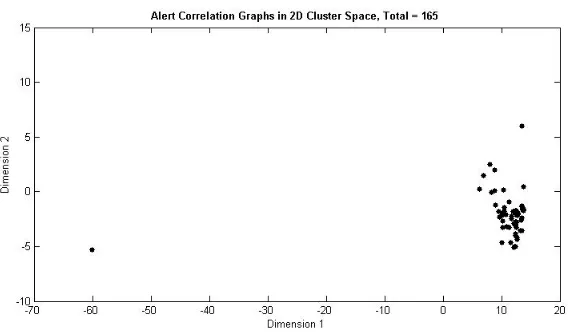
The Clustering component also successfully separates low level alerts (false positives) from high level alerts (true positives). Our correlation component generated 165 meta-alerts. In Figure 9, meta-alerts(alert correlaton graphs) within the cluster are common intrusion activity and therefore lower priority . The more unusual the intrusion activity, the further apart from the cluster and the higher the priority.To measure the quality of the cluster, the silhouette coefficient was applied and yielded 0.983. This implies good clustering.
The clustering analysis and attack pattern discovery reveals that most meta-alerts that form the dense area of the cluster in Figure 9 are smaller meta-meta-alerts which capture small network intrusions, particularly benign activity. These meta-alerts include intrusion alerts raised as a result of the simulated network activity such as network pinging and email routing. Some of the automated email content routed across the network contained suspicious but not necessarily malicious PDF content. The outliers to the clusters however represent larger meta-alerts. The majority of the meta-alerts contained intrusion alerts that capture intense network scanning and exploit activity on the web server.
6.2. Attack 2 – Main Network Internal
Figure 9: Clustering distribution of Attack 1 meta-alerts
1. Network scanning i.e. reconnaissance from the internal attacker to the main network
2. Failed exploit attempts on branch client workstations from internal at-tacker using shellcode embedded in email content
3. Successful exploit on internal vulnerable machine from internal attacker using shellcode embedded in email content
4. Gain of full control and admin access of vulnerable machine from offsite attacker
5. Offsite attacker uses vulnerable machine to explore internal network
[image:21.612.138.475.498.538.2]The system configurations for this scenario are altered to effectively analyse the sheer volume of alerts in this attack scenario in comparison to Attack 1. Table 4 shows the adjusted system configurations.
Components Correlation Prioritising Clustering Pattern
Parameters θ Tθ k Pθ k minSupp
Values 0.8 5 mins 12 2 48 2.4 5
Table 4: System Configurations for Experiment on Attack 1
correlations by using a strict correlation threshold 0.8. The remaining values were set experimentally.
6.2.1. Results
In Attack 2, both the Snort and ACSAnIA assignment of the alert priorities follow a similar pattern as Attack 1. Figure 10 shows that according to Snort’s priority assignment, it is observed that majority of the alerts are within medium priorities. This scenario is not as straight forward as Attack 1 i.e. not all inliers correspond to false positives and low priority. From Figure 11, It is observed that ACSAnIA regroups common intrusion activity into Priority 1 and Priority 2(low to medium priority) and still succesfully prioritises unusual activity as higher priority.
1 2 3 4
100
101 102
103 104
Priority
[image:22.612.103.284.281.465.2]Default alert priority distribution (assigned by Snort)
Figure 10: Attack 2: Default priority assignment (before ACSAnIA)
1 2 3 4
100
101 102
103
104
Priority New alert priority distribution (assigned by ACSAnIA prioritisation component)
Figure 11: Attack 2: New Priority assignment (after ACSAnIA)
[image:22.612.319.512.286.467.2]Figure 12: Clustering distribution of Attack 2 meta-alerts
6.2.2. Conclusion
A key observation in the results in both attack scenarios 1 & 2 is that ACSAnIA assigns higher priorities to the alerts which the previous Snort IDSs also prioritised highly. Hence, there is a consistency between both systems. This could be as a result of the following: in both scenarios, highly prioritised alerts have the least frequencies. In a scenario where the vast amount of alerts are supposed to be high priorities, ACSAnIA is unlikely to perform well. This is particularly because ACSAnIA strongly correlates unusual and infrequent activity with higher priorities.
In general, ACSAnIA significantly reduces the volume of alerts a Security Analyst needs to inspect first through correlating alerts into higher level abstract alerts called meta-alerts and then by filtering out low priority meta-alerts. Using the reporting system, a security analyst can explore the clusters and patterns of each meta-alert. Thus, ACSAnIA provides a platform for understanding attack patterns.
7. Summary
grouped into clusters. We evaluated the selected clustering parameters by using the silhouette coefficient which averaged to around 0.9 showing good clustering quality. To the author’s best knowledge, this research is the first to investi-gate and successfully carry out alert correlation graph based clustering using traditional clustering and distance metrics. Finally, we discussed how attack patterns can be extracted from alert correlation graphs. In future, we intend to perform more experiments on real-time attack pattern extraction.
The ACSAnIA System is currently being integrated into the British Tele-com’s Security Assure Analytics tool-kit for analysing Cyber security data.
8. FutureWork
The future work of this research mainly focusses on improving the clustering component to perform real-time clustering.
Our approach to prioritisation and clustering is based on batch analysis, i.e. at every set interval, a set of recent meta-alerts are extracted from the database and their prioritisation values are calculated. Consequently, they are clustered. In today’s computer networks where intrusion activity is highly dynamic, and data volumes are high a batch approach may not be feasible. To address this, real-time prioritisation and clustering methods are being investigated. In par-ticular we are investigating Incremental local outlier detection Pokrajac and Hartford (2007) and real-time graph clustering Aggarwal et al. (2010).
9. Acknowledgements
This work is being supported and funded by the British Telecommunications Security Future Practice Group, the Centre for Cyber Security Sciences(CCySS) at City University London and the Engineering and Physical Sciences Research Council (EPSRC).
Our appreciation also extends to Northrop Grumman who provided the cy-berange data for the experiment.
References
Aggarwal, C. C., Zhao, Y., Yu, P. S., 2010. On Clustering Graph Streams. Proceedings of the 2010 SIAM International Conference on Data Mining, 478–489.
Ahmadinejad, S. H., Jalili, S., 2009. Alert Correlation Using Correlation Proba-bility Estimation and Time Windows. 2009 International Conference on Com-puter Technology and Development (1), 170–175.
Alienvault, 2013. AlienVault Unified Security Management.
URLhttp://www.alienvault.com/solutions/siem-event-correlation
Alsubhi, K., Aib, I., Boutaba, R., 2012. FuzMet : a fuzzy-logic based alert prioritization engine for intrusion detection systems. International Journal of Network Management 22 (4), 263–284.
Alsubhi, K., Al-Shaer, E., Boutaba, R., 2008. Alert prioritization in Intrusion Detection Systems. NOMS 2008 - 2008 IEEE Network Operations and Man-agement Symposium, 33–40.
Benferhat, S., Boudjelida, A., Tabia, K., Drias, H., 2013. An intrusion detection and alert correlation approach based on revising probabilistic classifiers using expert knowledge. Applied intelligence 38 (4), 520–540.
Breunig, M. M., Kriegel, H.-p., Ng, R. T., Sander, J., 2000. LOF : Identifying Density-Based Local Outliers. Proceedings Of The 2000 Acm Sigmod Inter-national Conference On Management Of Data, 1–12.
C´edric Michel, L. M., 2001. Adele: An Attack Description Language For Knowledge-Based Intrusion Detection. Trusted Information, 353–368.
Chen, S., Leung, H., Dondo, M., May 2014. Characterization of computer net-work events through simultaneous feature selection and clustering of intrusion alerts. In: Braun, J. J. (Ed.), SPIE Sensing Technology + Applications. In-ternational Society for Optics and Photonics, p. 912107.
Cheung, S., Fong, M. W., Ave, R., Park, M., 2003. Modeling Multistep Cy-ber Attacks for Scenario Recognition. In DARPA Information Survivability Conference and Exposition (DISCEX III) (DISCEX III), 284–292.
Cuppens, F., Ortalo, R., Oct. 2000. LAMBDA: A Language to Model a Database for Detection of Attacks. Recent advances in intrusion detection. Springer Berlin Heidelberg, 197–216.
Dain, O., Cunningham, R. K., 2001. Fusing a Heterogeneous Alert Stream into Scenarios. In Proceedings of the 2001 ACM workshop on Data Mining for Security Applications, 1–13.
Debar, H., Wespi, A., 2001. Aggregation and Correlation of Intrusion-Detection Alerts. Recent Advances in Intrusion Detection., 85–103.
Ester, M., Kriegel, H.-p., Xu, X., Miinchen, D., 1996. A Density-Based Algo-rithm for Discovering Clusters in Large Spatial Databases with Noise. KDD 96.
Hofmann, A., Sick, B., 2011. Online Intrusion Alert Aggregation with Gener-ative Data Stream Modeling. IEEE TRANSACTIONS ON DEPENDABLE AND SECURE COMPUTING 8 (2), 282–294.
IBM Corporation, Dec. 2013. IBM Intelligent Operations Center - Demo - Soft-ware.
Khan, A., Yan, X., Wu, K.-L., 2010. Towards proximity pattern mining in large graphs. Proceedings of the 2010 international conference on Management of data - SIGMOD ’10, 867.
Lagzian, S., 2012. Frequent Item set mining-based Alert Correlation for Ex-tracting multi-stage Attack Scenarios. IEEE Telecommunications (IST), 2012 Sixth International Symposium, 1010–1014.
Marchetti, M., Colajanni, M., Manganiello, F., 2011. Identification of correlated network intrusion alerts Pseudo-Bayesian. Cyberspace Safety and Security (CSS), 2011 Third International Workshop on, 15–20.
Ning, P., Reeves, D. S., Cui, Y., 2001. Correlating Alerts Using Prerequisites of Intrusions. Tech. rep., North Carolina State University, Raleigh NC,.
Ning, P., Xu, D., 2003. Learning attack strategies from intrusion alerts. Proceed-ings of the 10th ACM conference on Computer and communication security - CCS ’03, 200.
Noel, S., Jajodia, S., 2007. Attack Graphs for Sensor Placement , Alert Priori-tization , and Attack Response. Cyberspace Research Workshop, 1–8.
Patel, H., 2009. Intrusion Alerts Analysis Using Attack Graphs and Clustering. Masters, San Jose State University.
Pokrajac, D., Hartford, E., 2007. Incremental Local Outlier Detection for Data Streams. Computational Intelligence and Data Mining, 2007. CIDM 2007. IEEE Symposium on (April).
Porras, P. A., Fong, M. W., Valdes, A., 2002. A Mission-Impact-Based Ap-proach to INFOSEC Alarm Correlation. Recent Advances in Intrusion Detec-tion (Springer Berlin Heidelberg), 95–114.
Qin, X., 2005. A Probabilistic-Based Framework for INFOSEC Alert Correla-tion. Ph.D. thesis, Georgia Institute of Technology.
Ren, H., Stakhanova, N., Ghorbani, A. A., 2010. An Online Adaptive Approach to Alert Correlation. Proceedings of the 7th international conference on De-tection of Intrusions and malware, and vulnerability assessment (DIMVA), 153–172.
Rowlingson, R., Healing, A., Shittu, R., Matthews, S. G., Ghanea-Hercock, R., 2013. Visual Analytics in the Cyber Security Operations Centre. Proceedings of The Information Systems Technology Panel Symposium on Visual Analyt-ics.
Salah, S., Maci´a-Fern´andez, G., D´ıaz-Verdejo, J. E., Jan. 2013. A model-based survey of alert correlation techniques. Computer Networks.
Shapiro, L. G., Haralick, R. M., May 1981. Structural descriptions and inexact matching. IEEE transactions on pattern analysis and machine intelligence 3 (5), 504–19.
Shittu, R., Healing, A., Ghanea-hercock, R., Bloomfield, R., 2014. OutMet : A New Metric for Prioritising Intrusion Alerts using Correlation and Outlier Analysis. 19th IEEE Conference on Local Computer Networks.
Steven Eckmann , G. V., 2002. STATL: An Attack Language for State-based Intrusion Detection. Journal of Computer Security 10 (1), 71–103.
Sundaramurthy, S. C., Zomlot, L., Ou, X., 2011. Practical IDS alert correla-tion in the face of dynamic threats. Internacorrela-tional Conference on Security and Management (SAM’11).
Tekhov, R., 2009. Graph Edit Distance Project. Tech. rep.
Valdes, A., Skinner, K., 2001. Probabilistic Alert Correlation. In Proceedings of the 4th International Symposium on Recent Advances in Intrusion Detection, 54–68.
Verizon, 2013. Data Breach Investigations Report.
URLhttp://www.verizonenterprise.com/DBIR/2013/
Winter, H., 2012. System security assessment using a cyber range. 7th IET International Conference on System Safety, incorporating the Cyber Security Conference 2012, 41–41.
Yan, X., 2002. gSpan: graph-based substructure pattern mining. 2002 IEEE International Conference on Data Mining, 2002. Proceedings. (d), 721–724.
Zali, Z., Hashemi, M. R., Saidi, H., Aug. 2013. Real-Time Intrusion Detection Alert Correlation and Attack Scenario Extraction Based on the Prerequisite-Consequence Approach.