City, University of London Institutional Repository
Citation
: Murphy, R. (2014). The Tax Gap. Tax Evasion in 2014 - and what can be done
about it. London: Public and Commercial Services Union.This is the published version of the paper.
This version of the publication may differ from the final published
version.
Permanent repository link:
http://openaccess.city.ac.uk/16565/Link to published version
:
Copyright and reuse:
City Research Online aims to make research
outputs of City, University of London available to a wider audience.
Copyright and Moral Rights remain with the author(s) and/or copyright
holders. URLs from City Research Online may be freely distributed and
linked to.
City Research Online: http://openaccess.city.ac.uk/ [email protected]
£119.4bn
The tax gap
Tax evasion in 2014 – and what can be done about it
Tax evasion in 2014
and what can
be done about it
A report by
Richard Murphy FCA
of
T
ax
R
esearch
Contents
1. Introduction 2. Summary
3. Putting the tax gap in context 13
4. Tax evasion – what it is 18
5. The shadow economy 20
6. Misrepresentation and carelessness 23
7. Criminality and fraud 25
8. Tax evasion and rental income 9. Investment income and tax evasion 10. UK capital gains and tax evasion 11. Tax evasion and inheritance tax 12. Offshore tax evasion
13. Summarising UK tax evasion 43
14. The rest of the tax gap: tax avoidance 46 15. The rest of the tax gap: tax debt 57 16. The tax gap: a summary
17. The HMRC resource crisis
18. The curse of political will 74
19. The need for new legisaltion 78
20. About the author 83
21. End notes 84
Published by and copyright PCS – the Public and Commercial Services Union 160 Falcon Road, London, SW11 2LN.
Published September 2014
Researched and written by Richard Murphy FCA,Director, Tax Research LLP
1. Introduction
This report investigates the scale of the UK tax gap, and tax evasion in particular, in the UK and what can be done about it.
The report suggests that the UK‟s tax gap may now be £122 billion a year. This is an increase from 2010 when PCS last commissioned Richard Murphy to estimate the tax gap. It was estimated at that time, that the loss each year was £95 billion with £25 billion of tax being owed at any time. It is now estimated that the annual loss has increased to a total of £122 billion a year.
The tax gap matters because at £122 billion a year the tax gap is only a little less than the annual budget for the NHS. It is also big enough to cover the entire UK education budget with more than £20 billion left over. That should make this issue one of the highest priorities on any politician‟s agenda. The troubling fact is that this does not appear to be the case at present.
The tax gap is the difference between the amount of tax that should be paid in the UK and the amount of tax that is actually paid. It is made up of tax avoided and evaded and of uncollected tax that is known to be owed but is either never paid or is paid late.
This report estimates that tax evasion might cost the UK £85 billion a year whilst tax avoidance might impose a cost of £19 billion a year and tax not paid could result in a loss of income of £18 billion a year.
In a time when all major UK political parties seem committed to austerity measures the size of the tax gap is a key variable in the equation that determines economic and social policy.
Put very simply, if the tax gap is small the government has more to spend. If it is big then governments think they must make choices about how to deal with budget deficits and we have seen in recent years that it is public services and ordinary people that suffer as a result of such decisions. The consequence is that for the very many people in the UK who are either dependent on the government for all or part of their income, or who are dependent upon government services, such as the NHS, for their well-being, the size of the tax gap can have a direct impact on the quality of their lives.
meantime whilst HMRC has been starved of ever more resources over the intervening years, costing thousands of PCS members their jobs whilst decimating the valuable service they supplied to the UK public.
Since 2008 PCS and its members have been at the forefront of the tax justice
campaign in the UK. We have done that in an attempt to preserve our members‟ jobs and to protect the services they supply. We have also done so to show that if only the tax gap was properly tackled we would have a very different economic outlook in the UK. The budget deficit, trumpeted as the need for austerity measures, cuts to
services, pay freezes and attacks on those in receipt of social security payments, would not be closed as a result of merely collecting the tax evaded in the UK economy but a large amount of money that could be invested in good quality public services would be “recovered” by the Treasury.
PCS has argued consistently since 2010 that there is no need for the austerity measures now crippling the UK economy and which are depriving so many of jobs, opportunity and hope as well as causing cuts in health and education. Our argument is as ideological as - but on the opposite side to - the government‟s and is that the tax gap is a crucial factor that should be at the centre of economic debate in the UK and which could transform our economic prospects if only it was properly addressed.
Richard Murphy, who wrote the attached report, also looks at the impact of staffing cuts in HMRC on the tax gap. In 2005 HMRC had 92,000 staff. By 2016 it is expected to have around 52,000. Across the UK HMRC has abandoned its local office structure and its face-to-face contact with the local communities it serves. Local knowledge has been lost and trust has been foregone as a result. In its place we now have call centres whose staff, through no fault of their own, have not had sufficient training for the jobs they are being asked to do whilst tax investigators now have one hand tied behinds their back at all times by the constraints placed upon them by a lack of resources. It is no wonder that the tax gap remains a persistent problem.
There is as a consequence a desperate need to invest in HMRC if the tax gap is to be tackled. Tackling that tax gap is vital if public services are to be preserved and if the UK is to get back to work. It is also important if the government is to support honest businesses and honest taxpayers and uphold the rule of law. This is an issue which in the run up to the 2015 General Election really needs to be in the voting public‟s mind. Think about it when people ask for your vote and remember when doing so that we are all enriched by good public services.
Mark Serwotka General Secretary
PCS – the Public and Commercial Services Union 160 Falcon Road
London SW11 2LN.
2. Summary
The government claims there is no alternative to the austerity agenda. Jobs
and pay are being cut, benefits slashed and public services closed; small
businesses are struggling to survive on our high streets. A simple part of the
solution is to close the tax gap, which involves two things: making those most
able pay their fair share of taxes and beating tax cheats.
In 2010 PCS published the most comprehensive calculation of the UK tax gap
undertaken at the time. The report by Tax Research UK estimated the tax gap
at £120 billion. This was made up of £70 billion in evaded tax, £25 billion in
avoided tax and £25 billion in tax paid late.
At the time the government criticised this figure as being far too high and
instead estimated a tax gap of £35 billion in 2011/12.
Campaigning by PCS, UK Uncut and others about the high profile tax
avoidance activities of companies such as Google, Starbucks and Amazon
along with celebrities like Jimmy Carr, Chris Moyles and Gary Barlow, have
pushed the issue into the media spotlight.
This pamphlet is a summary of a new report „Tax Justice UK‟ written for PCS. It
makes a new estimate of the tax gap, which continues to be significantly higher
than the HMRC estimate. This estimate, which is £119.4bn for financial year
2013/14, includes reductions in the estimates of tax avoidance and tax debt,
but a significant increase in the estimated tax loss from evasion.
It includes significant new data and a much more comprehensive analysis of
tax evasion. It shows that tax evasion is higher than previously estimated. It
concludes that the government should tighten up legislation and reverse the
counterproductive cuts in HM Revenue and Customs staffing.
Defining the tax gap
The tax gap is made up of three parts.
Tax debt – non-collection; tax that is not paid by someone who knows that
they owe it, but who doesn‟t pay, or delays payment.
Tax evasion
– tax lost when a person or company deliberately and
unlawfully fails to declare income that they know is taxable or claims
expenses that are not allowed.
Tax debt
The amount of debt outstanding has fallen in recent years, but the amount of
debt written off as irrecoverable or discharged by HMRC during each year is
growing. In 2013/14 estimate of tax debt is £18.2bn.
This figure is down on the £25bn of tax debt that was estimated in 2008. This
largely reflects a difference in the method of calculation we have now used that
makes the figure directly comparable with the data for tax avoidance and tax
evasion, which was not previously the case.
Tax avoidance
Total tax avoidance is estimated to be at least £19.1bn for 2013/14. The figure
is lower than the £25bn estimated in 2008, which reflects declining corporation
tax rates (which means the amount avoided also declines, automatically),
declining capital gains tax rates, and a likely decline in non-domicile activity as
a result of legislative changes as well as caution being made in other
estimates.
Tax evasion
The main area considered by the report is tax evasion. This work draws on
data to examine areas which the HMRC estimate of the tax gap does not
address. The report indicates that tax evasion is by far the largest of the three
tax gaps.
This report estimates that tax evasion costs the UK £73.4bn in 2011/12 (see
table 1) rising to £82.1bn in 2013/14 (see table 2).
There is more than one type of tax evasion. The following types of evasion are
considered in this report but are themselves not exclusive or complete. They
are, however, likely to cover the more common causes of the UK‟s tax gap
resulting from tax evasion:
Tax evasion in the shadow economy. The shadow economy represents
economic activities that are not recorded or declared to avoid
Tax lost as a result of other criminal or fraudulent activity in the UK
economy.
Capital Gains Tax and Inheritance Tax and offshore tax evasion.
Tax evasion on investment and rental income.
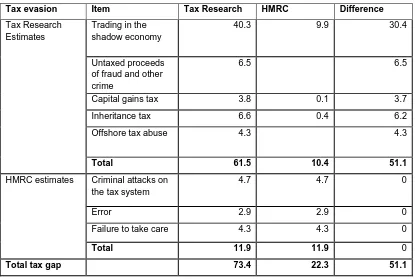
Each of these issues is considered in turn in this report. Table 1 below
identifies the Tax Research UK 2011/12 estimate. HMRC‟s estimate £22.3bn
1is also included and the difference.
Tax evasion Item Tax Research HMRC Difference
Tax Research Estimates
Trading in the shadow economy
40.3 9.9 30.4 Untaxed proceeds
of fraud and other crime
6.5 6.5 Capital gains tax 3.8 0.1 3.7 Inheritance tax 6.6 0.4 6.2 Offshore tax abuse 4.3 4.3
Total 61.5 10.4 51.1
HMRC estimates Criminal attacks on the tax system
4.7 4.7 0 Error 2.9 2.9 0 Failure to take care 4.3 4.3 0
Total 11.9 11.9 0
[image:10.595.89.504.214.493.2]Total tax gap 73.4 22.3 51.1
Table 1: Comparison between Tax Research UK and HMRC tax evasion
figures for financial year 2011/12.
Tax evasion in the shadow economy
The report by Tax Research UK refers to detailed earlier work that estimates
that up to 10% of all net sales income in the UK economy may not be recorded
for tax purposes. In 2011/12 this was likely to have represented £100bn of
unrecorded sales income. Based on this estimate, £40.3bn of unrecorded tax
of has gone unpaid in 2011/12.
The estimate of unrecorded income in the UK economy made by Tax
Research UK was based on VAT gap data published by both HMRC in
1
successive tax gap reports
2and by the European Union
3. The estimate
specifically excluded data on criminal attacks on the tax system and bad debt.
The resulting estimates of VAT lost and turnover of almost exactly 10% of the
likely sums owing, correlate with some authoritative estimates of the size of the
UK shadow economy
4.
Tax lost as a result of other criminal or fraudulent activity in the UK
economy
The report goes on to use data from The National Fraud Authority‟s „Annual
Fraud Indicator Report for 2013
5to estimate the tax loss. The estimate is
careful to consider only those areas where it is likely that a tax liability should
arise and to also exclude the possibility of double counting activity that might
have already been considered as part of the shadow economy.
The National Fraud Authority (NFA) estimated that fraud against the public
sector amounted to about £20.6bn in 2012. The total procurement and grant
frauds have been excluded as they may be covered by estimates of tax lost to
the shadow economy.
The estimate the NFA has made of fraud against the UK private sector is
approximately £15.9bn per annum.
In the financial services sector the NFA used Department for Business,
Innovation and Skills (BIS) data, which showed fraud at £5.4bn in 2012. The
NFA also identified £9.1bn of fraud against individuals.
The report removes a number of elements to avoid double counting and
identifies taxable income amounting to approximately £21.8bn in 2012. That
estimation would indicate that the tax loss arising in 2011/12 on this
unrecorded income is £6.5bn.
Capital gains, inheritance and offshore tax evasion
The report considers these areas in detail. It recognises that estimating the tax
gap in relation to capital gains, inheritance and off-shoring is difficult. However,
2
https://www.gov.uk/government/publications/measuring-tax-gaps
3
http://ec.europa.eu/taxation_customs/resources/documents/common/publications/studies/ vat-gap.pdf
4
F Schneider and C Williams (2013) The Shadow Economy, Institute of Economic Affairs, London.
5
an analysis of available data indicates that tax evasion is likely and significant.
The report uses available data to make tentative estimates of the tax gap
resulting from capital gains, inheritance and off-shoring.
The conclusion of a review of both share and property transactions is that the
estimated tax loss from capital gains tax was £3.8bn in 2011/12. A review of
inheritance tax indicates that £6.6 billion of additional inheritance tax might be
due annually as a result. It is estimated that offshore tax evasion could cost the
UK £4.3bn a year in lost tax revenue.
HMRC estimates
The HMRC official estimate
6, records three categories of tax loss which the
report has included as tax evasion:
Tax lost due to criminal attacks on the tax system, stated to amount to
£4.7bn in 2011/12
7;
£2.9bn lost to errors in that year;
£4.3bn lost to failure to take reasonable care.
Rental and investment income
Two further areas of income which the report indicates have the potential for
significant levels of tax evasion are rental and investment income. While the
report highlights the scale of potential for evasion, further work is necessary
before an estimate of tax loss can be made, especially if the risk of double
counting is to be avoided.
The tax gap over time
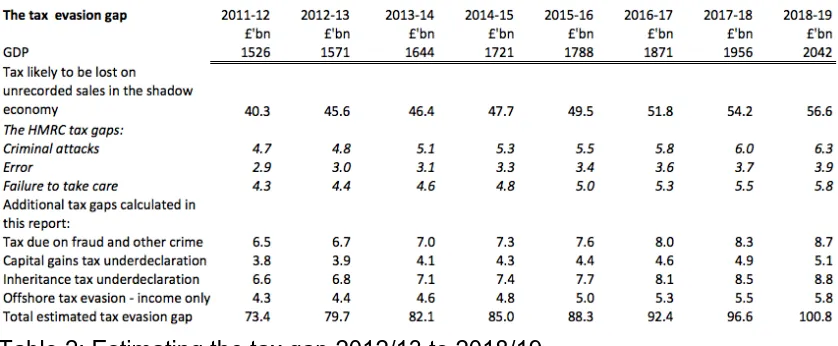
Table 2 below is an extrapolation base data for each on the basis of growth in
GDP based on the 2014 budget and forecasts to the rise in VAT in the autumn
statement 2013. The extrapolation shows that in 2013/14 the tax lost to
evasion was £82.1bn.
6HMRC, Measuring Tax Gaps 2013, tax gap estimates 2011/12, Official Statistics Release,
October 2013.
Table 2: Estimating the tax gap 2012/13 to 2018/19
So what can be done about the tax gap?
There is a great deal that can be done to tackle both tax avoidance and tax
evasion. The report suggests a number of measures that need to be taken:
The introduction of a proper anti-avoidance rule into UK tax law.
The introduction of country-by-country reporting for multinational
corporations.
Reform small business taxation to discourage avoidance and tackle tax
evasion.
Enforce proper regulation of companies in the UK to ensure that they file
their accounts and tax returns and pay the taxes that they owe.
Lastly, and most importantly, a reversal of the cuts to staff in HMRC and
at Companies House, taking on more staff at both to ensure that HMRC
can collect the taxes the country so badly needs.
Staffing cuts in HMRC
The 2014 Tax Research UK report looks in detail at the impact of staffing cuts
in HMRC on the tax gap. In 2005, HMRC had 92,000 staff. It has now less than
62,000 and by 2016 it is expected to have around 52,000 staff, a cut of almost
43% in just over a decade.
HMRC‟s own customer service surveys show it is not meeting taxpayers‟
expectations. One important way they do so is by not collecting tax from
everyone who owes it to create a level playing field in the UK economy.
Conclusion
While the government has argued that it is reducing the tax gap, the report
shows that the tax gap is as large as it was in 2008. While the effect of the
recession and a different method of calculating tax debt have reduced the
estimates of tax avoidance and debt in the report, the estimate of tax evasion
has significantly increased.
In any event the estimate of the tax gap in the Tax Research UK report
remains over three times higher than the official HMRC estimate.
Further resource cuts are planned by this government. The cuts planned and
implemented by this government will take public spending, as a proportion of
GDP, back to levels seen in the immediate post war period. This will mean
further cuts in welfare and vital public services. Reducing tax avoidance,
evasion and debt could significantly boost government income and so
undermine the Government‟s argument that there is no alternative to austerity.
As we approach the general election it is clear that there is a real appetite for
the issue of tax justice to be addressed. PCS has played a leading role in
drawing the tax gap to the public‟s attention and has helped create an
environment in which organisations like UK Uncut, and others have been able
to highlight the injustice that the tax gap causes.
Tackling the tax gap is an important element in an alternative to a programme
of austerity and cuts. We will never entirely close the tax gap but with the
political will to take serious steps to address the issue, the economic outlook
for the country could look very different indeed from that which we are told we
face at present.
Richard Murphy Director
Tax Research LLP
3. Putting the tax gap in context
It seems that to many people – and most especially to HM Revenue & Customs - that the tax gap is a technical issue, or maybe a management tool. It is, of course, both of those things, but it is also much more significant than either implies. In this chapter the link between the UK‟s tax gap and the state of the UK economy is explored. To truly appreciate the tax gap‟s significance it has to be understood that properly measuring and then effectively tackling the tax gap could transform the way we look at both the economy and the broader economic and political outlook for the UK.
Despite all the claims that have been made by a great many politicians, it was not government overspending that caused the financial crisis that engulfed the UK and much of the developed world in 2008. We know it was the failure of the banks that caused the economy to topple over in that year. What we also know is that a major reason for the debt crisis that led to bank failure was that banks had lent excessively to many who had limited ability to repay their debts. This was because real wages had not been growing in many economies for a long time and lending was making good the short fall. Wealth inequality grew significantly as a result.
That inequality meant by 2008 there was far too much money in the hands of a very wealthy minority in society who then lent it through the banks to ordinary people who could not make ends meet without recourse to loans. Many of those who were borrowers in 2008 have since then faced the blunt hard end of austerity in their lives. The banks, and as a result the wealthy who had money in them, were in the meantime bailed out by governments, including the UK‟s. Those, on the other hand, to whom banks lent money were left with falling wages, less to spend, the prospects of
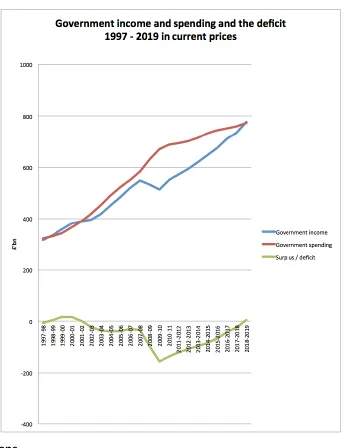
Figure one
Source: HM Treasury budget data up to Budget 2014
From 1997 to 2007 the UK economy had appeared to run well. That was one reason why Labour won three elections in a row. For several years the government actually spent less than it generated in tax revenue and debt was repaid. Then, in the
aftermath of the dot.com crash the government invested in the economy, and ran a deficit for a number of years that was almost exactly equivalent to the amount it invested in new schools, hospitals roads and similar capital items, as indicated by the blue line in Figure 1 running almost parallel, but slightly below, the red line. Despite everything that has been said about Labour‟s economic management and reckless borrowing this was an era when government finances looked to be under control.
revenues due for a variety of reasons including the programme of job cuts that Labour had already put in place by the time that the economic crisis erupted, and which they did not cancel even when it was clear that collecting every penny of tax due was a national priority.
[image:17.595.118.482.285.644.2]An enormous gap between income and spending opened up that the government has yet to fill, although it now predicts it will do so by 2019. This forecast should, however, be taken with a pinch of salt: since 2010 government projections have always seemed to suggest that it will balance its books about five years after the date on which the forecast has been made and so far they are a very long way from doing so.
Table 2 below gives clear indication of the scale of the borrowing that the financial crisis has given rise to:
Year Government income Government spending Net borrowing Cumulative borrowing
£'billion £'billion £'billion £'billion
1997-98 316 322 -7 -7
1998-99 336 331 5 -2
1999-00 359 344 15 13
2000-01 383 367 16 29
2001-02 390 390 0 30
2002-03 396 419 -23 7
2003-04 419 454 -35 -29
2004-05 451 491 -40 -68
2005-06 486 523 -38 -106
2006-07 520 550 -30 -136
2007-08 548 583 -35 -171
2008-09 534 630 -96 -267
2009-10 513 670 -157 -423
2010-11 551 688 -137 -560
2011-2012 573 694 -121 -681
2012-2013 593 702 -108 -789
2013-2014 620 716 -96 -885
2014-2015 648 732 -84 -969
2015-2016 675 743 -68 -1,037
2016-2017 711 753 -42 -1,079
2017-2018 734 759 -25 -1,104
2018-2019 778 773 5 -1,099
Total 11,533 12,632 -1,099
Figure 2
Source: HM Treasury budget data up to Budget 2014 Data highlighted in red represents forecasts
over four times the sum borrowed during the eleven-year period before the crisis erupted. In addition, the current government is suggesting that over the next five year period for which forecasts are now available that they will bring the state‟s books back into balance but they will still borrow another £214 billion before that is achieved, which is more than Labour did between 1997 and 2008 (although in fairness the data has not been adjusted for inflation).
Why does this all this data on deficits matter? It matters because when HMRC first published a tax gap estimate the tax gap they did so for 2007-08. HMRC said that in that year the tax gap was £42 billioniii. The budget deficit in that same year was £35 billion and it had not been more than £40 billion over the preceding years, as noted above. In other words, at that time, HMRC‟s own estimate of the tax gap suggested that if only the tax gap could have been effectively addressed over the previous eleven years, and had been of broadly similar amount each year, then it would have required less than half the tax gap to have been recovered to have ensured that the Labour government of that period would have entered the recession with no net borrowing having been incurred over the previous decade or so.
Alternatively, if the tax gap was actually £95 billion of combined tax avoidance and tax evasion at that time, as PCS suggested it to be in 2010, then the proportion of the tax gap that would have needed to be recovered to ensure that no net borrowing would have been incurred over that period to 2008 would have been much less. In all likelihood a recovery rate of less than one third of the total tax gap would have been needed (having allowed for inflation) to ensure that no net government borrowing would have been required from 1997 to 2008 inclusive if the PCS estimate of the tax gap was correct.
What is immediately clear as a result is that tackling the tax gap has the power to transform the economy and economic outlook of the UK. What is also obvious is that this thinking was not anywhere in the mainstream before 2009, which was the first year HMRC began publishing anything close to a comprehensive tax gap estimate, largely as a result of pressure from the trade union and tax justice movements.
There is a final point to be made on this issue at this point. This is that whilst the government says that austerity will close the government deficit, the evidence of its own data does not support this claim. For the last five budgets the Treasury has claimed that a balanced budget will happen in approximately five years time. The evidence is that this claim has been consistently wrong: the goal seems to move one year further away each time a forecast is made – remaining as a result at a seemingly fixed time in the future whilst in the meantime the deficit and the borrowing continue, as figures one and two show.
What this suggests is that austerity is not working as an economic policy, even if it is assumed that it is rational for that policy to aim for a balanced budget (which neither PCS nor the author of this report believe to be the case). So far no significant
4. Tax evasion – what it is
Tax evasion is the crime of not declaring income to a tax authority that has a right to know about it and the crime of claiming expenses for offset against a taxable income when knowing that those expenses should not be claimed for that purpose.
The word crime in both parts of that definition is important. The tax evader either knowingly breaks the law or does so with reckless disregard for the consequences. This means that tax evasion is different from tax avoidance, which is more often referred to in the mainstream press.
Tax avoidance is commonly undertaken by large businesses and high net worth individuals who can employ an army of accountants and lawyers to find loopholes in the laws and regulations of either one country, or a number of countries, to make sure that they do not pay tax whilst claiming that they were not breaking any law,
anywhere, whilst achieving that objective.
That same army of lawyers and accountants also provide these companies and people with their defence against a charge of tax evasion. If someone has an opinion from a lawyer that what they are doing is legal then it is virtually impossible to charge them with tax evasion; they are only tax avoiding in that case, however abusive the arrangement that they are using might be.
Tax evasion is, as a result, undertaken by people who do not use lawyers and
accountants to cover their tracks but who do instead knowingly have income that they do not properly declare to their tax authority, which in the UK means HMRC
The fact that all tax evasion has this characteristic in common does not mean there is only one type of tax evasion. The following types of evasion are considered in this report but are themselves not exclusive or complete. They are, however, likely to cover the more common causes of the UK‟s tax gap resulting from tax evasion:
1. Tax evasion in the shadow economy. The shadow economy represents economic activities that are not recorded or declared to avoid government regulation or taxation. Part is unrecorded wages and the rest is represented by undeclared business incomeiv;
2. Tax lost as a result of other criminal or fraudulent activity in the UK economy;
3. Misrepresentation and negligence on tax returns;
5. Offshore tax evasion.
Each of these issues is considered in turn in this report before the economic
consequences of the losses are estimated and ways of addressing the identified tax evasion are suggested.
5. The shadow economy– the biggest part of tax evasion
This report would have addressed the issue of the tax evasion in the UK‟s shadow economy but for the fact that in May 2014 Tax Research UK published an estimate of the tax lost to the UK economy as a result of that activityv. That research was funded by but was not undertaken for Oxfam GB and the Joseph Rowntree Charitable Trust: the findings were the sole responsibility of Tax Research UK.
What the research suggested was that up to 10% of all sales income in the UK economy as a whole may not be recorded for tax purposes. In 2011/12 this was likely to have represented £100 billion of unrecorded sales income. The figure will,
obviously, have increased by now and could, based on GDP growth, be as much as £112 billion a year.
Based on this estimate, unrecorded total tax of maybe £40 billion may have gone unpaid in 2011/12 and that tax loss could now be as high as £47 billion a year, having allowed for expected changes in the VAT gap since 2011/12. In this context it is important to note that the VAT gap is defined, like the tax gap, as the difference between the amount of VAT that should be paid in the UK ifthe law worked as parliament and HMRC think it should and the amount of VAT that is actually paid.
The estimate of unrecorded sales income in the UK economy made by Tax Research UK was based on VAT gap data published by both HMRC in successive tax gap reportsvi and by the European Unionvii. The estimate made, specifically excluded data on criminal attacks on the tax system and bad debt. The resulting estimates of VAT lost and turnover of almost exactly 10% of the likely sums owing, do, by coincidence, happen to almost exactly agree with some of the most widely quoted academic estimates of the size of the UK shadow economy. For example, Prof Friedrich Schneider of Johannes Kepler University of Linz, Austria and Prof Colin Williams of Sheffield University suggested in 2013 that the long-term data for the size of the shadow economy in the UK was as followsviii:
Year Size of UK shadow economy (%)
1997 13.0
1999 12.8
2001 12.6
2003 12.5
2005 12.4
2007 12.2
2009 10.9
2011 11.0
Average 12.0
Figure 3
Source, Schneider and Williams as referenced in text
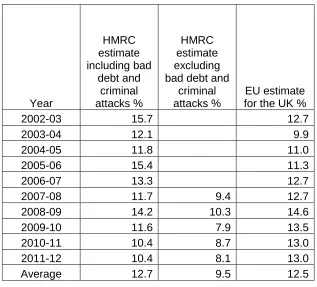
For comparison, the estimated UK VAT gap according to HMRC (using originally published data in each case as far as possible, based on tax gap reports, and stating numbers in later years before and after bad debt and criminal fraud) and the
equivalent data from the EU have been:
Year HMRC estimate including bad debt and criminal attacks % HMRC estimate excluding bad debt and
criminal attacks %
EU estimate for the UK %
2002-03 15.7 12.7
2003-04 12.1 9.9
2004-05 11.8 11.0
2005-06 15.4 11.3
2006-07 13.3 12.7
2007-08 11.7 9.4 12.7
2008-09 14.2 10.3 14.6
2009-10 11.6 7.9 13.5
2010-11 10.4 8.7 13.0
2011-12 10.4 8.1 13.0
[image:23.595.138.455.215.502.2]Average 12.7 9.5 12.5
Figure 4
Sources: HMRC tax gap data, author’s calculations and European Union as noted in text
These estimates and those by Schneider and Williams are made using very different methodologies: their convergence provides strong evidence that suggests the shadow economy is in the ranges indicated.
It will be noted that the EU estimate of the UK‟s VAT gap does not agree with HMRC‟s suggestion that this is falling in recent years. The Tax Research estimate used to estimate the tax lost to the UK averaged the HMRC and EU estimates of the UK VAT gap having allowed in both cases for likely bad debt and criminal attack costs. The resulting estimated loss remains below the Schneider and Williams estimate of the size of the UK shadow economy.
VAT and corporation tax lost even though the estimate is based on VAT gap data. That is because if sales income is not recorded it is, of course, not just the VAT that is lost as a result but all the other taxes that may also be due as a result of that income being earned.
The estimated rate of loss is higher than the average rate of tax due on UK GDP as a whole, which is just over 36% at present. This figure of 36% is estimated by
comparing UK government tax income from the sources that this tax gap is likely to have impact upon (VAT, income tax, national insurance and corporation tax in particular) with total GDP.
A higher rate than this for the purposes of tax loss estimation has been used for two reasons. The first is that in the case of unrecorded sales income the total tax lost is likely to be above the average tax rate. When the interaction of VAT, income tax and national insurance, in particular, is considered (and these are the most likely taxes not paid as a result of unrecorded sales income because such income is put in the pocket of the individual pockets of the self employed and company directors and so will rarely be subject to corporation tax but will instead be subject to personal taxation rates) then in practice combined charges will usually exceed 40%. In fact, up to 20% VAT and then income tax charged at a rate of at least 20% on the remaining net income plus national insurance at a potential combined rate of up to 25.8% can very easily exceed such a rate in combination and may in fact exceed 50% of unrecorded sales income, making this 40% estimate of loss on the low side, if anything.
Secondly, this estimate of a loss of 40% is used because the unrecorded income in question is likely to be the top part of the income of those who are evading and because evidence shows that tax evasion is by no means the preserve of those on very low income in this country. Indeed, there is evidence that the shadow economy increases inequality in the UKix and that must mean those on higher income must benefit most. The estimate of tax lost is, therefore, based on that suggestion.
6. Misrepresentation and carelessness in tax return
reporting – data from HMRC‟s tax gap reports
This report builds in part on research by Tax Research UK referred to in the preceding chapter. When undertaking that research Tax Research UK specifically assumed that three categories of tax loss, identified by HMRC as part of the tax gap, did not relate directly to the tax loss from the shadow economy. These three categories of loss identified by HMRC and not accounted for by Tax Research UK were:
1. Tax lost due to criminal attacks on the tax system, stated to amount to £4.7 billion in 2011/12x;
2. £2.9 billion lost to errors in that year;
3. £4.3 billion lost to failure to take reasonable care.
Tax lost to criminal attacks was specifically excluded from the extrapolations used to estimate sales lost on unrecorded turnover in Tax Research UK‟s work and as such can be specifically considered to be part of the tax gap to be included in this report. HMRC‟s work on this issue is being accepted at face value on this issue and no further adjustment is being made. Much, but not all, of the loss will arise from VAT missing trader fraud.
Neither is any adjustment needed to the figures supplied by HMRC for tax lost as a result of errors and failure to take reasonable care in the preparation of tax returns. These errors do not relate to the activities underlying the returns themselves, and so cannot be included in the tax lost due to unrecorded sales income. They do instead relate to errors with the tax return itself. As such this sum is also considered to be part of the additional tax gap suggested to arise by this report for three reasons.
Firstly, we must presume that these errors are not tax avoidance activity or HMRC should have said so, and it has not. We must therefore presume them to be considered to be evasion by HMRC.
Second, errors are defined by HMRC in their tax gap report to be the result of
mistakes made in preparing tax calculations, completing returns or in supplying other relevant information, despite the HMRC customer (sic) taking reasonable care. This is therefore a loss clearly not covered by the other estimates of tax evasion included in this report.
Thirdly, HMRC define failure to take reasonable care in the 2013 tax gap report as „being the result of customers‟ (sic) carelessness and/or negligence in adequately recording their transactions and/or in preparing their tax returns‟. Again, this is clearly very different from deliberately suppressing data on sales and is most likely to relate to another key part of tax evasion, and which is the focus of a great many tax
economy and so can, once again, be included as part of the tax evasion gap under consideration in this report.
7. Criminality, fraud and tax evasion
The National Fraud Authority Annual Fraud Indicator report for 2013xi provides very clear data on a wide range of non-trading illicit activity in the UK. The report benefits from considerable research, a clear indication of confidence factors relating to each type of fraud identified and unambiguous estimates. It does, therefore, provide a reference point for a major source of illicit income in the UK. That income, whether illicit or not, should be taxed in many cases. The estimate that follows is careful to consider only those areas where it is likely that a tax liability should arise and to also exclude the possibility of double counting activity that might have already been considered as part of the shadow economy.
The National Fraud Authority (NFA) estimated that fraud against the public sector amounted to about £20.6 billion in 2012. Of this it was estimated that central government might be losing £2.6 billion and local government £2.1 billion to fraud, with a further £14.1 billion lost to tax fraud and vehicle excise fraud, and £1.9 billion to benefit and tax credit fraud.
Clearly tax fraud cannot be counted twice and so the estimate of fraud in the public sector amounts to £6.5 billion for the purpose of this report, all of which could, and almost certainly should, be considered the taxable income of those undertaking the activity. Care has, however, to be taken to avoid double counting what might be considered business income already in the estimate of the shadow economy.
In this regard, benefit fraud is clearly not undertaken in the course of a business. It is plausible, however, that some of the fraud against central and local government could be undertaken in the shadow economy. The total procurement and grant frauds identified by the National Fraud Authority have been excluded from consideration here for this reason as they may already be covered by estimates of tax lost to the shadow economy. They amount to £2.8 billion. The remaining fraud of £3.7 billion is
considered likely to be income not already considered to be in the shadow economy on which tax might be evaded.
double counting. The remaining part of private sector fraud considered to contribute to the tax gap is, therefore, £12.6 billion.
For the financial services sector the NFA has used Department for Business,
Innovation and Skills (BIS) data for fraud relating to financial and insurance activities. The resulting combined estimate of fraud in this sector came to £5.4 billion in 2012. None of this appears to relate to matters likely to have already been included in estimates for the shadow economy.
The NFA also identified £147 million of fraud against charities in 2012 and, more importantly, £9.1 billion of fraud against individuals. They suggested these frauds embrace „mass-marketing fraud, identity fraud, online ticket fraud, private rental property fraud and electricity prepayment meter scams‟. Whilst the figure for fraud against charities is highly unlikely to have been undertaken within the UK shadow economy the same cannot be said for the frauds perpetrated against individuals in the UK. Many of these may be undertaken by companies operating within the shadow economy. As such to avoid double counting this estimated loss has not been
considered to contribute to the tax gap under the current heading to prevent the risk of double counting.
In combination these frauds that are relevant for the purpose of consideration here and which would, if recorded, represent taxable income in the hands of those perpetrating them, would amount to approximately £21.8 billion in 2012.
The tax due on this sum would not be as high as that due on trading income for two reasons. The first is that VAT is very unlikely to be due on it. The second is that if it is not treated as trading income nor is it likely that national insurance will be due. This therefore suggests that a somewhat lower rate of loss should be assumed for this category of tax evasion than is used or other activity in the shadow economy and as such a rate of loss of about 30% is presumed appropriate in this case, which is lower than the overall tax rate due in the UK noted previously. This loss does then primarily reflect missing income tax due. That would suggest that the tax loss arising in 2012 on this unrecorded income might be £6.5 billion.
8. Tax evasion and UK rental income
Undeclared rental income is part of the UK shadow economy referred to in chapter 4 of this report. That has to be the case because VAT could be charged on rents but by government choice that does not happen. This does mean that undeclared rents are included in the £100 billion of unrecorded sales income likely to have arisen in the UK economy in 2011/12 to which that previous Tax Research UK research refers. That does not however, mean that this is not an area of interest when considering the causes of the UK tax gap and what might be done to address that issue.
Estimating the tax lost as a result of undeclared rental income in the UK is not a straightforward task for a number of reasons. First of all, parliamentary questions on this issue have revealed how limited the data on those with rental income held by HMRC really is. For example, when asked about overseas landlords and their tax compliance by Jeremy Corbyn MP in April 2014 the response from The Exchequer secretary, David Gauke MP, was to the vast majority of questions that „The data requested … could be obtained only at a disproportionate cost‟xiii. As further evidence
of this lack of data, a request under the Freedom of Information Act by a person unrelated to Tax Research UK or PCS in April 2014 asked the following question
Could you please provide the number of people who have declared rental income from residential property over the past 5 years, broken down by year. And if possible, could you include a total figure for the number of properties as well?
The response was that the total number of properties let out was not known because some tax returns did not require provision of this information; some individuals did not submit tax returns for rental income as that income was collected through the PAYE system (although how data was secured to achieve that goal is hard to imagine) and HMRC also had no idea which properties were let commercially and which were for habitation. They also had no idea how many people might be using the „rent a room‟ relief scheme. The obvious conclusion from this Freedom of Information response is that HMRC do not have sufficient data to form a reliable view of whether they are, or are not, collecting the tax due on properties let in the UK because they have no idea from the data they collect whether or not they are likely to have a complete population of properties covered by the tax returns submitted to them.
This then makes this sector worthy of some attention to assess how much tax might be under-collected by HMRC as an example of a sector where better data would clearly help recovery of tax owing.
HMRC estimated that the tax lost as a result of unrecorded letting income was £550 million in 2010/11xiv.
2011-12xv. Evidence that there may as a result be undeclared rental income arising comes from the FoI response previously referred to in this section. HMRC suggested in that response that they knew of the addresses of 3,426,000 commercial and
residential properties let during that year and that 134,000 other tax returns referred to rental income but they had no idea how many addresses might be involved. As they were simplified returns it may be assumed that the income in question was of limited amount and that the number of properties may be broadly equivalent to the number of returns made.
How many of these declarations relating to letting were of commercial property appears not to be known by HMRC. It is curious though that Rightmove suggest in May 2014 that they have 40,000 commercial properties to let on their booksxvi and at the same time over 300,000 domestic properties to letxvii. Whilst it is undoubtedly true that buy-to-let housing is more attractive to many people than letting commercial property, it is quite untrue that individuals do not let commercial property. Using this, admittedly, basic (but probably quite comprehensive, given the significance of the Rightmove website in the UK property market) data the total number of commercial properties to let is about 12% of the total market. If one quarter of those were let by individuals (although by value the proportion is likely to be much lower) then perhaps 115,000 commercial properties are let by individuals in the UK. Overall this would then suggest that, based on the data noted in the previous paragraph, rental income on maybe 400,000 properties a year is not being declared to HM Revenue & Customs. That number is likely to be rising given the significant growth in this sector.
In 2011-12 the average rent on a UK domestic property was £674 a monthxviii. This would imply that the total value of rents in that year, using the figure of 3,843,000 let properties reported to parliament, was just over £31 billion. The amount of undeclared rental income might also amount, on that basis, to £3.2 billion. The figure is, by
chance, a little over 10% of the total apparent income for the sector and so remarkably similar to the overall rate of loss noted for the shadow economy as a whole.
9. UK investment income
A source of income to UK taxpayers that is unlikely, at least at first glance, to be included in the estimate made of tax lost to the UK shadow economy is that arising on UK investment income.
It may surprise many people that income from property, after the offset of expenses, is much smaller, for example, than income arising from dividends in the UK. In 2011– 12, which is the latest tax year for which data is available at the time of preparation of this report, the three main classes of investment income were summarised by HMRC as followsxix:
Type of income Number declaring the source of
income
Total amount declared
Mean declaration
Income from property
1,510,000 £12.1 bn £7,970
Interest income 22,700,000 £7.4 bn £325 Dividend income 4,530,000 £42.5 bn £9,380 Other investment
income
1,110,000 £3.9 £3,600
[image:32.595.89.511.298.449.2]Total (per HMRC) 24,500,000 £65.9 bn £2,690
Figure 5
Source: HMRC, as noted
Investment income is dominated by dividends but the number declaring such income is surprisingly low. According to HMRC‟s wealth statisticsxx (which are now,
admittedly, becoming dated with the latest available only covering 2008 to 2010) 5,123,000 people were likely to own shares in 2010 with those shares having a combined value of £469 billion. Despite this only 4.5 million declared income from dividends in 2011-12 according to HMRC. In contrast, HMRC wealth statistics suggested only 13.4 million people had significant holdings of cash and yet 22.7 million declared interest income, suggesting they had at least some cash savings. Property data is not available for comparison.
The data with regard to shares is more interesting. The simple disparity in data between the two sources does in the first instance suggest that maybe 600,000 people may not be declaring dividend income for tax purposes.
Secondly, the rate of income declared by those including dividend income on their tax returns compared to asset value is very high. It reflects an apparent rate of 9% per annum. The overall rate of return expected on the London Stock Exchange has, however, in recent years averaged around 3 per cent per annum. What this then suggests is that a significant part, that may be as high as approximately £28 billion, of the dividends declared on tax returns are not the result of returns on quoted
investments but are likely to represent dividends paid in lieu of salaries by the director/shareholders of small privately owned companies. Those companies do, however, have little or no value attributed to them for estate valuation purposes, firstly because they usually have no such worth by the time of the death of their owner because they have retired by then; secondly because the worth is actually all tied up with the goodwill that actually attaches to the owner and this disappears on death and thirdly because these shares are usually subject to inheritance tax exemptions
meaning that this tax is not paid on them.
There are a number of other issues to draw out though. 600,000 missing shareholders happens to match in number the highest estimate made by Tax Research UK of the number of shadow companies likely to be operating in the UK economy, although a more cautious 400,000 total was adopted for final estimation purposes in their May 2014 report on the shadow economy. It is possible that these numbers may overlap. In that case if 600,000 people are under-declaring income this would suggest at least £5.6 billion of undeclared dividends on tax returns. Any resulting tax is, however, likely to already be included in Tax Research UK‟s estimate of tax lost to the shadow
10. UK capital gains
Separate tax gap data was not published for capital gains tax in 2013: the loss is aggregated with that for income tax and national insurance. This may reflect the fact that UK capital gains tax payments are small at just £3.9 billion in 2012-13, which is the last year for which confirmed data is available. The yield is, however, forecast to increase dramatically, with the budget for 2014 suggesting a yield of £9 billion might be received by 2018-19xxi. In 2012 the tax gap loss was stated to be £130 millionxxii.
It is hard to see on what basis such an optimistic forecast of future yield (or of past loss, come to that) is based. HMRC‟s capital gains statistics are, like much HMRC data, only available up to 2012-13 at the time of writing, in which year just 146,000 people declared gainsxxiii. The total number of people declaring gains has never exceeded 250,000 in a year, which was in tax year 2007-08. Trusts declaring gains added modest numbers to the totals in each year.
When compared with the 4.5 million people declaring dividend income and 5.1 million people believed to own shares in the UK according to HMRC wealth statistics, both noted in the previous section, the numbers declaring capital gains seem incredibly small, especially given the estimated £469 billion worth of share holdings within UK estates according to HMRCxxiv and the 3.8 million rental properties in the UK, all of which are owned, at least in part, to secure capital gains.
In April 2014 the UK stock market was worth £2,227 billionxxv. HMRC‟s wealth data, whilst out of date, suggests that UK individuals own shares representing more than 20% of this exchange by value (although some shares they held may not have been quoted, of course and some quoted investments may be held elsewhere, but without that fact having significant likely impact on the estimates that follow). Trading data from the same exchangexxvi suggests that in April 2014 there were about 8.5 million trades in FTSE 100 shares that month. That means there are likely to be about 100 million trades a year. It is not for a moment suggested that 20% of these trades were by UK individuals; the vast majority were, of course, by professional traders. However, given that volume of trading and the fact that, as already noted, a significant
proportion of the FTSE 100 is owned by UK resident individuals, it is very hard to believe that fewer than 200,000 UK individuals really made capital gains requiring declaration to HMRC in a single tax year.
21% may be owned for buy-to-let purposes and in that case maybe 196,000 of the property transactions in 2012 might have related to properties owned for buy to let purposes and yet in 2009-10, the last year for which data is available, just 52,000 residential property sales were reported for capital gains tax purposes.
This was, admittedly, a period of fluctuating fortunes in the property market but property gains need to be reported whether or not a profit arises: indeed, there is an incentive to declare losses as they can be used for offset against other gains.
The inevitable conclusion of this review of both share and property transactions is that capital gains tax is a tax where under-declaration of transactions and resulting tax liabilities is likely to be rife. It is entirely reasonable to believe, based on this evidence, that at most 50 per cent of the transactions resulting in a capital gain requiring
11. Tax evasion and Inheritance tax
Inheritance tax is the only tax that we have in the UK that approximates to a wealth tax. With the exception of some special charges on trusts it can only be charged on death or gifts in the period before death. According to HMRC‟s latest statistics on the issue, to which most of the data in this section refersxxix, inheritance tax declarations are required from only just over half of all the estates of those who die in the UK each year; the other estates being either too small for a declaration to be required (this happening when they are worth less than £5,000) or because the entire property moves to a surviving spouse, in which case no declaration is needed. Of those 260,000 or so estates where declaration was required in 2010-11 tax was only due in a very small number of cases. Just 3% of all estates – or about 16,000 estates, paid inheritance tax in that year.
There are good reasons for this very low rate of payment. Firstly, the inheritance tax allowance permits £325,000 worth of assets to be given away on death or in the seven years preceding it without any tax charge arising.
Secondly, all gifts that a person can make out of their income which do not impact upon their lifestyle are, by definition, tax-free for inheritance tax purposes because they are not made out of their accumulated wealth, which is what this tax is
supposedly charged on. This, very obviously, has enormous value to the very wealthy who enjoy large incomes as they can give very large sums away using this loophole.
In addition there are a large number of exemptions and reliefs for inheritance tax which means that the vast majority of small businesses, farms, timber, and even investment in some shares on the London Stock Exchange are all likely to fall outside the scope of the tax.
And then there is the domicile rule, which means that the estates of those not domiciled or deemed to be domiciled in the UK for the purposes of this tax do, to the extent that they are located outside the UK, fall outside the scope of inheritance tax. This is another enormous loophole in this tax, aided and abetted by the fact that it is easy for non-domiciled people to set up offshore tax arrangements to hide the
ownership of their assets and that they do not have to declare their offshore income to HMRC on their tax returns, giving no clue, therefore, as to whether or not such assets exist.
a. It is relatively easy to hide the ownership of many assets, including companies and even homes. Fraud with regard to ownership is incredibly easy to arrange and relatively hard to detect, especially given the lack of resources in HMRC to undertake this activity. The UK government has acknowledged this by deciding that disclosure of the beneficial ownership of companies is now a priority issue if fraud is to be prevented.
b. Gifts made in the seven years before death are all potentially chargeable to inheritance tax but are, again, very hard to detect unless those in receipt of them are honest at the time of death, and it is likely that many will not be inclined to be so. Once more, a lack of resources at HMRC aids those committing this fraud to get away with their crime (for that is what it is).
c. Valuation of assets is often subjective and open to misreporting, by no means all of which will be detected, especially when HMRC is under-resourced.
For all these reasons it has been widely assumed that inheritance tax is open to abuse, but estimating the scale of evasion has been difficult. HMRC put it at just £0.4 billion in their 2013 tax gap reportxxx, which is still significant when inheritance tax paid in the year to which that relates (2011/12) was only £2.9 bnxxxi.
The publication of new wealth data by the Office for National Statistics (ONS) in May 2014 has helped overcome this estimation problem to some degree. It provides information in four categories, being financial assets, property assets, personal property (in other words, individual‟s possessions) and pension assetsxxxii. The last
can be ignored for inheritance tax purposes; by definition they usually cease to have value on death and cannot normally be subject to an inheritance tax charge as a result.
Data for all these categories is available from the ONS for 2008 to 2010, which happens to be the period for which HM Revenue & Customs has most recently published data on what it estimates total personal wealth to be. These HMRC
estimates are based on declarations made in estates subject to inheritance tax (but for which purpose they also give consideration to those estates that do not need to be declared for the purposes of that tax)xxxiii. The comparisons are surprising:
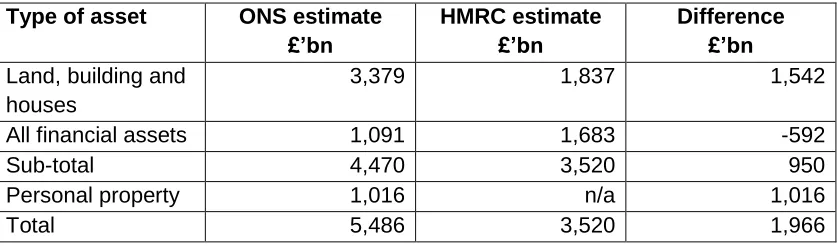
Type of asset ONS estimate
£’bn
HMRC estimate £’bn
Difference £’bn Land, building and
houses
3,379 1,837 1,542
All financial assets 1,091 1,683 -592
Sub-total 4,470 3,520 950
Personal property 1,016 n/a 1,016
[image:37.595.93.512.595.718.2]Total 5,486 3,520 1,966
Figure 6
Considering just land, buildings, houses and financial assets the ONS thought that UK personal wealth was £950 billion greater than that estimated by HMRC. It is stressed that all assets are stated net of associated liabilities, so the value of land and buildings is net of mortgages and financial assets are stated net of non-property related loans.
Perversely, HMRC does not provide an estimate for the value of personal assets included in estates. It is not clear why: very clearly the value is significant.
HMRC do, on the other hand, admit that the value of some property moving through estates may be omitted by them, either because it is exempt for the purposes of the tax (for reasons noted above) or because it passes straight to spouses. However, the latter should not distort issues significantly: spouses also die in due course and then the whole estate should be valued. Overall this should balance out in HMRC‟s estimates.
What is clear is that, however viewed, the difference between these estimates is significant. To be cautious, it is unwise to assume that all the difference between these sums represents value on which inheritance tax might be evaded. That said, if the ONS estimates are right then there are three significant issues to initially consider. The first is to consider what part of the total gap may be taxable. Second, how much of that difference may become liable to inheritance tax each year has to be
considered, because very clearly not all will and thirdly, the rate of tax that might be due is a matter of concern.
There is no way of knowing for sure what proportion of the total gap between these two valuations may be liable to inheritance tax. It is only appropriate to be candid about that. What is certain is that some is not, but not always for the reasons that many might suggest. For example, this valuation difference is not because of the domicile rule: it is unlikely that the non-UK based assets of non-domiciled people will be included in either of these estimates, and so they can be ignored for this purpose.
It is also very clear that some domestic property will not be in HMRC‟s estimate because this is one of the easiest assets that can be passed on a first death in a relationship between spouses, but it would seem very unlikely that this is the whole explanation in the estimation differences: these properties are likely to eventually pass on death and so should for that reason be included in the HMRC estimate.
Part of this difference must therefore be because assets are being transferred in ways intended to evade and not just avoid inheritance tax whilst valuation
under-declarations may also be an issue with regard to these properties. There may also be differing methods of allocating loan liabilities between the two estimates: this is one of the most likely reasons for some of the stark differences noted. For that reason
In that case estimates have to be made based on a valuation difference relating to assets that might potentially be subject to inheritance tax of almost £2 trillion
(£2,000,000,000,000, which is a sum bigger than the total annual income of the UK). Such estimates have, inevitably, to be more akin to the application of rules of thumb than to be precise, formulaic allocations. So, for example, HMRC say that half of all estates are not subject to inheritance tax. In that case, whilst it seems likely that the new and additional top part of wealth that the ONS would appear to have revealed would be subject to inheritance tax for reasons of caution alone it may be appropriate to presume that half of that additional sum might not be subject to that tax even if this is contrary to apparent logic.
Even when this logic is applied, for the reasons also noted above, there will be assets that will fall out of the scope of inheritance tax because of its generous exemptions. Again, it is not possible to provide a precise answer to how much might be involved and so another rule of thumb has to be applied. In the absence of detailed data another 50% reduction (of the already reduced sum, or 25% of the whole) is assumed appropriate for this purpose in this report. This is likely to be fair: HMRC say all
exemptions of this sort reduced tax bills by £1.3 billion in 2013/14xxxiv, when £3.5 billion in tax was paid.
Even after these two „discounts‟ on the gap between the ONS and HMRC wealth estimates there remain almost £500 billion of assets that may not be included in inheritance tax declarations on which that tax may be due. That value would not, of course, all fall to be taxed in one year. Estates largely pass on death. Two obvious points need to be noted on this. The first is that most people die in older age and secondly that most wealth is owned by older people, As the ONS has noted, the highest average wealth is held by couple households without children, where one person is over and the other under the state pension age and the next highest was for couple households where both adults were over the state pension age with no
childrenxxxv.
In that case it has been assumed that at least one thirtieth of the annual stock of the remaining difference in value (or about £500 billion) might become subject to
inheritance tax a year at a rate of 40%. That means £6.6 billion of additional inheritance tax might be due annually as a result. This sum has been added to the estimates for the tax gap in this report.
12. Offshore tax evasion
The problem of offshore tax evasion has been a recurring theme for those
campaigning for tax justice. It is a cause of much dispute as a consequence of those who use and abuse tax havens and offshore accounts having fought back against allegations made against them, saying all they do in these places is legal.
Unfortunately they have not been willing to open their tax haven books to prove that point.
The vast majority of the estimates of the tax lost to tax haven abuse now available have arisen as a result of the work of NGOs and civil society organisations, many of them based in the UK. The Tax Justice Network is one of these organisations and its 2012 report „The Price of Offshore Revisited‟xxxvi is a comprehensive report with a
broad evidence base. It has been used as the basis for estimates of tax lost to offshore tax evasion in this report. This Tax Justice Network report has been widely reported worldwide and has been cited many times, although not everyone (and most especially those offshore) agrees with itxxxvii despite the fact that it uses four different bases for estimating the data it reports, including data supplied by the major banks who dominate the offshore wealth management market.
It should be noted that using this third party data on tax lost to offshore activity is appropriate because, as the IMF said when it appraised HMRC‟s tax gap methodology in 2013xxxviii, the HMRC estimate of the tax gap was most likely to omit foreign sources of income that individuals enjoy, such as that from tax havens. Evidence of this
oversight on HMRC‟s part is readily available: the words „offshore and „tax haven‟ cannot be found in HMRC‟s 2013 tax gap reportxxxix.
The Tax Justice Network report suggests that there was a minimum of US$21 trillion illicitly held offshore in 2010. The number may have been as high as $32 trillion, but the lower figure is used here for the sake of caution. It is stressed that this is not the total sum held offshore; it is the part likely to be held offshore for the purposes of evading tax liabilities.
For the sake of the estimate of tax lost to the UK resulting from this estimate of hidden offshore wealth a number of assumptions have to be made. The first is that this stock of wealth resulted in income that should have been subject to tax earned at the rate of 3 per cent per annum. This is very cautious. The current dividend yield on the FTSE 100 is, for example, 3.26 per centxl. This rate of return also ignores all capital
the rate of £1 being equivalent to US$1.58 (which is fair over the entire period under reviewxlii) this would amount to £399 billion a year.
It is then assumed for UK estimation purposes that tax would only be due at 20% on this sum. This is because it is possible that these assets may, if they had been held in this country, have been sheltered in UK companies instead of being held in the names of individuals. The potential worldwide tax lost is, on that basis, when rounded to the nearest billion, £80 billion a year.
To then work out what part of this might actually be lost to the UK an estimate of the proportion of likely world wealth owned by UK resident people is required. This is complicated by the fact that some of the wealthy living in the UK are not domiciled in this country and so do not pay tax on their worldwide income in the UK (which is an undoubted part of the attraction to them for living here). As such reports that the UK has more billionaires living here than anywhere else have to be dismissed for this purposexliii. Instead data from an organisation called WealthInsightxliv, quoted in the Guardian newspaper in 2013xlv, has been used instead because it considers the distribution of US dollar millionaires, which is a wealth level where the domicile rule is likely to have a much lower impact on tax liabilities. This source suggested the
following distribution of US dollar millionaires in 2012:
Rank Country
Number of Millionaires
1 US 5,231,000
2 Japan 2,105,000 3 Germany 1,326,000 4 China 1,280,000
5 UK 675,000
6 France 555,000
7 Canada 422,000
8 Switzerland 298,000 9 Australia 275,000
10 Italy 259,000
[image:41.595.193.430.375.587.2]Total 12,426,000
Figure 7
Source: WealthInsight, as noted