Micro-Doppler Based In-Home Aided and
Unaided Walking Recognition with Multiple
Radar and Sonar Systems
Sevgi Z. Gurbuz, Carmine Clemente, Alessio Balleri, and John J. Soraghan
Abstract
The potential for using micro-Doppler signatures as a basis for distinguishing between aided and unaided gaits is considered in this paper for the purpose of characterizing normal elderly gait and assessment of patient recovery. In particular, five different classes of mobility are considered: normal unaided walking, walking with a limp, walking using a cane or tripod, walking with a walker, and using a wheelchair. This presents a challenging classification problem as the differences in micro-Doppler for these activities can be quite slight. Within this context, the performance of four different radar and sonar systems - a 40 kHz sonar, a 5.8 GHz wireless pulsed Doppler radar mote, a 10 GHz X-band CW radar, and a 24 GHz CW radar - is evaluated using a broad range of features. Performance improvements using feature selection is addressed as well as the impact on performance of sensor placement and potential occlusion due to household objects. Results show that nearly 80% correct classification can be achieved with 10 second observations from the 24 GHz CW radar, while 86% performance can be achieved with 5 second observations of sonar.
Index Terms
Radar micro-Doppler, gait recognition, assisted living, sonar
I. INTRODUCTION
According to the U.S. Center for Disease Control and Prevention [1], every twenty minutes an older person in the U.S. dies from fall-related injuries. Even in nursing homes, which offer supervised care, each year approximately 1,800 elderly Americans fall. A key way to prevent falls, however, is to identify and mitigate risk factors, such as lower body weakness, difficulties with walking and balance, vision problems, foot pain or poor footwear, home hazards, and even broken or uneven steps, among other factors, such as vitamin D deficiency or side-effects of
S. Z. Gurbuz is with the Department of Electrical and Electronics Engineering, TOBB University of Economics and Technology, Ankara, Turkey, as well as the TUBITAK Space Technologies Research Institute, Ankara, Turkey (e-mail: [email protected]; [email protected]).
C. Clemente and J. Soraghan are with the University of Strathclyde, Centre for Signal and Image Processing, Glasgow, Scotland, UK (email: [email protected], [email protected])
medicines. Most significantly, while over one third of elderly over age 65 fall each year, only half of these individuals even tell their doctors of such events.
Thus, health monitoring systems should not just detect critical events, such as the falls themselves, but should also assess the presence of any risk factors for falling or other illness through analysis of elderly gait. Characterization of normal movement can also aid fall detectors in determining the transition from a walk to a fall [2]. However, many older or disabled individuals routinely use a variety of walking aids, such as a cane, walker, or wheelchair, or may suffer from irregular or limped walking that may serve as an indicator of fall risk. Although many works have addressed sensors and algorithms for fall detection, the potential for recognizing nuances in elderly gait has been less examined.
Human activity recognition may be accomplished with many different types of sensors, such as wearable devices, video cameras, infrared and seismic sensors. However, these sensors possess significant disadvantages - wearable sensors are ineffective if forgotten to be worn, video cameras have the potential for dual-use as a surveillance device and may infringe upon privacy, while infrared and seismic sensors are more susceptible to false alarms. In contrast, radar and sonar systems possess many unique advantages, especially for home environments, such as being able to fully operate in the dark, when it is nighttime and no lights are on. Vital gait information can be obtained without recording any visual or vocal data that would infringe upon the privacy of the person being observed. Most importantly, not just sudden motions, such as falling, but also more subtle differences in gait caused by the use of walking aides or impairments, such as limping, can also be discerned. These characteristics make radar and sonar nearly ideal sensors for gait recognition applications.
Radar and sonar systems accomplish gait recognition by exploiting the unique patterns in micro-Doppler exhibited for different activities. Micro-Doppler [3] are frequency modulations about the central Doppler shift that are caused by vibrations or rotations of parts of the target. Thus, the rotation of wheels on a vehicle, spinning of blades on a helicopter, or periodic motion of the limbs while a person is in motion all result in a distinct micro-Doppler signatures. Over the past decade, machine learning and pattern recognition techniques have been successfully used to classify many human activities. For example, Kim and Ling [4] achieved a correct classification rate of around 92% using six features to discriminate seven activities performed directly towards the radar. Fioranelli, et.al. [5] correctly identified armed versus unarmed personnel at rates varying between 90% and 97%, depending upon the direction of walking. In home environments, micro-Doppler research has focused primarily on fall detection (see [6] and references therein). While [2] compares the micro-Doppler signatures of normal walking versus walking with a cane or a walker, no classification results were presented.
selection exploited as a method for mitigating the detrimental effects of occlusion and aspect angle. Performance is compared for different sensor positions, including ceiling-mounted down-looking positioning.
The remainder of the paper is organized as follows: in Section II, an overview of the micro-Doppler effect, computation of the micro-Doppler signature and the differences in the patterns of the signature for different activities and sensors, with and without occlusion is discussed. In Section III, classification of the five types of aided and unaided gait signatures with four different radar/sonar systems is addressed. In Section IV, the potential for feature selection to improve classification performance is demonstrated, while in Section V the impact of detrimental situations such as occlusion and aspect angle is investigated. Section VI concludes with an assessment of the use of micro-Doppler based radar/sonar gait recognition and future work.
II. RADAR ANDSONARMICRO-DOPPLERSIGNATURES
Micro-Doppler signatures may be obtained from a wide variety of continuous wave (CW), frequency modulated continuous wave (FMCW) and pulse Doppler radar and sonar devices; however, the micro-Doppler shifts observed are sensitive to the frequency band of the transmitted signal. At lower frequency bands, the micro-Doppler shift caused by minute vibrations or rotations may not be detectable. Although human micro-Doppler signatures have been investigated at frequencies as low as UHF [8], it is more common to use frequencies that are between L-band and K-band for indoor applications, while frequencies of 24 GHz and 77 GHz have been used by automotive radar for pedestrian detection [9].
(a) (b) (c)
[image:4.612.71.542.345.430.2](d)
Fig. 1. Radar and sonar systems tested. (a) 5.8 GHz PD radar mote, (b) 10 GHz CW radar, (c) 24 GHz CW radar, (d) 40 kHz CW sonar.
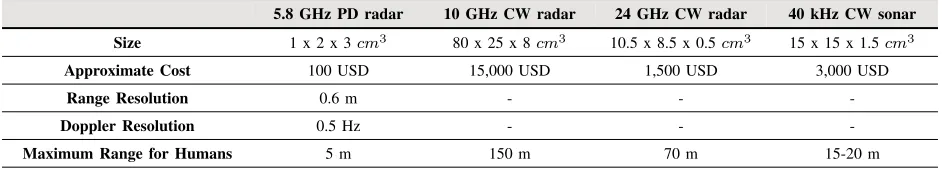
TABLE I
SYSTEM PARAMETERS OF RADAR AND SONAR SYSTEMS CONSIDERED.
5.8 GHz PD radar 10 GHz CW radar 24 GHz CW radar 40 kHz CW sonar Size 1 x 2 x 3cm3 80 x 25 x 8cm3 10.5 x 8.5 x 0.5cm3 15 x 15 x 1.5cm3 Approximate Cost 100 USD 15,000 USD 1,500 USD 3,000 USD
Range Resolution 0.6 m - -
-Doppler Resolution 0.5 Hz - -
-Maximum Range for Humans 5 m 150 m 70 m 15-20 m
A. Experimental Measurements of Micro-Doppler Signatures
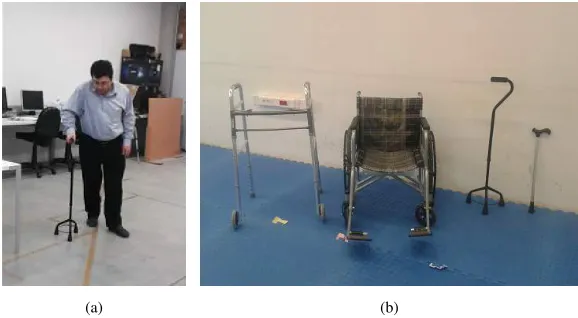
Experimental measurements of all micro-Doppler signatures used in this study were conducted in an indoor laboratory environment, such as shown in Figure 2, at distances between 2 meters to 5 meters from the radar transmitter. Subjects included both men and women spanning ages between 20 to 40 who were not normally disabled or elderly, but who role-played during use of the walking aides, moving much more slowly and laboriously than normal.
Many time-frequency distributions can be used to represent the micro-Doppler signature, including the Gabor transform, Wigner-Ville Distribution, and S-transform, among others. For applications requiring the detection of minute movements, such as gestures made by someone standing or breathing, for instance, extremely high resolution of frequency changes is required. In such cases, the empirical mode decomposition (EMD) and Hilbert-Huang Transform (HHT) have been shown [13] to offer good performance. However, the most commonly used time-frequency representation is the spectrogram, which is defined as the modulus of the Short-Time Fourier Transform
|ST F T(n,!)|= 1
X
1
x[n+m]w[m]e j!m (1)
(a) (b)
Fig. 2. Laboratory environment for experiments: (a) example of walking with tripod, and (b) walking aides utilized in experiments.
computed by sampling the data at 1.1 kHz and applying a window of 180 ms. 75% overlap and 256 frequency points were utilized. To mitigate clutter, a high pass filter with cutoff frequency of 40 Hz was applied. For the 10 GHz CW radar, data was sampled at 10 kHz, and windows 0.2 seconds in duration with 50% overlap were used in computing the spectrograms. The I/Q samples of the 5.8 GHz radar are output at a rate of 180 Hz, and the spectrograms were generated with 2048 frequency points, an overlap of 8 points, and a Hanning window length of 64 points. High pass filtering with a cutoff at 5 Hz was applied for ground clutter removal. 40 kHz sonar data was processed with a sampling rate of 10 kHz and a 200 ms STFT using windows with 50% overlap.
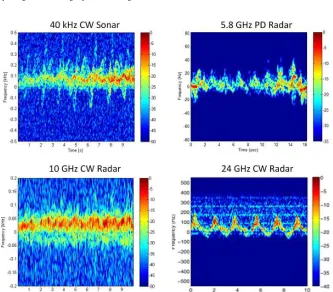
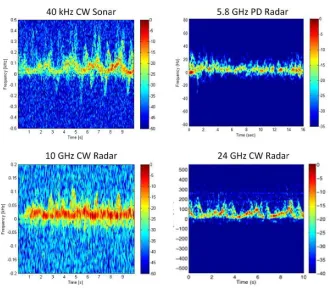
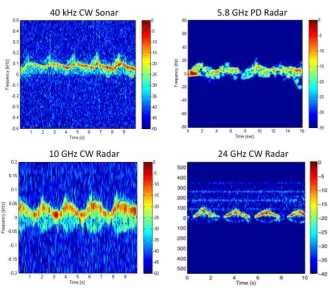
Examples of the spectrograms obtained from each radar and sonar system for different degrees of mobility are shown in Figures 3 - 8. The most pristine spectrograms are attained with the 24 GHz pulsed Doppler system, due to its higher transmit frequency and greater range resolution; however, all systems share several fundamental trends. The torso response appears as the strongest part of the micro-Doppler signature, with appendage motion being of lower strength, higher frequency signals. Limping signatures have a lower stride rate, with the returns from one leg dominating. The presence of a cane has a similar effect, but the utilization of the walking aid also reduces the overall Doppler spread while the signature over one leg cycle is broader than that over the other leg cycle. Moreover, the difference in gait due to having both hands constrained by the walker, as opposed to one free hand when using the cane, is also visually observable. The two-stage motion that is induced by first pushing the walker forward and then stepping up into it can also be seen as two arches in the 24 GHz radar spectrograms. These effects are obscured in the spectrograms of the lower frequency systems, with mainly the gross periodicities being evident. Finally, wheelchair spectrograms reveal the periods over which the subject is turning the wheels versus letting the wheelchair roll.
TABLE II
MICRO-DOPPLERSIGNATUREACQUISITIONCHARACTERISTICS.
% Duration of Acquisition (s)
Total Number of Acquisitions
Training Set Size)
SNR
5.8 GHz PD radar mote 4 240 60% 38 dB
10 GHz CW radar 10 100 70% 20 dB
24 GHz CW radar 10 100 70% 39 dB
40 kHz CW sonar 5 120 70% 26 dB
B. Effect of Occlusion and Partial Illumination
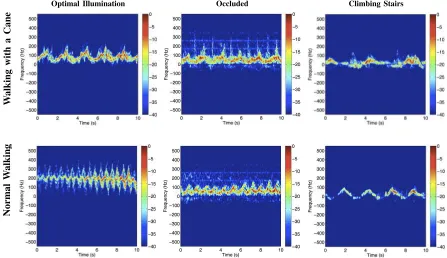
In home environments, occlusion and partial RF illumination of the monitored subject can occur. For example, the return from the legs can be partially or completely occluded by the presence of furniture, such as a bed, or the target can be partially illuminated by the radar beam if the subject is climbing the stairs. In Figure 9, spectrograms obtained using the 24 GHz radar are shown for walking with a cane and normal walking in the cases of optimal illumination, occlusion and climbing the stairs. In particular, a 70 cm tall obstacle representing a bed was used to acquire the occluded data, while for the climbing stair acquisition the radar was located on the landing on top of a stairwell with the antenna beam axis parallel to the landing.
By observing the spectrograms in the presence of occlusions, and comparing them with the optimal illumination cases, a loss in signal power is evident due to a rise of the noise floor in the normalized spectrogram. In the case of occluded walking with a cane, it is possible to identify a missing component relative to the dragged foot that is instead visible in the optimal illumination spectrogram. Similarly, the obstructed walking spectrogram carries less information with a spectrogram dominated by the torso motion only.
The spectrograms relative to the climbing stairs observations carry mainly the torso, head and shoulders motion information due to the fact that the legs are not visible to the radar and that the arms do not swing (as one hand holds the handrail). In the normal walking case the torso motion is clearly visible with a growing scattering intensity due to the increasing area visible to the radar while the target climbs the stairs. Climbing the stairs using a cane produces a behavior similar to normal walking; however, the spectrogram carries some additional information due to the motions required to move the cane before each step.
III. AIDED ANDUNAIDEDGAITRECOGNITION
Machine learning and pattern recognition techniques may be exploited to automatically detect differences in the micro-Doppler signature and to perform classification based upon these variations. The process may be divided into three main steps: 1) feature extraction, 2) feature selection, and 3) classification. Micro-Doppler features may be generally grouped into three categories:
• physical features[14], i.e. those features relating to the physical properties of the target motion, such as
mean gait velocity, mean stride rate, frequency of limb motion, bandwidth of Doppler signal, bandwidth of torso return, extreme frequency magnitude and extreme frequency ratio [15], gait velocity and stride variability [16]. Some physical features are also extracted from the cadence velocity diagram (CVD), which is derived from the spectrogram. An example of a CVD feature is the appendage-to-torso ratio [17], which is defined as the ratio of the power of the returns from the torso to that of the limbs. More recently, a novel angle-invariant image processing technique utilizing pseudo-Zernike moments extracted from the CVD has also been proposed [18] that has been shown to possess important invariant properties. Translational invariance allows robust identification of targets with different main Doppler shifts but belonging to the same class. Scale invariance allows the provision of features that are invariant with respect to variations of the aspect angle, making the algorithm applicable in a multistatic scenario without the requirement of a multistatic training dataset. Moreover, scale invariance enables mitigation of inter-class variability, namely physical differences between targets of the same class (e.g. two people walking, a tall and a short one that would introduce different micro-Doppler shift that might otherwise have led to an incorrect classification).
• speech-inspired features[19]–[22], which are features initially developed for speech processing, but which
have been found to be useful in classifying micro-Doppler, such as linear predictive coefficients (LPC), cepstrum coefficients and, especially, mel-frequency cepstrum coefficients (MFCC); and
• transform-based features[23]–[25], which are typically chosen as the coefficients of a transform, such as
the Fourier Transform, Wavelet Transform, and Discrete Cosine Transform (DCT).
The efficacy of a given feature set is dependent upon many parameters, including transmitter frequency, range and Doppler resolution, the aspect angle of target motion relative to the radar line of sight, and signal-to-noise ratio (SNR). A study of the effect of features on performance under varying operational conditions is given in [26] based upon simulated micro-Doppler signatures. In this work, several different feature sets that have experimentally yielded superior results are utilized to establish baseline performance. Subsequently, performance gains achievable through a formalized approach to feature selection is discussed in Section V.
A. Radar System Performance
In contrast, signatures from the 10 GHz CW radar were used to extract 15 cepstral features and processed with a Nave Bayesian classifier. Results show that just 5 seconds of data was sufficient to correctly classify all wheelchair returns. Walking and cane/tripod usage were correctly recognized at a rate of 85% and 69%, respectively, while the most confusion occurred between walking and use of a walker as well as limping with cane/tripod usage. Overall a correct classification rate of 66% was achieved.
As a low cost, low power, wireless system, the 5.8 GHz radar yielded one of the more challenging datasets. The system gives no access to the received return, only outputing one sample per pulse; thus, correction for effects such as range migration is not possible, resulting in a blurring effect on the spectrogram. A total 127 features, comprised of 13 physical features, 10 DCT coefficients, 3 cepstrum coefficients, and 101 LPCs were extracted and supplied to an SVM classifier. A two-tier approach was utilized, first discriminating wheelchair use from the remaining four classes, followed by classifying the remaining four bipedal motions. With just a 4 second dwell time, the wheelchair was correctly identified 92.8% of the time, while the remaining bi-pedal classes were classified correctly at an overall rate of 67.74%.
In general, all systems were able to effectively ascertain the wheelchair, while the most confusion was seen between the single-handed walking aids (cane/tripod) and the two-handed use of a walker. This is not unexpected considering the similarity of the two motions, and because constraining one arm also subconsciously limits use of the other, thereby minimizing the arms swing of the free hand and rendering the signature even more similar to that of the walker, which constrains both hands. Typically longer dwell times result in improved performance: in the 24 GHz CW radar increasing the dwell time from 5 seconds to 10 seconds improved classification performance by 7%. In the case of the 5.8 GHz wireless radar mote, however, the extremely short range of just 5 meters severely limits the dwell time. For the same dwell time of 5 seconds, a 6.58% difference in performance was observed between the 24 GHz and 10 GHz systems. This difference is caused in part by the difference in SNR levels between the two data sets, and in part by the difference in frequency and choice of features. Because the wavelength at 24 GHz is about half of the wavelength at X-band, for the same velocity the 24 GHz radar observes a Doppler shift twice that observed at X-band.
B. Sonar System
TABLE III
CONFUSIONMATRICIESSHOWINGCLASSIFICATIONPERFORMANCEACHIEVEDFROMDIFFERENTRADARSYSTEMS
5 seconds of 24 GHz CW radar data classified with SVM % Limping Cane/Tripod Walking Walker Wheelchair Limping 72.70 11.90 4.63 5.76 5.00
Cane/Tripod 10.53 55.43 13.26 15.03 5.73
Walking 10.03 11.83 73.30 0.96 3.86
Walker 3.40 13.76 0.53 79.43 2.86
Wheelchair 4.90 5.76 3.70 3.60 82.03
10 seconds of 24 GHz CW radar data classified with SVM % Limping Cane/Tripod Walking Walker Wheelchair Limping 82.06 8.80 2.06 4.93 2.13
Cane/Tripod 8.66 61.93 12.73 12.93 3.73
Walking 5.86 6.66 81.33 0.33 5.80
Walker 1.93 11.80 0.33 83.73 2.20
Wheelchair 2.20 3.33 2.80 2.20 89.46
5 seconds of 10 GHz radar data classified with Naive Bayes % Limping Cane/Tripod Walking Walker Wheelchair Limping 42.30 51.30 3.85 2.56 0
Cane/Tripod 20.00 69.40 10.59 0 0
Walking 2.63 1.32 85.50 10.53 0
Walker 4.20 2.70 54.20 38.88 0
Wheelchair 0 0 0 0 100
4 seconds of 5.8 GHz radar data classified with SVM
% Wheelchair Bipedal
Wheelchair 92.81 7.19
Bipedal 4.64 95.37
% Limping Cane/Tripod Walking Walker Limping 63.98 12.33 9.15 14.54
Cane/Tripod 11.40 63.77 2.65 22.19
Walking 13.50 0.63 85.52 0.92
Walker 18.42 22.42 1.58 57.58
TABLE IV
CONFUSION MATRIX FOR40KHZ ULTRASOUND PROCESSING5SECOND DWELL TIME DATA CLASSIFIED WITHNAIVEBAYESIAN CLASSIFIER.
% Limping Cane/Tripod Walking Walker Wheelchair Limping 61.50 37.20 1.30 0 0
Cane/Tripod 12.80 84.90 2.30 0 0
Walking 0 0 100 0 0
Walker 4.20 4.20 0 91.70 0
Wheelchair 0 3.20 0 0 96.80
was achieved, higher than the performance achieved by any of the RF systems previously employed due to the 3.5-fold improvement in Doppler resolution relative to that at X-band.
IV. SENSORPOSITIONING ANDASPECTANGLEDEPENDENCE
One possible remedy of this situation is to use a multi-static radar to acquire multi-perspective data. In [27], sensors are positioned such that there is a 90 difference in the orientation. In this way, when one sensor is acquiring data at a high aspect angle, the other sensor will be collecting observations at a low aspect angle. Observations at multiple angles also minimize the chances of occlusion. Indeed, in [27], placement of a sensor on the ceiling, such that the radar was looking down upon the subject, was shown to result in improved classification performance. Although when the subject is directly under the ceiling radar at aspect angle of 90 is observed, at all other locations within the room, regardless of the direction the subject, more advantageous aspect angles will be attained. Moreover, the chances of occlusion with a ceiling radar are minimal. As an example, consider the micro-Doppler signature obtained from the 5.8 GHz pulse Doppler radar mote placed under the ceiling and looking down as the subject walks back and forth under the radar. Irrespective of the subject motion, a spectrogram showing clearly the micro-Doppler is attained, as shown in Figure 10.
To see the effect of sensor position on classification performance, consider the classification results obtained when the 5.8 GHz radar mote is placed at 0 , 30 , 60 aspect angles on furniture in a room as well as on the ceiling looking down upon the center of the room. The classification results obtained with 4 seconds of data from which the same 127 feature set as used in Table III is extracted and classified with SVM are given in Table V. From these results it may be seen that at 0 an overall performance of 73.94% is achieved, while poorer performance are achieved for 30 and 60 where the correct classification drops to 64.47%, and 46.44%, respectively. In contrast, the ceiling radar yields an overall performance of 56.42%, which is 10% higher than the result attained with a sensor observing the subject at a 60 aspect angle.
V. FEATURESELECTION
TABLE V
CONFUSION MATRICIES FOR5.8 GHZ RADAR PROCESSING4SECONDS OF DATA WITHSVMAT VARYING ASPECT ANGLES.
(a) 0 aspect angle
% Wheelchair Bipedal
Wheelchair 94.69 5.31
Bipedal 3.92 96.08
% Limping Cane/Tripod Walking Walker Limping 74.63 4.75 5.75 14.88
Cane/Tripod 11.88 74.00 0.13 14.00
Walking 20.25 0 77.50 2.25
Walker 14.13 16.25 0 69.63
(b) 30 aspect angle
% Wheelchair Bipedal
Wheelchair 92.81 7.19
Bipedal 4.64 95.37
% Limping Cane/Tripod Walking Walker Limping 61.38 10.50 10.50 17.63
Cane/Tripod 12.25 57.75 18.88 11.13
Walking 15.75 6.00 73.25 5.00
Walker 15.75 15.50 3.25 65.50
(c) 60 aspect angle
% Wheelchair Bipedal
Wheelchair 95.31 4.69
Bipedal 1.88 98.13
% Limping Cane/Tripod Walking Walker Limping 66.13 12.25 11.25 10.38
Cane/Tripod 5.63 52 0.25 42.13
Walking 19 10 57.50 13.50
Walker 6.13 83.50 0.25 10.13
(d) ceiling mounted, down looking
% Wheelchair Bipedal
Wheelchair 72.67 27.33
Bipedal 33.25 66.75
% Limping Cane/Tripod Walking Walker Limping 57.18 9.33 16.25 17.25
Cane/Tripod 14.13 58.00 9.25 18.63
Walking 17.68 8.33 65.75 8.25
Walker 36.13 3.88 15.25 44.75
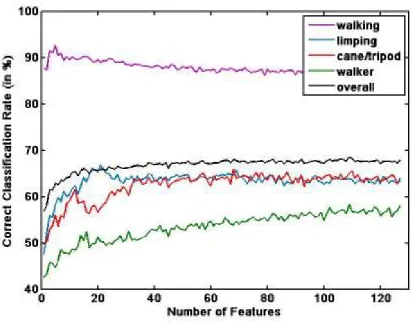
as the number of selected features increases:
max 0
@I(C;fi)
X
fs2S
I(C;fs) H(fs)
I(fs;fi)
1
A (2)
where I(C;fi) is the mutual information between feature fi in the set of all features F and the class variable C,I(C;fs)is the mutual information between selected feature fs and the class variableC,H(fs)is the entropy of a feature in the selected feature set S,I(fs;fi)is the mutual information between fi and the already selected featurefsin the selected feature setS, and is a parameter that controls the relative importance of relevance and redundancy. In the beginning of the selection process, the MIFS-U algorithm first ensures relevance to the class variable. As the selected feature set grows, new selections are required to be increasingly less redundant. In this way, the ratioI(C;fs)/H(fs)facilitates efficient de-selection of features.
VI. DISCUSSION ANDCONCLUSIONS
In the work, the potential for micro-Doppler analysis to recognize similar in-home aided and unaided gaits — unaided walking, walking with a limp, walking with a cane or tripod, walking with a walker, and using a wheelchair — has been investigated. The classification performance of four different radar and sonar systems is examined; namely, a 40 kHz sonar, a 5.8 GHz wireless pulsed Doppler radar mote, a 10 GHz X-band CW radar, and a 24 GHz CW radar. Results show that for indoor applications sonar not only has the distinct advantages of higher resolution and no interference in RF communication bands, but also exhibits the highest performance, with a correct classification rate of 86%. The radar systems considered correctly classified the activites with rates ranging from 66% to 73% when the subject directly moved towards the radar. When the aspect angle increases to 60 , this performance drops to as low as 46%. Ceiling mounted sensors exhibited slightly better performance with 56% correct classification, but this is still substantially poorer than that achieved by a waist-high sensor observing in-line with the subjects motion. Increasing the duration of observation from 5 seconds to 10 seconds dramatically improves classification rates to about 80% for the 24 GHz radar. Thus, it is recommended that radar systems employed for such indoor monitoring applications have sufficient range to span an entire room, and that multiple sensors, place either orthogonally on the walls or on the ceiling be used to compensate for angle-dependent degradations and minimize the possibility for occlusions, while also ensuring the maximum possible dwell time on the subject. Overall, the results show that radar and sonar micro-Doppler classification algorithms, which utilize varying choices in feature sets or explicitly employ feature selection algorithms, can be used for gait-based health monitoring of elderly or disabled individuals. Future work will aim at improving performance through the use of a radar/sonar network and data fusion.
ACKNOWLEDGMENT
This work was supported in part by TUBITAK Proje No. 113E105 and EU FP7 Proj. No. PIRG-GA-2010-268276, as well as by the Engineering and Physical Sciences Research Council (EPSRC) Grant number EP/K014307/1 and the MOD University Defence Research Collaboration in Signal Processing. The authors would like to thank Domenico Gaglione, Christos Ilioudis, Adriano Rosario Persico, Jianlin Cao, Mustafa Bugra Ozcan, Bahri Cagliyan and Burkan Tekeli for their contributions.
REFERENCES
[1] U.S. Center for Diseast Control and Prevention website, http://www.cdc.gov/homeandrecreationalsafety/falls/index.html, last accessed 16 January 2016.
[2] M. G. Amin, F. Ahmad, Y. D. Zhang, and B. Boashash, “Micro-Doppler characteristics of elderly gait patterns with walking aids,”in Proc. SPIE Radar Sensor Technology Conference, Baltimore, MD, April 2015.
[3] V. Chen,The micro-Doppler effect in radar, Artech House, 2011.
[4] Y. Kim and H. Ling, “Human activity classification based on micro-Doppler signatures using a support vector machine,” IEEE Trans. Geosci. Remote Sens., vol. 47, no. 5, pp. 13281337, 2009.
[6] M. G. Amin, Y. D. Zhang, F. Ahmad, and K. C. Ho, “Radar signal processing for elderly fall detection,”IEEE Signal Processing Magazine, special issue on Signal Processing for Assisted Living (in press).
[7] V. Chen, D. Tahmoush, and William J. Miceli,Radar Micro-Doppler Signature: Processing and Applications, IET, 2014.
[8] J. Silvious, J. Clark, T. Pizzillo, and D. Tahmoush, “Micro-doppler phenomenology of humans at UHF and Ku-band for biometric characterization,”in Proc. SPIE, vol. 7308, 2009.
[9] A. Bartsch, F. Fitzek, R.H. and Rasshofer, “Pedestrian recognition using automotive radar sensors,”Advances in Radio Science, no. 10, 2012, pp. 45-55.
[10] C. Clemente, A. Balleri, K. Woodbridge, and J.J. Soraghan, “Developments in target micro-doppler signatures analysis: radar imaging, ultrasound and through-the-wall radar,”EURASIP Journal on Advances in Signal Processing, vol. 47, 2013.
[11] A. Balleri, K. Chetty, and K. Woodbridge, “Classification of personnel targets by acoustic micro-Doppler signatures”,IET Radar, Sonar and Navigation, vol. 5, no. 9, pp. 943-951, December 2011.
[12] B. Cagliyan, S.Z. Gurbuz, “Human activity classification using the wireless, mote-scale Bumblebee radar,”IEEE Geoscience and Remote Sensing Letters, vol. 12, iss. 10, Oct. 2015, pp. 2135 - 2139.
[13] D. P. Fairchild and R. M. Narayanan, “Classification of human motions using empirical mode decomposition of human micro-Doppler signatures,”IET Radar, Sonar and Navigation, vol. 8, no. 5, pp. 425434, June 2014.
[14] Y. Kim, S. Ha, and J. Kwon, “Human detection using doppler radar based on physical characteristics of targets,”IEEE Geoscience and Remote Sensing Letters, vol. 12, no. 2, February 2015.
[15] Q. Wu, Y.D. Zhang, W. Tao, M.G. and Amin, “Radar-based fall detection based on doppler time-frequency signatures for assisted living,” IET Radar, Sonar and Navigation, vol. 9, iss. 2, 2015, pp. 164-172.
[16] T. Yardibi, P. Cuddihy, S. Genc, C. Bufi, M. Skubic, M. Rantz, L. Liu, and C. Phillips, “Gait characterization via pulse-Doppler radar,” in Proc. IEEE Int. Conf. on Pervasive Computing and Communications (PERCOM) Workshops, March 22-25, 2011, pp. 662-667. [17] M. Otero, “Application of a continuous wave radar for human gait recognition,”in Proc. SPIE, vol. 5788, 2005.
[18] Clemente, C., Pallotta, L., de Maio, A., Soraghan, J.J., and Farina, A., “A novel algorithm for radar classification based on doppler characteristics exploiting orthogonal pseudo-zernike polynomials,”IEEE Trans. Aerospace and Electronic Systems, vol. 51, no. 1, January 2015.
[19] D. Yessad, A. Amrouche, M. Debyeche, and M. Djeddou, “Micro-doppler classification for ground surveillance radar using speech recognition tools,”in Proc. 16th Iberoamerican Congress, Pucon, Chile, November 15-18, 2011.
[20] R.J. Javier, Y. and Kim, “Application of linear predictive coding for human activity classification based on micro-doppler signatures,”IEEE Geoscience and Remote Sensing Letters, vol. 11, iss. 10, 2014.
[21] R.I.A. Harmanny, J.J.M de Wit, and G.P. Cabic, “Radar micro-Doppler feature extraction using the spectrogram and the cepstrogram,”in Proc. European Radar Conference, 2014, pp. 165 - 168.
[22] L. Liu, M. Popescu, M. Rantz, and M. Skubic, “Fall detection using doppler radar and classifier fusion, ”in Proc. IEEE EMBS Int. Conf. on Biomedical and Health Informatics (BHI), Hong Kong and Shenzhen, China, January 2-7, 2012.
[23] P. Molchanov, J. Astola, K. Egiazarian, and A. Totsky, “Ground moving target classification by using DCT coefficients extracted from micro-doppler radar signatures and artificial neuron network,”in Proc. Microwaves, Radar and Remote Sensing Symposium (MRRS), 2011. [24] C.E. Phillips, J. Keller, M. Popescu, M. Skubic, M.J. Rantz, P.E. Cuddihy, and T. Yardibi, “Radar walk detection in the apartments of
elderly,”in Proc. 34th Annual Int. Conf. of the IEEE EMBS, San Diego, CA, August 28 September 1, 2012.
[25] B.Y. Su, K.C. Ho, M.J. Rantz, and M. Skubic, “Doppler radar fall activity detection using the wavelet transform,”IEEE Trans. Biomedical Engineering, vol. 62, no. 3, March 2015.
[26] S.Z. Gurbuz, B. Erol, B. Cagliyan, and B. Tekeli, “Operational assessment and adaptive selection of micro-Doppler features,”IET Radar, Sonar and Navigation, vol. 9, no.9, December 2015, p. 1196-1204.
[27] L. Liu, M. Popescu, K.C. Ho, M. Skubic, and M. Rantz, “Doppler radar sensor positioning in a fall detection system,” in Proc. 34th Annual Int. Conf. of the IEEE EMBS, San Diego, CA, USA, 28 Aug. 1 Sep. 2012.
[28] C. Clemente, A.W. Miller, and J.J. Soraghan, “Robust principal component analysis for micro-doppler based automatic target recognition,” inProc. 3rd IMA conference on Mathematics in Defence, 24 October 2013.
[29] J. Zabalza, C. Clemente, G. Di Caterina, J. Ren, J.J. Soraghan, and S. Marshall, “Robust PCA for micro-doppler classification using SVM on embedded systems,”IEEE Transactions on Aerospace and Electronic Systems, vol 50, no. 3, 2014, pp. 2304-2310.
Fig. 3. Measured spectrograms of a single person walking.
Fig. 5. Measured spectrograms of a single person walking with a cane.
[image:16.612.136.465.406.696.2]Fig. 7. Measured spectrograms of a single person walking with a walker.
[image:17.612.135.465.405.696.2]W
alking
with
a
Cane
Optimal Illumination Occluded Climbing Stairs
Normal
W
[image:18.612.82.529.107.365.2]alking
Fig. 9. Spectrograms of walking with cane and normal walking in optimal illumination, occlusion and climbing stairs.
[image:18.612.202.411.473.644.2]