City, University of London Institutional Repository
Citation
:
Faruki, M. J., Ab Razak, M. Z., Azzuhri, S. R., Rahman, M. T., Soltanian, M. R.
K., Brambilla, G., Rahman, B. M., Grattan, K. T. V., De La Rue, R. M. & Ahmad, H. (2016).
Effect of titanium dioxide (TiO ) nanoparticle coating on the detection performance of
₂
microfiber knot resonator sensors for relative humidity measurement. Materials Express,
6(6), pp. 501-508. doi: 10.1166/mex.2016.1342
This is the accepted version of the paper.
This version of the publication may differ from the final published
version.
Permanent repository link:
http://openaccess.city.ac.uk/17239/
Link to published version
:
http://dx.doi.org/10.1166/mex.2016.1342
Copyright and reuse:
City Research Online aims to make research
outputs of City, University of London available to a wider audience.
Copyright and Moral Rights remain with the author(s) and/or copyright
holders. URLs from City Research Online may be freely distributed and
linked to.
1PhotonicResearchCenter,UniversityofMalaya,50603KualaLumpur,Malaysia
2OptoelectronicsResearchCenter,UniversityofSouthampton,Southampton,SO171TW,UK
3SchoolofMathematics,ComputerScienceandEngineering,CityUniversityLondon,NorthamptonSquare,
London,EC1V0HB,UK
4OptoelectronicsResearchGroup,SchoolofEngineering,UniversityofGlasgow,RankineBuilding,Oakfield
Avenue,Glasgow,G128LT,UK
Effect of titanium dioxide (TiO
2
) nanoparticle
coating on the detection performance of
microfiber knot resonator sensors for
relative humidity measurement
Md Jahid Faruki1, Mohd Zulhakimi Ab Razak1, Saaidal R. Azzuhri1, Muhammad Towfiqur Rahman1,
Mohammad Reza Khalifeh Soltanian1, Gilberto Brambilla2, B. M. Azizur Rahman3,
Kenneth T. V. Grattan3, Richard De La Rue4, and Harith Ahmad1,∗
ABSTRACT
In this study, the sensitivity and the linearity of the un-coated and TiO2-coated microfiber knot resonator (MKR)
have been analyzed. The MKR is very sensitive to humidity changes since its refractive index is strongly humidity dependent. As a result, shifts occur in the resonance wavelength and there are also changes in output power. The un-coated MKR showed a sensitivity of 1.3 pm/%RH, in terms of the resonance wavelength, and a sensitivity of 0.0626 dB/%RH for the transmitted output power. The sensitivity increased greatly after the deposition of a porous TiO2 nanoparticle coating on the MKR. The TiO2-coated MKR showed an improved
sensitivity of 2.5 pm/%RH, with respect to the resonance wavelength, and 0.0836 dB/%RH for the transmitted output power. This MKR sensor has the potential for use in a variety of humidity sensing applications.
1. INTRODUCTION
The microfiber knot resonator (MKR) has a wide range of possible sensing applications, such as humidity,1 temperature,23acoustic wave vibration,4current,5and
solution-concentration sensings.6 Light travelling inside the loop of the knot resonator (in an approximately cir-cular shape) creates an evanescent field at the outer surface that can be used for very effective sensing pur-poses. It offers many advantages1-such as high resonance
quality-factor (Q-factor), low-loss and a faster and more reliable response, in terms of resonance wavelength shift-ing and transmitted output power variation. The MKR is very sensitive to changes in the refractive index of the fiber.1 When the refractive index in the sensing region
(the tapered region of the knot) varies, it changes the res-onance wavelength1 and the transmitted intensity of the light.78
situations.910 Humidity is a measure of water vapor that appears in the gaseous form—in air, pure gases or gaseous mixtures. From domestic use to use in various industrial sectors, humidity plays a vital role in many applications, e.g., in integrated semiconductor chip production, as well as in the agricultural, automotive, chemical and medical sectors.111 It is very important to maintain the correct
humidity level in food processing, pharmaceutical process-ing, wafer processprocess-ing, industrial microwave ovens, respi-ratory equipment, air conditioning-and many other sectors, in order to avoid defective manufacture. Two different measures of humidity are widely used-namely relative humidity (RH) and absolute humidity. Relative humid-ity (RH) is a temperature dependent function normally expressed as a percentage (%)-and it refers to the ratio of the partial pressure of water vapor present to the saturation vapor pressure of any gas, at a stated temperature. Nor-mally, RH is preferred, since it is easier to understand and to compare humidity conditions when specified in percent-age terms.11
Anumberofhumiditysensorsbasedonmicrofiber res-onators in the form ofknots, rings and loops have been reported.1 8 12 13 Wu et al.1 have carried out a
com-parative study of the humidity response of MKRs made of silicaand polymer,where silica-basedMKRs showed a sensitivity of 1.2 pm/%RH over a 10
to60%RH-and polymer-based MKR
ity of 8.8 pm/%RH over a range from 17 to 90%RH. In other work,12 a wide range (5% to 71%) of rela-tive humidity measurement has been demonstrated using a polyacrylamide micro-ring for which a sensitivity of 490 pm/%RH was reported. This work was followed by a report on a humidity sensor based on a microfiber loop resonator (MLR),8 where a sensitivity of 1.8 pm/%RH was achieved. References [1 and 12] focused only on one parameter (resonance wavelength shifting) being used to measure the sensitivity, whereas the work of Ref. [8] intro-duced two additional performance metrics—optical power level and extinction-ratio.
Moreover, researchers have been working to increase the sensitivity of the microfiber humidity sensor by coating the microfiber with humidity sensitive materials such as graphene13and gelatin.7 In the present study, deposited TiO2has been chosen as a coating for MKRs, because it is very sensitive to humidity and it displays a fast adsorption ability.11 TiO
2 coatings have porous structures at room temperature, where water vapor molecules can be adsorbed easily.11Among the three phases of TiO
2-namely anatase, rutile and brookite, the anatase phase exhibits higher water adsorption capability in comparison with both rutile and brookite.11To our knowledge, the first RH sensor based
on optical fiber evanescent field of fiber coupled to porous TiO2 waveguide was reported in 200414 where the mea-sured sensitivities of 0.46 nm/%RH in the 0% to 15%RH range and 0.025 nm/%RH in the 30% to 80% range were
observed. In other work, TiO2 nanoparticle sol–gel was deposited on locally de-cladded plastic-clad silica fiber-and a sensitivity of 27.1 mV/%RH was observed in the 24% to 95% RH range.15 Unfortunately, there is, to the best of our knowledge, no report available concerning the response of TiO2nanoparticle-based MKRs. This paper therefore demonstrates and compares the RH responses of the uncoated silica MKR and the TiO2-coated MKRs. The study then compares the sensitivity of the MKRs in terms of two parameter changes-which are the resonance wavelength and transmitted output power level. Initially, a microfiber with a diameter of 2.1 m was fabricated and a knot resonator with a loop diameter of 2.5 mm was fab-ricated. A comb-like spectral response was obtained and the MKR showed a linear response for humidity changes over a 40% to 95%RH range. Later, TiO2 was deposited on the MKR-and increased sensitivity was recorded over the same RH range. The details of this work are presented in a later part of this paper.
2. THEORETICAL BACKGROUND
The refractive index of a material medium is dependent on its structure and composition. According to the Lorentz-Lorenz formula,16–18the refractive index can be expressed
h is given in reference:1
3M+8N
A
3M−4NA
1/2
(1)
wheren refers to the refractive index of the medium, M is the molecular weight of the medium, NA denotes the Avogadro constant,is the medium polarization index and represents the density of the medium. All parameters are assumed to have constant values, with the exception of the medium density, . If the medium expands after absorption of water molecules, the result is a decrease in the values of andnvalues.1 On the other hand, if the
medium shrinks after absorption of the water molecules and the interstitial gaps in the medium are filled; both andnincrease.1
The transmission of light through the MKR can be pre-dicted by solving the coupled-mode equations. The free spectral range (FSR) can be expressed as per Ref. [1]:
FSR≈ 2
NgD ≈
2
NgL≈
2
neffL (2)
where refers to the operating wavelength,Ngdenotes the
group index of the mode propagating in the microfiber,neff is the effective index of the microfiber and L represents the loop length of the MKR. From Eq. (2) it can be seen that the resonance wavelength will shift when any change occurs in the refractive index or loop length. Changes in the resonance wavelength are given by1
where n and L represent the changes of effective index and the loop length, respectively. In this experi-ment, MKR loop diameter is very small (2.5 mm) and it can be assumed that the change of the normalized length (L/L is much smaller than the change of the normal-ized index (n/n. Thus, the length of the MKR remains approximately constant, and consequently making (L/L negligible.1 Mainly, any change of the refractive index value causes the resonance wavelength change.
3. EXPERIMENTAL DETAILS
3.1. Sensor Fabrication [image:4.658.64.283.279.681.2]The microfiber was fabricated from a single-mode fiber (Corning SMF-28) using flame brushing method by means
Fig. 1. (a) Microfiber fabrication stage; (b) fabricated microfiber of
diameter of 2.1m; (c) transmission spectrum obtained both before
and after the tapering process, using an OSA; (d) transmitted power data measured using an OPM during the tapering process.
of heat-and-pull technique. The coating was removed from the SMF and was placed on a ‘home-made’ fabrication stage, as depicted in Figure 1(a).
A flame obtained by burning a mixture of butane and oxygen gases was used to heat up the fiber-and the soft-ened fiber was pulled by a translationally movable fiber holders. An amplified spontaneous emission (ASE) source was used as the feed during the tapering process-and the transmitted power output was divided equally using a 50:50 fiber-coupler. One of the output ports of the coupler was connected to an optical power meter (OPM) and the other port was connected to an optical spectrum analyzer (OSA). Figure 1(c) shows the transmitted spectra mea-sured using the OSA, before and after the tapering process. Figure 1(d) shows the power transmission data obtained during the course of the tapering process, where the time spend refers to the time spend (in second) after the fabri-cation process of the microfiber has been started. A loss of less than 2 dB, due to the tapering of the fiber, was observed. The fiber diameter was reduced to 2.1m in the waist region (Fig. 1(b)) and total length of the microfiber including transition length was measured approximately as 12 cm which is long enough to fabricate MKR. The length of the microfiber coated with TiO2is approximately equal to the circumference of the MKR.
Here Rwithadiameterof2.5mmwasproduced—andit showed a high Q-factor value(a value
as large as 75,000 was calculated from the sharp dips in the transmission), together with an FSR value within the range 0.22 to 0.23 nm. This is shown in Figure 2(a).
Figure 2(b) shows the transmission spectrum of the MKR when tunable laser source was used as a seed.
[image:4.658.312.541.493.708.2](a)
Fig. 3. Anatase TiO2nanoparticles: (a) XRD pattern and (b) FESEM
image.
3.2. Preparation of TiO2Solution
TiO2 nanoparticles of the anatase group were obtained commercially in powder form. The powder was analyzed using X-ray diffraction (XRD) with Cu K radiation, using a Siemens D500 instrument. Figure 3(a) shows the XRD pattern obtained for the synthesized TiO2 nanoparti-cles. The sharp peaks correspond accurately with the pub-lished diffraction pattern of anatase with reference number: 01-073-1764, which confirms that our prepared material has the anatase phase. The morphological and structural characteristics of the sample were analyzed using field-emission scanning electron microscopy (FESEM), in a Hitachi SU8000 instrument. Figure 3(b) shows an FESEM image of the anatase-phase TiO2nanoparticles.
The TiO2powder was mixed with deionized (DI) water. 0.08 mg of TiO2 powder was immersed in 100 ml of DI water in a glass bottle, giving a concentra-tion of 0.08% w/v. The soluconcentra-tion was stirred, using an
ultrasonication process, for a period of 10 minutes, in order to ensure that the solution was homogeneous. The solution was used for coating the MKR, immediately after carrying out the ultrasonication process.
3.3. Humidity Measurement Set-Up
An airtight plastic box was used as a humidity chamber. The humidity conditions inside the chamber were con-trolled through two adjustable valves. One valve allowed pure nitrogen (N2gas to flow into the humidity chamber to induce dry conditions. Another valve injected nitrogen gas into water, in order to produce wet air (water vapor) going into the chamber and inducing humidity in it. There was also a stopcock to allow the air to escape from the chamber when opened.
[image:5.658.313.539.409.711.2]A tunable laser source (TLS) (YOKOGAWA, model-AQ2200-136 TLS module) was used as a seed sig-nal in the experiment. The TLS was synchronized with an optical spectrum analyzer (OSA) (YOKOGAWA, model-AQ6370B). The experimental set up is shown in Figure 4(a). The MKR was placed inside the humidity chamber, so as to act as a humidity sensor. The light from the TLS was injected into the MKR and a 50:50 coupler was used to divide the MKR output. The output (i.e., the sensor response) was measured through the OSA and the
Fig. 4. (a) RH sensor measurement set-up; (b) TiO2deposition
inside the chamber to provide a reference for the humidity conditions.
4. RESULTS AND DISCUSSION
The responses of the MKR as a function of the humidity were recorded before the coating and after the coating of the MKR with TiO2 as shown in Figures 5 and 6 respec-tively. The temperature inside the laboratory was main-tained at 25C (±0.4C) during the experimental period, in order to minimize the unwanted effects of temperature change on the resonance wavelength shifting. The hygrom-eter sensing probe was placed inside the chamber, in order to measure the exact RH level inside the box-and the read-ing was monitored carefully throughout the measurement period. The experiment was started by inducing humid-ity inside the chamber. The water vapor molecules were adsorbed by the silica fiber when the humidity increased
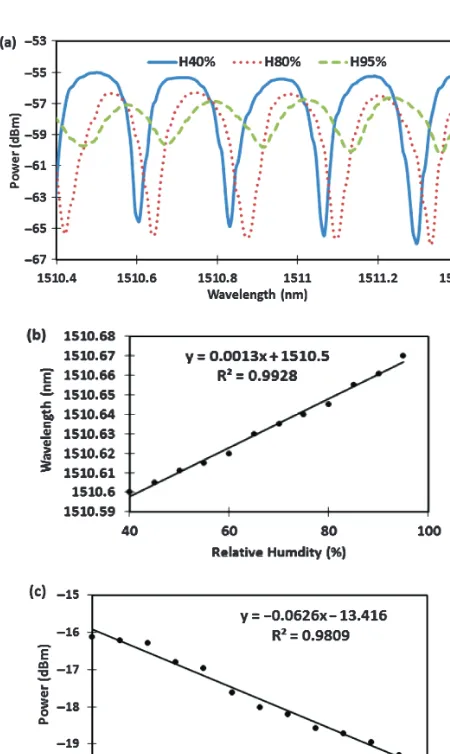
Fig. 5. Behavior of the MKR before TiO2deposition: (a) Transmitted
power spectra for three different RH levels; (b) resonance wavelength versus RH level and (c) output power variation with respect to RH level in the linear region.
and, as a result, the refractive index was changed. The trapped water molecules clearly increased the density of the fiber and thus the refractive index increased with increasing RH1—as indicated by the positive resonance wavelength shift. The response of an uncoated MKR is shown in Figure 5.
The fabricated MKR exhibited a linear response over the 40% to 95%RH range. The sensor exhibited a sensitivity of 1.3 pm/%RH, with a square regression coefficient (R2 of 0.9928, as determined by the resonance wavelength shift (Fig. 5(b)). The sensitivity is in close agreement with a previously reported value of 1.2 pm/%RH.1On the other
hand, the output power decreased as the relative humid-ity increased. The adsorption and condensation of water vapor molecules in the MKR, micro-bending occurred in the MKR due to humid air and nitrogen gas flow, varia-tion of refractive index in tapered fiber-ambient medium or the combination of these factors might influence the optical power drop. The MKR showed a sensitivity of 0.0626 dB/%RH with a square regression coefficient (R2 of 0.9809 with regard to the average output power recorded through the OPM as shown in Figure 5(c).
The MKR was subsequently coated using the ultrason-icated solution of TiO2. The TiO2 solution was kept in a plastic vessel and the vessel was attached on top of Z) translational stage. The stage was mounted at MKR heightby adjusting the z axis
[image:6.658.61.286.310.687.2]Fig. 6. Behavior of the MKR after TiO2 deposition (a) Humidity
response in various RH conditions; (b) resonance wavelength shifting with respect to RH changes in the linear region; (c) output power vari-ation with respect to RH changes.
The change occurs because of sudden changes in refrac-tive index of the region surrounding the MKR. However, the output power became stable after a few seconds.
The MKR was exposed to a range of different humid-ity levels after the TiO2 nanoparticle deposition. Since the TiO2coating is more sensitive to humidity, it was expected that higher sensitivity would result from using the coated sensor. The structure of TiO2is porous—so adsorption and capillary condensation occurs in response to the increase in the RH.14 The refractive index of the TiO
2 increases because of the water filling process. The results achieved with the TiO2-coated MKR are summarized in Figure 6.
It can be observed that the MKR responded linearly over the range from 40% to 95%RH. The sensitiv-ity of the sensor increased to 2.5 pm/%RH in terms of the resonance wavelength shift—which implies that the sensitivity increased by 92.30% in comparison with the uncoated sensor (Fig. 6(b)). However, the square
regression-coefficient (R2decreased to 0.9762, compared with 0.9928 for the response of the un-coated MKR. The reason for the greater sensitivity can be explained as following: the nano-scale porous structure of the TiO2 coating allows water molecules to be adsorbed more effec-tively than in the un-coated silica MKR sensor. When the humidity was increased, it had increased the adsorp-tion of the water vapor in the TiO2 nanoparticle coating. Thus the resonance wavelength shifted more substantially, as compared with the uncoated-MKR response. Further-more, the transmitted output power for the coated MKR decreased at a slightly higher rate in response to increas-ing RH. Approachincreas-ing 5 dB change in the power output level was recorded over the range from 40% to 95%. The sensitivity of the output power was recorded as 0.0836 dB/%RH after the coating—and was therefore higher than the uncoated-MKR (0.0626 dB/%RH). The square regression coefficient (R2of the sensitivity of the output power decreased slightly to 0.9778—as compared with 0.9809 for the uncoated MKR. No saturation effect is been observed in 0–95% RH range or for that mat-ter any signs of saturation as the sensor is exposed to very high humidity levels. It is postulated that the sat-uration level of the sensor would be higher than 95%, possibly near a humidity of 100%, but as the present
work.
The round trip measurement for increasing and decreas-ing of RH cycle is recorded. Both the uncoated and TiO2 -coated MKR were exposed to the increasing trend of relative humidity (from 0% to 95%RH) and decreasing trend of relative humidity (from 95% to 0%). Figure 7 shows round trip measurements of the uncoated and TiO2 -coated MKR. The resonance wavelength of the decreasing trend is slightly different from the increasing trend. This hysteresis error comes from the slow dehumidification pro-cess. When the sensor was dehumidified, it is postulated that some portion of absorbed water was left on the sensor from the previous measurement which creates the error.
Fig. 7. Response of the uncoated and TiO2-coated MKR for
[image:7.658.312.541.576.709.2]Fig. 8. Response time measurement. (a) The response of the uncoated MKR against drastic humidity change. (b) The response of the TiO -coated with respect to drastic humidity changes.
However, this error can be minimized by elapsing (wait-ing) longer time between the measurements.
The response time of both the uncoated and TiO2-coated MKR was also measured. In both cases, the MKR was exposed to drastic humidity changes when humid and dry air are induced in the chamber. Figures 8(a) and (b) shows the uncoated and TiO2-coated MKR response with respect to drastic humidity changes, respectively. The reference relative humidity, normalized output power and time spend are plotted on the primaryy-axis, the secondaryy-axis and the x-axis, respectively. The humidification and dehumid-ification pattern measured through reference hygrometer during the uncoated MKR response time measurement was recorded as follows: (70%RH (maintained for a while)→ 0%RH (maintained for a while)→70%RH (maintained for a while) → 0%RH (maintained for a while) → 70%RH (maintained for a while)→0%RH). The response time and recovery time were recorded approximately as 15 s and 20 s, respectively. For measuring the response time of TiO2-coated MKR, the following pattern of humidification and dehumidification was recorded through reference hygrometer: (Room Humidity→ 75%RH → 25%RH→Room Humidity (maintained for a while)→ 25%RH→75%RH→Room Humidity (maintained for a while)→90%RH→0%RH→Room Humidity (main-tained for a while)→85%RH→Room Humidity). It is notable that the room humidity during the measurement
period of the response time was around 50%RH. In this case, the response time of 25 s and the recovery time of 30s were recorded. Fast response and slow recovery time can be attributed to the fast diffusion process of the water molecule and slow desorption process.
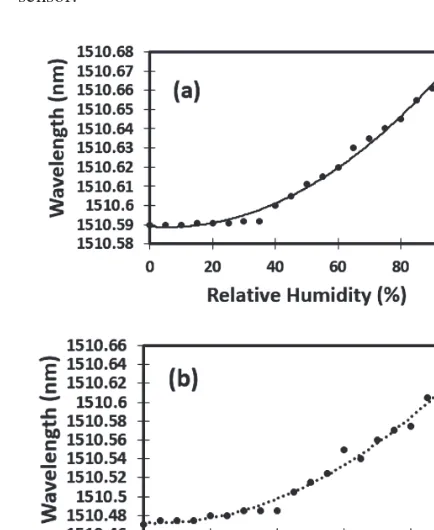
In the proposed sensor, the minimum linear response threshold was observed to be at a humidity level of approx-imately 40%. While the sensor responded linearly between the ranges of 40%–95%RH, a less linear response was observed at lower RH values of between 0–35%. This is shown in Figures 9(a) and (b). The sensitivity of the uncoated and TiO2-coated MKR at lower humidity lev-els was recorded at 0.06 pm/% RH and 2.5 pm/% RH, respectively. This response characteristic is attributed to the thickness of the microfiber, which is about 2.1 m and thus may not be thin enough to enable accurate mea-surements of humidity at the lower ranges. This fact is further validated by the work carried out by Zhang et al., who demonstrated that a gelatine coated microfiber with a thickness of 680.0 nm or about 0.7m was able to mea-sure humidity at the lower RH range, covering a meamea-sure- measure-ment range 9%–94%.7 It is important to note however that while this approach allows for measurement along a wide humidity range, the fragile nature of the materials and the diameterofthemicrofibercanposea
significantchallengetothefabricationandoperationofthe sensor.
Fig. 9. (a) The response of the uncoated MKR against relative
humid-ity variation (0%–95% range); (b) the response of the TiO2-coated
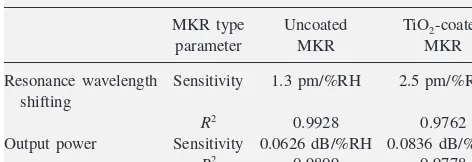
[image:8.658.315.532.433.698.2]t Table I. Comparison of the MKR response before and after the deposition.
MKR type Uncoated TiO2-coated
parameter MKR MKR
Resonance wavelength Sensitivity 1.3 pm/%RH 2.5 pm/%RH
shifting
R2 0.9928 0.9762
Output power Sensitivity 0.0626 dB/%RH 0.0836 dB/%RH
R2 0.9809 0.9778
Table I shows the comparison of the response of uncoated MKR and TiO2-coated MKR to portrait the impact of the TiO2deposition.
It can be concluded that the sensitivity of the coated MKR increases, both in terms of the shift in the resonance wavelength and the rate of decrease of the transmitted out-put power when the MKR is coated with the humidity-sensitive anatase TiO2 nanoparticles.
5. CONCLUSION
A 2.1 m diameter microfiber was fabricated using the heat-and-pull technique and a knot resonator with a diam-eter of 2.5 mm was fabricated. The response of the MKR was recorded in terms of the resonance wavelength and the transmitted output power. The uncommitted
sensitivitylevelsof1.3pm/%RH
in terms of the shift of the resonance wavelength and the output power, respectively. After TiO2 nanoparticles were deposited on the MKR structure, the performance measures of the MKR increased significantly. A sensitiv-ity of 2.5 pm/%RH and a sensitivsensitiv-ity of 0.0836 dB/%RH were recorded for the resonance wavelength and output power, respectively. It has clearly been demonstrated that the TiO2coated MKR resonance wavelength and transmit-ted power are more sensitive to RH variation than those of the uncoated MKR. Relatively expensive equipment and experimental set-up are required to monitor the shift in the resonance wavelength, whereas the changes in the transmit-ted power can be measured using cheaper equipment, such as an optical power meter. An output-power based MKR sensor can therefore be used for cost-effective humidity sensing applications, which only require cheap and easily available power metering. In contrast, a resonance wave-length shifting (or a combination of resonance wavewave-length and transmitted power measurement) based MKR sensor requires the more expensive equipment of an optical spec-trum analyzer, but has the advantage of being useful in more critical and accuracy-dependent sensing applications.
Acknowledgment: This work has been
sup-ported by Newton-Ungku Omar Fund from British
council and Government of Malaysia. The authors would like to acknowledge the grant number LRGS(2015)NGOD/UM/KPT, from the Ministry of Higher Education, Malaysia, GA010-2014 (ulung), BR002-2016 and RU010-2016 from the university of Malaya (UM).
References and Notes
1. Y. Wu, T. Zhang, Y. Rao, and Y. Gong; Miniature interferometric
humidity sensors based on silica/polymer microfiber knot resonators; Sensors and Actuators B: Chemical155, 258(2011).
2. Y. Wu, Y.-J. Rao, Y.-H. Chen, and Y. Gong; Miniature fiber-optic
temperature sensors based on silica/polymer microfiber knot
res-onators;Opt. Express17, 18142(2009).
3. X. Zeng, Y. Wu, C. Hou, J. Bai, and G. Yang; A temperature sensor
based on optical microfiber knot resonator;Optics Communications
282, 3817(2009).
4. A. Sulaiman, M. Muhammad, S. Harun, H. Arof, and H. Ahmad;
Demonstration of acoustic vibration sensor based on microfiber
knot resonator;Microwave and Optical Technology Letters55, 1138
(2013).
5. K. Lim, S. Harun, S. Damanhuri, A. Jasim, C. Tio, and H. Ahmad;
Current sensor based on microfiber knot resonator; Sensors and
Actuators A: Physical167, 60(2011).
6. H. Yu, L. Xiong, Z. Chen, Q. Li, X. Yi, Y. Ding, F. Wang, H. Lv, and
Y. Ding; Solution concentration and refractive index sensing based
on polymer microfiber knot resonator; Applied Physics Express
7, 022501(2014).
7. L. Zhang, F. Gu, J. Lou, X. Yin, and L. Tong; Fast detection of
humidity with a subwavelength-diameter fiber taper coated with
gelatin film;Opt. Express16, 13349(2008).
8. Y. Zheng, X. Dong, C. Zhao, Y. Li, L. Shao, and S. Jin; Relative
humidity sensor based on microfiber loop resonator;Advances in
Materials Science and Engineering2013, Article ID 815930(2013).
9. E. Traversa; Ceramic sensors for humidity detection: The
state-of-the-art and future developments;Sensors and Actuators B: Chemical
23, 135(1995).
10. B. M. Kulwicki; Humidity sensors; J. Am. Ceram. Soc. 74, 697
(1991).
11. Z. Chen and C. Lu; Humidity sensors: A review of materials and
mechanisms;Sensor Letters3, 274(2005).
12. P. Wang, F. Gu, L. Zhang, and L. Tong; Polymer microfiber rings for
high-sensitivity optical humidity sensing;Appl. Opt.50, G7(2011).
13. H. Ahmad, M. Rahman, S. Sakeh, M. Razak, and M. Zulkifli;
Humidity sensor based on microfiber resonator with reduced
graphene oxide;Optik-International Journal for Light and Electron
Optics127, 3158(2016).
14. A. Alvarez-Herrero, H. Guerrero, and D. Levy; High-sensitivity
sen-sor of low relative humidity based on overlay on side-polished fibers; Sensors Journal, IEEE4, 52(2004).
15. R. Aneesh and S. K. Khijwania; Titanium dioxide nanoparticle based
optical fiber humidity sensor with linear response and enhanced sen-sitivity;Appl. Opt.51, 2164(2012).
16. H. Lorentz; Ueber die beziehung zwischen der
fortpflanzungs-geschwindigkeit des Lichtes und der Körperdichte; Annalen der
Physik245, 641(1880).
17. L. Lorenz; The index of refraction;Ann. d. Physik11, 70(1880).
18. H. A. Lorentz, Versuch einer theorie der electrischen und optischen
Erscheinungen in bewegten Körpern: BG Teubner(1906).
19. K. Kashiwagi and S. Yamashita; Deposition of carbon nanotubes
around microfiber via evanascent light; Opt. Express 17, 18364