International Journal of Innovative Technology and Exploring Engineering (IJITEE) ISSN: 2278-3075, Volume-8 Issue-8S3, June 2019
Abstract: Photo Voltaic (PV) systems are currently in demand as the world is moving from conventional energy utilization to harnessing the solar power provided by nature. Lot of efficient electronic converters are invented, to transform the solar energy into human usable form. But the main drawback of these systems is the dependency on optimum lighting conditions in order to produce effective outputs. Optimal lighting conditions are generally not available in real time solar systems, thus in this paper analysis of the effects of non-optimum lighting conditions (or shading) on the PV systems which are controlled by Perturb & Observe (P&O) method of Maximum Power Point Tracking (MPPT) controllers. This P&O MPPT scheme is easy to implement and efficiency of PV panel is improved. The system consider in this paper is tested in MATLAB/SIMULINK software to demonstrate the simulation results.
Index Terms: MPPT, partial shading, P&O, solar photovoltaic.
I. INTRODUCTION
Presently there is a increased demand for energy on a large extent. It is a challenging task to fulfill these needs through conventional sources like coal, petroleum etc. Conventional energy resources are exhausting in a rapid manner and it cannot be renewed again and again. Resulting to the scarcity of these conventional sources the renewable energy sources are widely used. Now a days solar energy and wind energy are most commonly used renewable energy sources which are inexhaustible sources and used for electricity generation. It is easier to convert solar energy into electrical energy using photovoltaic cells. The main purpose of using solar PV source is that it is free from maintenance cost generates no pollution and static in nature [1]-[2].
To increase the PV system voltage or current, solar panels are connected in series or in parallel respectively. Solar photovoltaic system generates a DC electricity which is used to charge the batteries [3]. DC outputs are stable and it has less losses. Photovoltaic systems are environment friendly as solar energy is available locally. According to energy requirement construction of PV system is done. Solar panels use sunshine to produce electricity which is clean and quiet. In the course of the most recent couple of decades, photovoltaic vitality has turned into a viable source to deliver
Revised Manuscript Received on May 23, 2019.
Ruchita S. Chaudhari, Department of Electrical Engineering, Rashtrasant Tukadoji Maharaj Nagpur University/ Yeshwantrao Chavan College of Engineering, Nagpur, India.
Dr. Ravindra M. Moharil, Department of Electrical Engineering, Rashtrasant Tukadoji Maharaj Nagpur University/ Yeshwantrao Chavan College of Engineering, Nagpur, India.
power that will be utilized either in separated destinations or infused into the lattice [4]. There is growing interest in integrating
renewable energy sources to microgrids as there is a hefty generation of power from solar photovoltaic system. Hence use of distributed generations are increasing rapidly because of its operational feasibility. It has become very important to model the photovoltaic systems and evaluate their behavior [5].
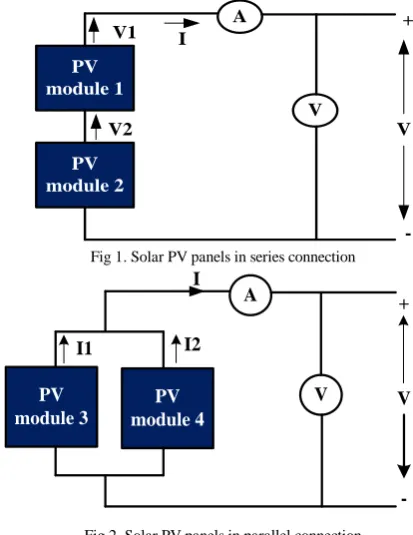
The arrangement of two modules is appeared in Fig 1. To increase voltage, two modules are connected in series with each other. Voltages from both modules gets added i.e., V=V1+V2. Current remains same in both modules. This kind
of association is appropriate for defeating the issue of hard drop voltage because of shading impact.
PV module 1
PV module 2
A
V I
V1
V2 V
+
-Fig 1. Solar PV panels in series connection
PV module 3
PV module 4
A
V V
+
-I1 I2
I
Fig 2. Solar PV panels in parallel connection
The parallel arrangement of modules is shown in Fig 2. To increase current, two modules are connected in parallel with each other. Current from both modules gets added i.e., I1+I2=I. This kind of association is appropriate for quick
charging of batteries because of high current can be obtained from the boards, and furthermore it is reasonable for direct association with the determined current load [6].
Regardless of all the merits presented by the use of PV, the efficiency of PV’s energy
conversion is low and the high initial installation cost. Therefore, to obtain
An Experimental Analysis of Solar PV System
under Shaded Condition using P&O Method
[image:1.595.315.522.362.630.2]maximum efficiency, it is mandatory to practice some techniques in order to draw maximum power from the solar panels.
In solar photovoltaic system (SPV), maximum power point tracking
(MPPT) technique plays a very significant role as it draws the maximum power from PV module considering the varying temperature and solar irradiation. Maximum power point tracking means to draw maximum power from SPV panels at optimum voltage (for specific radiation). MPPT works worthwhile in a condition like partial shading condition, cloudy days, cold climate, hazy days etc. [7]- [8]. Many MPPT schemes are available like Incremental Conductance, Perturbation and Observation (P&O) algorithm etc. Perturb and Observe algorithm is a widely known MPPT scheme. This P&O MPPT scheme is easy to implement and efficiency of PV panel is improved. Photovoltaic system generates DC voltage which is boosted by DC-DC boost converter. This photovoltaic system using P&O scheme is tested in Matlab/Simulink software [9].
II. THEPROPOSEDMETHODOLOGY
MPPT Controller P&O method PV
Pannel
Boost Converter Load
IPV
VPV
CO R
L D
L
[image:2.595.305.545.52.195.2]D
Fig 3 Block diagram of solar PV system using P&O method.
The PV panel generates a DC output and it feds the PV panel output to load through boost converter. Here P&O MPPT scheme is used. P&O MPPT controller is used to control the switching of boost converter. The block diagram of solar PV system with P&O MPPT scheme is shown in Fig 3.
TABLE I
BOOSTCONVERTERPARAMETERS
Boost converter Parameter Selected value
Inductor of boost converter (Lo) 5 mH Commutation frequency of boost
converter 20 kHz DC bus capacitor (Co) 470 μF Load resistance (RL) 15 ohm
Mode of operation Continuous
III. MODELLINGOFSOLARPVMODULE
+
-Iph
ID
RP Rsh
VPV IPV
Fig 4. Circuit configuration of PV module
Fig 4 demonstrates the fundamental electrical model.
(1) IPV is the output current of photovoltaic module which is
mathematically expressed as shown in equation 1. Iph is
photovoltaic current and Iao is reverse saturation current of
cell. VPV is the output voltage of photovoltaic module. Rsh and
Rp are series parallel equivalent resistances and Ncs is no of
series cells connected in one PV module. Tc is cell
temperature and afd is diode ideality factor. K is Boltzmann
constant is 1.3806503×10⁻²³J/K.
Iph and Iao are mathematically expressed as follows,
(2)
(3)
Ki and Kv are coefficient of current and coefficient of
voltage, Tc is the working temperature of cell and Tref is constant reference temperature. Similarly, S and Sref are working and reference irradiation level [9].
IV. PVSYSTEMSUNDERPARTIALLYSHADED
CONDITIONS
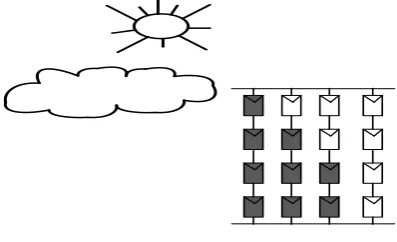
[image:2.595.54.283.327.483.2]In practical situation or in environment, shadow due to clouds, trees, tall buildings etc. falls on solar photovoltaic panels. Because of some shaded PV panels of PV array, there arises a non-uniformity of solar irradiance on some PV panels of PV array or PV park. The partial shading condition due to non-uniform solar irradiance arises because of passing clouds is shown in Fig 5.
Fig 5. Partial shading on PV system due to clouds.
[image:2.595.311.510.531.652.2]International Journal of Innovative Technology and Exploring Engineering (IJITEE) ISSN: 2278-3075, Volume-8 Issue-8S3, June 2019
Global peak
Local peak Local peak
0 50 100 150 200 250 300 350 400 450 500
VOLTAGE(V) 0
500 1000 1500
P
O
W
E
R
(W
A
T
T
[image:3.595.312.549.51.317.2])
Fig 6. PV characteristics under partial shading.
This single peak is also known as global peak which shows the maximum power of the PV array. But when non-uniform solar irradiance condition arises on solar PV array, then multiple peaks are generated on PV characteristics as shown in Fig 6. which is known as partially shaded condition.
The single highest peak which generates maximum power on the PV characteristics is known as global peak and other peaks of PV characteristics are known as local peaks.
Photovoltaic systems are always vulnerable to partial shading. While partial shading condition occurs then there is a sudden drop in the maximum power of PV system. This considerably minimizes the produced energy of the PV system. If there is an identical shading pattern, then there is a decrease in the maximum power of PV system at constant rate due to increment in shading heaviness. Therefore, in the identical partial shading pattern, the shading heaviness is always vulnerable to the partially shaded PV system. Solar irradiance plays vital role for PV system to generate electrical power, as if the shading heaviness becomes heavier the maximum power of partially shaded PV system should become lower.
V. P&OALGORITHM
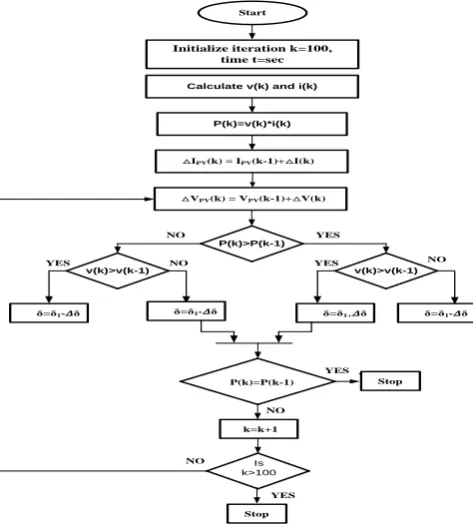
Here to accomplish the Maximum Power Point (MPP) under any states of temperature and solar radiation to obtain maximum power for measured parameters. Along these lines, the MPPT square achieves the estimation of the voltage that provides the maximum power, and the pinnacle of the power bend is accomplished quicker. This calculation gives a voltage reference, which connected to the controller. The calculation steps are depicted as delineated in the accompanying flowchart.
The principle of P&O algorithm is to produce perturbation by increasing or decreasing the duty cycle of boost converter. The behavior of PV system output is observed.
Start
Calculate v(k) and i(k)
P(k)=v(k)*i(k)
P(k)>P(k-1)
v(k)>v(k-1) v(k)>v(k-1)
ẟ=ẟ1- ẟ ẟ=ẟ1- ẟ ẟ=ẟ1+ ẟ ẟ=ẟ1- ẟ
Stop
NO YES
NO NO
YES YES
P(k)=P(k-1) ⧍VPV(k) = VPV(k-1)+⧍V(k) ⧍IPV(k) = IPV(k-1)+⧍I(k)
Initialize iteration k=100, time t=sec
YES
k=k+1
Is k>100
NO
NO
Stop YES
Fig 7. Flowchart of the modified P&O algorithm.
The direction of perturbation is keep going perpetuate if P(k) is greater than the preceding calculated P(k-1) otherwise the direction is reversed.
VI. SIMULATIONRESULTS
TABLE II
SPECIFICATIONS OF SINGLE SOLAR PV PANEL
Parameters Ratings
Open-Circuit Voltage (Voc) 32.9V Short-Circuit Current (Isc) 6 A Voltage at maximum power (Vmp) 26.3 V
Current at maximum power (Imp) 7.61 A
Max. Power 200.143 W Temperature 250C
Irradiation 1000W/m2
Coefficient of voltage Kv 3.75
Coefficient of current Ki 0.0032 A/K Number of cells in series Ns 54
The Table II shows the specifications of the single PV panel. Some mathematical calculations are done in order to determine the PV system parameters.
Parallel strings = ISC of system / ISC of solar panel
= 11.26A / 6.39A = 2 parallel strings Series connected modules per string
= VOC of system / VOC of solar panel
= 480V/32.9V =15
modules
[image:3.595.49.288.54.172.2]PV SYSTEM SPECIFICATIONS
Parameters Ratings
Open-Circuit Voltage (Voc) 480 V Short-Circuit Current (Isc) 11.26 A Voltage at maximum power (Vmp) 440 V Current at maximum power (Imp ) 11.15 A
Max. Power 4 KW Series resistance (Rsh) 0.221 ohm Parallel resistance (Rp) 415.5 ohm Temperature 250C
Irradiation 1000W/m2 Parallel strings 2 Series connected modules per string 15
To observe the partial shading effect case 1 to case 3 shading effect is depicted only for one string of PV array.
CASE 1 - Irradiance values for Partial shading pattern of single PV panel string:
TABLE IV
IRRADIANCE VALUES FOR PARTIAL SHADING PATTERN OF SINGLE PV PANEL STRING
TIME(sec) SOLAR PANEL
2 4 6 8 10
Irradiance W/m2
1 300 300 300 300 500 2 300 300 300 300 500 3 300 300 300 300 500 4 300 300 300 300 500 5 500 300 300 300 500 6 500 300 300 300 500 7 500 300 300 300 500 8 500 300 300 300 500 9 500 500 300 300 500 10 500 500 300 300 500 11 500 500 300 300 500 12 500 500 300 300 500 13 500 500 500 300 500 14 500 500 500 300 500 15 500 500 500 300 500
50 100 150 200 250 300 350 400 450 500
Voltage(V)
0 1 2 3 4 5 6
C
u
r
r
en
t(
A
[image:4.595.68.547.50.282.2])
Fig 8. VI Characteristics under partial shading.
50 100 150 200 250 300 350 400 450 500
Voltage(V) 200
400 600 800 1000 1200 1400
P
o
w
er
(W
)
0
Fig 9. PV Characteristics under partial shading.
Due to change in solar irradiance pattern occurring on one string as shown in Table IV, it depicts a partial shading effect in PV system. Accordingly, variation in insolation level are shown in Table IV. Whereas, Fig 8 and Fig 9 illustrates the PV and VI characteristics. From Fig 8 it is seen that rated 11.26 A current is reduced to 5.5A because of partial shading. Similarly, change in power of 4kw to 1.2kw is observed from Fig 9.
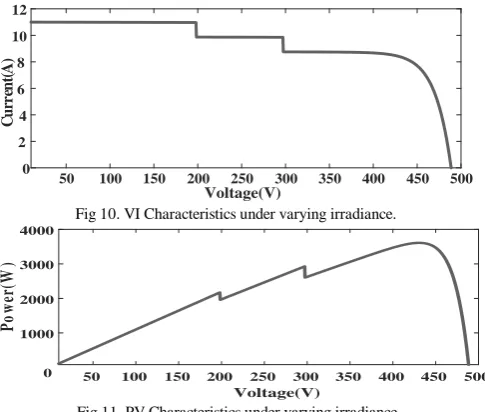
[image:4.595.307.550.442.648.2]CASE 2 - Variation of irradiance and resultant graphs of PV and VI characteristics are obtained as shown in Fig 10 and Fig 11.
50 100 150 200 250 300 350 400 450 500
Voltage(V) 0
2 4 6 8 10 12
C
u
rr
en
t(
A
)
Fig 10. VI Characteristics under varying irradiance.
50 100 150 200 250 300 350 400 450 500
Voltage(V) 1000
2000 3000 4000
P
o
w
er
(W
)
0
Fig 11. PV Characteristics under varying irradiance.
In this case, shading effect adopted is shown in simulation results of VI and PV characteristics shows the change in circulating current, voltage and power are elaborated in Fig 10 and Fig 11.
(A) For irradiance level of 800W/m2, voltage is 200V, current is 8.2A and power is 2kw.
(B) For irradiance level of 900W/m2, voltage is 300V, current is 9.8A and
power is 3.6kw. (C) For irradiance
International Journal of Innovative Technology and Exploring Engineering (IJITEE) ISSN: 2278-3075, Volume-8 Issue-8S3, June 2019
which is considered as rated insolation gives desired rated outputs of voltage, current and power.
CASE 3 – When cloud shading occurs on some panels in one string of PV array:
50 100 150 200 250 300 350 400 450 500
Voltage(V)
0 1 2 3 4 5
C
u
rr
en
t(
A
)
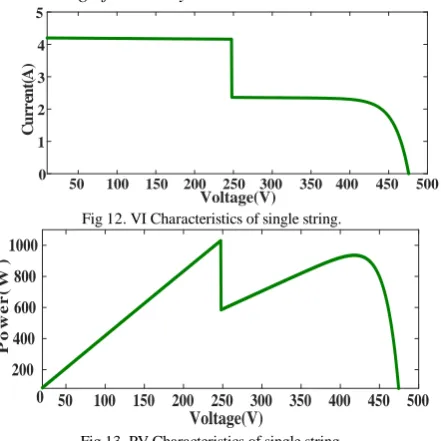
Fig 12. VI Characteristics of single string.
50 100 150 200 250 300 350 400 450 500
Voltage(V)
200 400 600 800 1000
P
o
w
e
r
(
W
)
[image:5.595.61.282.109.330.2]0
Fig 13. PV Characteristics of single string.
Considering only one string of PV array, here the irradiance for the first seven panels to be 700W/m2 and drop in circulating current is 4.2A and for remaining eight panels it is considered as 400W/m2 and corresponding drop in current is 2.8A which further contributes to the change in power as seen from Fig 13. Due to sudden step change in power occurs which is observed by the notches seen from the characteristics. The behaviour of one string of PV array is
shown in Fig 12 and Fig 13.
CASE 4 – When cloud shading occurs on some panels in both strings of PV array:
50 100 150 200 250 300 350 400 450 500
Voltage(v)
0 5 10 15
C
u
rr
en
t(
A
[image:5.595.309.541.147.417.2])
Fig 14. Shading effect of both strings on VI Characteristics of PV array.
P
o
w
er
(W
)
50 100 150 200 250 300 350 400 450 500
Voltage(V) 500
1000 1500
2000 2500 3000 3500 4000
0
Fig 15. Shading effect of both strings on PV Characteristics of PV array.
Exactly similar to case 3 shading pattern is adopted in this case for two strings in parallel of PV array. As a result of this, there is an increase in no of notches as compared to previous all cases. Hence it can be concluded that partial shading contributes to sudden drop in rated value of power and P & O is unable to obtain the MPP. The behaviour of PV array is shown in Fig 14 and Fig 15.
CASE 5 – When cloud shading is varied gradually on PV array:
100 150 200 250 300 350 400 450 500
Voltage(V)
0 5 10 15
C
u
rr
en
t(
I)
50
Fig 16. Gradual cloud variation on VI Characteristics of PV array
50 100 150 200 250 300 350 400 450 500
Voltage(V) 500
1000 1500 2000 2500 3000 3500 4000
P
o
w
e
r
(W
)
0
Fig 17. Gradual cloud variation on PV Characteristics of PV array.
Considering the gradual variation of solar irradiance in both strings of PV array, i.e., on first five panels of both strings irradiance is 400W/m2, current is 7A, on next five panels of both strings it is 700W/m2, current is 11A and on last five panels of both strings irradiance is dropped to 200W/m2 and accordingly current is dropped to 4A. The behaviour of PV array is shown in Fig 16 and Fig 17. As solar irradiance is changing from 700W/m2 to 200W/m2 i.e., tremendous variation of 500W/m2 in insolation is observed on PV array this will cause rapid change in output power which can be easily observed from notches arising in PV and VI characteristics of this case shown in Fig 16 and Fig 17. As irradiance is varied rapidly notches are seen and the maximum power is not achieved.
From results explained in above section it is seen that as insolation changes output of VI and PV characteristics changes accordingly and the behaviour of PV system is observed.
VII. CONCLUSION
The photovoltaic systems are exposed to partial shading during monsoon months in India. Here, the modelling of PV system is done under normal condition and also partial shading due to cloud coverage on PV panels. PV panels are connected in series and
[image:5.595.51.288.497.760.2]under different partial shading are obtained. After observing these waveforms it is concluded that due to different radiation on different panels of the string P&O is unable to identify the global maximum output and hence notches are observed. P&O MPPT controller controls the duty of boost converter. Boost converter boost the PV array output voltage. P&O is reliable tracking method under gradual variation in radiation and able to obtain global maximum but it fails to obtain global maxima when fast moving clouds has shading effect on the PV array. This limitation of P&O method is to be overcome through fast approaching techniques.
REFERENCES
[1] B. Subudhi and R. Pradhan, “A Comparative Study on Maximum Power Point Tracking Techniques for Photovoltaic Power Systems”, IEEE Trans. Sustainable Energy, vol. 4, no. 1, pp. 89-98, Jan. 2013.
[2] H. Patel and V. Agarwal, “Maximum Power Point Tracking Scheme for PV Systems Operating Under Partially Shaded Conditions”, IEEE Transactions on Industrial Electronics, vol. 55, no. 4, pp. 1689-1698, April 2008. [3] A. Chikh and A. Chandra, “An Optimal Maximum Power Point Tracking
Algorithm for PV Systems With Climatic Parameters Estimation”, IEEE Trans. Sustainable Energy, vol. 6, no. 2, pp. 644-652, April 2015. [4] Shubhajit Roy Chowdhury and Hiranmay Saha, “Maximum power point
tracking of partially shaded solar photovoltaic arrays”, Solar Energy Materials and Solar Cells, Vol. 94, pp. 1441-1447, Jan. 2010.
[5] M. G. Villalva, J. R. Gazoli and E. R. Filho, “Comprehensive Approach to Modeling and Simulation of Photovoltaic Arrays”, IEEE Trans. on Power Electronics, vol. 24, no. 5, pp. 1198-1208, May 2009.
[6] M. Miyatake, M. Veerachary, F. Toriumi, N. Fujii and H. Ko, “Maximum Power Point Tracking of Multiple Photovoltaic Arrays: A PSO Approach,” IEEE Trans. Aerospace and Electronic Systems, vol. 47, no. 1, pp. 367-380, January 2011
[7] Murari Lal Azad a, Soumya Dasb$, Pradip Kumar Sadhu c (Member, IEEE), Biplab Satpati b (Member, IEEE), Anagh Guptab, P. Arvindb “P&O algorithm based MPPT technique for solar PV System under different weather conditions”, International Conference on circuits Power and Computing Technologies [ICCPCT], 2017.
[8] S. K. Kollimalla and M. K. Mishra, “Variable Perturbation Size Adaptive P&O MPPT Algorithm for Sudden Changes in Irradiance”, IEEE Trans. Sustainable Energy, vol. 5, no. 3, pp. 718-728, July 2014.
[9] Nishant Kumar, Ikhlaq Hussain, Bhim Singh, Bijaya Ketan Panigrahi, “MPPT in Dynamic Condition of Partially Shaded PV System by using WODE Technique”, IEEE Trans. Sustainable Energy, DOI 10.1109/TSTE.2017.2669525.
[10] Ravindra M. Moharil and Prakash S. Kulkarni “A case study of solar photovoltaic power system at Sagardeep Island, India”, Renewable and Sustainable Energy Reviews, vol 13 (2009), pp 673-681.
[11] Ravindra M. Moharil and Prakash S. Kulkarni “Reliability analysis of solar photovoltaic system using hourly mean solar radiation data”, Solar Energy 84 (2010) 691-702.
AUTHORSPROFILE
Ruchita S. Chaudhari received her B.E. degree Electrical Engineering in 2017. Pursuing M.Tech in branch Integrated Power System from Yeshwantrao Chavan College of Engineering, Nagpur.