International Journal of Innovative Technology and Exploring Engineering (IJITEE) ISSN: 2278-3075, Volume-8 Issue-9, July 2019
Abstract: This paper proposes a generic Sensor Network (SN) based forest fire detection and management system, which is scalable and readily deployable for all environments and terrains. SN are being deployed in critical and hazardous areas, for monitoring as well as for collection of useful environmental data for analysis. In these particular contexts, active fire detection and management in forest prove to be challenging, especially in areas which are remote, unapproachable or at the epicenter of such incident. The proposed system caters to the above said problem by allowing a visual representation of status of the sensor nodes (in real-time) through the use of web map system, connected to the strategically deployed nodes based on geography. This deployment is enhanced with the usage of a low power, high range and low data rate wireless protocol, for which the lifetime of the nodes can be further increased through an appropriate scheduling. Moreover, a system with environmental sensors and 3 level hierarchical network covering a total of 4 sq. km has been designed, to investigate the feasibility of the underlying system with the experimental scenarios of fire incident at certain nodes. Software modules providing detection functionalities have been implemented as prototype in the proposed system. The real time system has proved to provide a better visualization and real time tracking of the fire incidents, which in turn facilitates the fire management system as a whole.
Index Terms: Sensor networks, Decision support systems, Geographic information systems, Environmental monitoring.
I. INTRODUCTION
SENSOR NETWORKS provide greater benefits than the counterparts due to their low-cost, small-scale factor and smart sensor nodes. Not only can they be employed in critical and hazardous areas, for monitoring or controlling the action, but they can also be deployed to handle everyday tasks. Early sensory units were expensive and lacked the computational and communicational capabilities which fortunately the current smart sensor nodes provide at ease, which can now sense, process, store, and forward data, all being powered by a small battery. Wireless sensor network is a network of randomly deployed nodes that are capable of sensing the environment & capable of communicating the sensed data to a desired destination via direct or multi-hop path. Wireless sensor networks may comprise of a large number of heterogeneous low sampling rate sensors like, seismic, magnetic, thermal, visual, infrared, radar, and acoustic, which
Revised Manuscript Received on July 05, 2019
A. Sharma, is with the Electronics and Communication Engineering Department, Chandigarh University, Punjab, India
B. S. Sohi, is with the Electronics and Communication Engineering Department, Chandigarh University, Punjab, India
S. Chandra, is with Forest Survey of India, Ministry of Environment Forest & Climate Change, Govt. of India, India
are clever to monitor a wide range of environmental parameters. Sensor nodes are used for constant sensing, event location, event detection & local control of actuators. The applications of wireless sensor network mainly include health, military, environmental, home, & other commercial areas as depicted in Fig 1.
Countless applications exist that influence SNs as low-cost solutions for observing the habitat and environment, from military and civilian surveillance and target detection and tracking applications, to precision farming and agriculture, patient monitoring in health care, residential applications like energy management, for safety and efficiency in vehicular networks to outer space explorations.
The diversity of the applications of SNs imposes varying design, implementation, and performance requirements on the SNs. Therefore, for a thorough understanding of the different design and implementation techniques, we must understand
the inherent characteristics of SNs and their smart sensor nodes. This intrinsic nature of the application-specific SNs makes classification and taxonomy explanation difficult and clumsy.Sensor networks can be classified into many types on the basis of following [1]:
A.Node deployment
1) Random: In random deployment, the sensor nodes also called as motes are distributed in an unstructured manner within the target area. Typically, the motes (sensor nodes) are dropped from a plane.
SN Based Forest Fire Detection and Early
Warning System
A. Sharma, B.S. Sohi, and S. Chandra
Fig 1: Applications of SN Application
2) Deterministic: In deterministic mode, the sensor nodes are distributed in a structured manner or we can say pre-planned manner within the target area. The motes are placed manually at specific locations.
B.Node deployment
1) Flat (Single-tier): The Flat architecture SNs are based on flat topology where the network is composed of (mainly) homogenous sensor nodes or heterogeneous sensor nodes. Communication between sensor nodes and sink take place in multi-hop manner.
2) Hierarchical (multi-tier): The hierarchical architecture is based on tree topology where the network is composed of both homogeneous and heterogeneous sensor nodes. The network gets divided into clusters having cluster heads and cluster members. Communication between cluster heads and sink can take place in both single-hop (direct) or multi-hop depending on the distance between the same however communication between cluster head and its cluster members is in single-hop manner.
C.Mobility of Nodes
1) Static: In static SNs, the location of the sensor nodes doesn’t change, they are fixed at their locations.
2) Dynamic (moving): In dynamic SNs, the sensor nodes are
mobile and keep on moving to different locations.
D.Node density
1) Dense: In dense SNs, the number of sensor nodes
deployed within a specific area is very high. This type of network is used in the applications where it is important to detect every event and there is no cost issue.
2) Scarce: Harsh environments make the cost of the sensor
nodes high which in turn forces the deployment of only few nodes in a specified area, such kind of networks are called scarce WSN network.
E.Node Capability
1) Homogeneous: In homogenous SNs, all the sensor nodes
are identical and have same capabilities in terms of sensing, processing and communication.
2) Heterogeneous: In heterogeneous SNs, the sensor nodes
are not identical and do not have same capabilities that is some nodes are more powerful (have higher initial energy) than others.
F.Environment of set up
1) Terrestrial: Here the sensor nodes are deployed on the land in any manner, both random and deterministic, to monitor the surrounding events.
2) Underground: In underground SNs the sensor nodes are
hidden in the ground to monitor underground conditions. 3) Underwater: Here the sensor nodes are deployed under
water to monitor the underwater conditions.
Wireless sensor has proved to be of great help in animal tracking applications [2],[3],[4],[5],[6] and from time to time researchers have been implementing WSN for monitoring environmental changes as well [7],[8],[9],[10],[11] predominantly for glaciers and forest. One such crucial application related to forest environment is Forest fires. Over the past 25 years the world’s forest area has declined from 4.1 billion ha to just under 4 billion ha, a decrease of 3.1 percent leaving only 0.6 ha per capita GFRA(Global Forest
Resources Assessment 2015, 5 yearly report) [12].
In India approximately 1.45 million hectare of forest cover is lost to forest fire every year [13]. Whereas, country wise data is available for many countries, collective data worldwide on forest loss owing to forest fire is not available. Still forest fire is considered as one of the major factors for the loss of forest cover. Governments all around the world have been devising ways to tackle the problem and minimize the effects of forest fire. While many systems have been developed for precautionary measures such as pre- warning systems based upon the climate, topography and remote sensing, at the same time monitoring methods have also been worked out to handle the real time threat.The detection systems are contingent on geographic conditions, terrain, area covered and the available technology in the country. Chief among these technologies are satellite based systems taking satellite images which are specifically designed for the purpose of wildfire detection like Advanced Very High Resolution Radiometer (AVHRR) [14], launched in 1998 and Moderate Resolution Imaging Spectroradiometer (MODIS) launched in 1999 [15],[16]. MODIS is linked with a web service called Web Fire Mapper [17] which detects the fires, as the satellite passes through the region and can be accessed by anyone. Many countries (including India) are using the data provided by MODIS platform to detect the forest fire [18], [19]. Forest Survey of India (FSI) is monitoring (Near Real-Time Monitoring) forest fires of the country since 2004 using remote sensing based system developed by the University of Maryland (USA) and National Aeronautics and Space Administration (NASA) viz. MODIS Rapid Response System [15] and the Visible Infrared Imaging Radiometer Suite (VIIRS) on board the NASA/NOAA Suomi National Polar-orbiting Partnership (SNPP). The detection of forest fires is made on the daily basis through the website http://maps.geog.umd.edu. After collecting the coordinates of the fire spots, FSI maps the forest fires through Geographic Information System (GIS) analysis. The coordinates of all the forest fire spots are then sent to the respective State Forest Departments through fax and email for control during fire season [19].
Satellite based systems issues some major problems such that ,the satellite images (thermal images) picks up spots of high thermal values and these spots can also be created by industrial exhaust, volcanic activity and many other reasons which demands for heavy processing of the images before raising forest fire alarms. Satellite based detection systems are limited by response time as there are intervals in the fire scanning sessions and hence the next position of the fire front is only available after a limited amount of time and that can be easily affected by bad weather [20], also since the fire intensity decreases as a function of distance it is highly unlikely to detect fires at early stages. One way of solving this time gap is taking the images on land, it also gives the advantage that different imaging techniques can be used in terrestrial systems viz. visible spectrum, Infra-Red (IR) (thermal imaging), IR spectrometers, Light Detection and Ranging (LIDAR) [21].
International Journal of Innovative Technology and Exploring Engineering (IJITEE) ISSN: 2278-3075, Volume-8 Issue-9, July 2019
with optical sensors and cameras have been the choice of the forest services across the world [22], [23], [24], [25], [26],[27]. But, the cost and the efficiency makes it difficult to rely upon as an automated system [28], [29]. Such systems often need human intervention to process and take decisions. Three such systems were compared in a study by Australian government in collaboration with the Bushfire Cooperative Research Centre on Australian experience and concluded [29]:
A.Cameras are very likely to perform worse than human observers; they are not suitable replacements for human tower observers.
B.Performance of the optical systems were affected by the atmospheric conditions (fog and daylight)
C.Even though the coverage is quite good (as high as 40 km) but the detection was limited to line of sight.
Other approach of using sensor network is the use of sensors which remain unaffected by the line of sight. No wonder the range is compromised but at the same time the cost is reduced and accuracy of the system increases [30], [31], [32], [33], [34], [35].
The drawback of such systems is that such systems are still in development phase and are constrained by the limitations offered WSN, power and network connection [30], [36]. Application area also offer some challenges since forests are vast areas and secondly fire may damage the nodes affecting the network. But such systems provide a very good advantage of being generic in the sense that such systems can be deployed in any form of forest across the globe except for minor changes in the threshold which define an incident as “FIRE”.
.
II. PROPOSEDSYSTEM
The solution presented in this paper is in the form of a wireless sensor network deployed for the forest area under consideration with the sensors that can detect the environmental changes made by an event such as in this case “fire initiation”. The system proposed is also capable of showing real time visualization of the environmental parameters on a web service for monitoring purpose. Along with providing visual data the system presented here is capable of detecting an incident in real time and issue warnings to the intended users.
A.Network deployment strategy
The concept of hierarchical sensor networks deployed in large areas can be implemented in many real world applications, since the required technology of electronics now exists and is well-proven. In this case, a sensor network is deployed over a forest areas. A grid based network is deployed in a test area of 2 km x 2 km. Homogeneous sensor nodes are deployed equidistant from each other with the separation of 500 meters. One control node is deployed every 1 km at the centre on the grid of 1km x 1 km.
B.Network Architecture
The sensor network deployed here is a hierarchical network
containing three layers:
a) Sensor nodes
b) Local control nodes
c) Central server
Each having different functionality and hardware requirements:
1)Sensor nodes
Each node employs a bundle of sensors to sense the environment nearby (temperature, relative humidity, concentration of the gases in the vicinity and smoke), a wireless communication unit (LoRa) and a processing unit (ESP32) and a battery unit. In user-defined time intervals (5 minutes in this case), the sensors collects the data for a particular node to be checked for any anomaly (threshold can be defined beforehand or relative change can be decided by the user). The node then marks the status flag decided upon the sensor data (based on thresholds) whether there is some anomaly or if everything is fine and decides to send the data.
If some anomaly is detected in any of the sensor data then the same information is conveyed instantly, but , if there is no alarming change in the parameters then data is send at the end of the user defined time interval (30 minutes in this case) depending upon the amount of data that needs to be collected.
2)Control node
The deployment is such that every sensor node is connected to at least 2 control nodes. The control node is LoRa gateway connected via LoRaWAN to the sensor nodes on one side and to the central server via internet on the other side. The role of control node is to collect data from the connected sensor nodes and send it to the central server. The control node has constant supply of energy.
3)Central server
The central server collects all the data from the local control nodes via internet. It holds the latitude and longitude values against each node ID and before the data is processed in terms of validating the anomaly, latitude & longitude values are attachment with the node ID’s.
After the addition of the latitude and longitude values the sensor data is checked for flags.
And following actions are taken depending upon the case:
i. If there is no alarm, then the data is transferred to the web map server with flag status “Normal”.
ii. If there is an alarm flag with the sensor data then the data is checked for the total no of sensors which have crossed the threshold ( temperature, smoke, gas sensors mainly). If there are more than 1 sensors which has the alarm flag then the data is right away mapped on the web server with the flag status as “Fire”.
iii. In case only one sensor has send the alarm flag then the data is discarded and a counter is associated with the node and checked every time the data is received till either the anomaly disappears or the counter reaches n (6, can be user defined too) after which the flag of the node is modified to “Damaged” and forwarded to be mapped on the web server. A warning dissemination system is also available to generate warning messages to the registered users. A database of the registered users (location, phone number, email ID) is stored in the central server. The status of all the nodes are checked in real time and as soon as the status of the node is changed from “normal” to “alarm “ notification and email are send to the registered users of that location and the neighboring locations. Thus, the spatial distribution of the temperature, smoke and gases released during combustion in a forested area is known in real time. In case of a fire incident, sensors nodes will relay the data according to the conditions specified and web server will plot the data which is visually available for anyone who wish to monitor the extend of fire and notifications send to the intended users.
C.Set up the network (initially, after death, replacement)
Initially the nodes will be set manually at a static position. While setting up the node the GPS coordinates of the location are taken and registered in a table alongside the node ID. The node is placed 7-8 meters high from the ground in order to protect the node from the surface fire flames. The connectivity to the control node is checked. If needed the antenna in the form of spiral wire is added to increase the range of transmission. The node is connected to battery and put in an enclosure so as to protect from rain and dew at night. The nodes when sending normal environmental data can be visualized on the WEBMAP as green and while anomaly is detected nodes can be viewed as “RED”. The damaged nodes if any by the fire or worn out of battery power will not transmit the data and if the central server does not receive any data from some node after 30 minutes timer ( during which the node should have send the normal data) then the status of that node is modified as “YELLOW” means damaged.
The damaged nodes need to be replaced by simply allocating the same node ID to the new node as the damaged node which
it is going to replace. Since the latitude and longitude values are linked to the node ID only changing the node with the same ID won’t be much of a problem.
D.Early warning system
Users who intend to get the warnings in case of fire incident in their neighborhood or at a particular location need to register themselves with the central server. It can be done at an interface on the website or as a link to the google form which will save the location of the user.
In case of a fire incident near the designated location chosen by the user, the user will get a notification and they can also keep track of the same fire on the Webmap.
III. EXPERIMENTALRESULTS
25 sensor nodes separated by a distance of 500 meters were set up in a grid of 2x2 km. Out of which each zone of 1x1 km was given a gateway/control node to compile and forward all the data in the zone of 1 sq. km.
The anomaly conditions (fire like conditions) were simulated experimentally by burning a closely packed fuel bed of 2m x 2m (comprising mixed fuel of dry grass, small branches and dry leaves) around the node site. For simulating the destroyed node, the node was simply turned off.
Since, the maximum temperature ever recorded (normal weather conditions) is 50 degree Celsius in the region of experimentation, the threshold for temperature sensor is set beyond this limit for real time fire detection.
The timing for data collection was kept at 5 minutes. But since, transmission consumes energy, in order to reduce energy requirements the transmission interval of the data was kept dynamic depending upon the case
Case 1: When no anomaly is detected data transmission was kept after the time lapse of 30 minutes.
Case 2: In case of an anomaly the data was send right after data processing i.e. every 5 minutes from the node.
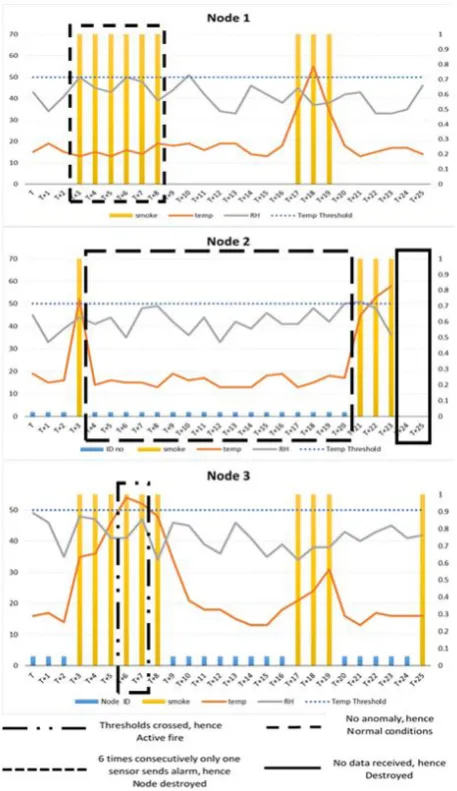
The data collected at 3 different nodes during experiment is displayed in graphs (Fig 3).
All the 4 decision conditions (cases that can be generated by the fire incident) on the collected environmental data have been shown in Fig 3.
Also an instance of dynamic map which was available in real time during experiment is shown in Fig4.
International Journal of Innovative Technology and Exploring Engineering (IJITEE) ISSN: 2278-3075, Volume-8 Issue-9, July 2019
Fig 3. Data generated during experimentation at three nodes
IV. CONCLUSION
This paper presents a WSN-based system for forest fire detection and an early warning system for the same. In particular, it has been applied for tracking the fire incident as
well. Comparing with other detection and early warning systems (providing no information about environmental parameters), the proposed system provides users (authorities
from the forest services) with additional information to analyze environmental conditions and track the movement of forest fire in real-time. The information obtained can be used for analyzing, in details, the effect of ecological conditions (environmental or disturbance factors in the immediate vicinity of roads, villages and water resources) on target species of plants and trees, in order to improve the management of forest fire. This will ultimately mitigate the effects of human intervention on forest fire (since more than 85% of the fires generated in India are anthropogenic). The system uses a combination of environmental parameters (sensed by sensors), together with event identification through the use of detection algorithm. Two different hardware prototypes, the sensor nodes and the control nodes, have been used for this purpose, each of them with its own control and specific application software modules. These prototypes have been used to deploy a hierarchical WSN consisting of 25 of these sensor nodes out of which 4 nodes have been assigned additional duties of a control node, covering an area of 4 sq. km. The constraints which these devices impose on energy consumption have also been addressed by the use of Lora WAN, which is a low power consumption long range and low data rate protocol. For better visualization purpose, the environmental parameters have been shown on Webmap along with the status at the node (viz. normal, no data available and fire incident) in real-time. For general public, provision of notification at the time of fire incident have also been introduced in the form of SMS for the selected area. In order to provide efficient decision support system for management of forest fire, we also plan (as future scope) to predict the spread of fire with the dynamically changing environmental factors, along with the impact of fire suppressing measures in controlling the fire.
REFERENCES
1. J. Zheng and A. Jamalipour, “Network Architectures and Protocol
Stack,” in Wireless Sensor Networks: A Networking Perspective, 1st ed, New Jersey: John Wiley & Sons, Inc., 2008, pp 21-26.
2. A.J.G Sanchez, F.G.Sanchez, F.Losilla, P. Kulakowski, J.G. Haro, A.
Rodríguez, J.V.L.Bao and F. Palomares, “Wireless Sensor Network Deployment for Monitoring Wildlife Passages,” Sensors, vol. 10, no. 8, pp. 7236-7262., 2010.
3. F. Lalooses, H. Susanto and C.H. Chang, "An Approach for Tracking
Wildlife Using Wireless Sensor Networks," In Proc. The International Workshop on Wireless Sensor Networks (NOTERE 2007), IEEE, Marrakesh, Morocco. 2007.
4. R.N. Handcock, D.L.Swain, G.J. Bishop-Hurley, K.P.Patison, T.Wark,
P.Valencia, P.Corke and C.J. O’Neill, “Monitoring Animal Behavior and Environmental Interactions Using Wireless Sensor Networks, GPS Collars and Satellite Remote Sensing,” Sensors vol. 9, no. 5, pp. 3586-3603, 2009.
5. V. Dyo, S.A. Ellwood, D.W. Macdonald, A. Markham, C. Mascolo, B.
Pasztor, S. Scellatyo, N. Trigoni, R. Wohlers and K. Yousef, "Evolution and Sustainability of a Wildlife Monitoring Sensor
Network," In Proc. 8th ACM Conference on Embedded Networked
Sensor Systems, Zürich, Switzerland, 2010, pp. 127-140.
6. K. Mayer, K. Ellis, and K. Taylor, “Cattle Health Monitoring Using
Wireless Sensor Networks," In Proc. Communication and Computer
Networks Conference (CCN 2004), 2004, pp. 8-10.
7. J. Polastre, R. Szewczyk, A. Mainwaring, D E. Culler and J. Anderson,
"Analysis of Wireless Sensor Networks for Habitat Monitoring," In Proc. Wireless sensor networks, Boston, MA, 2004, pp. 399-423. 8. R. Szewczyk et. al., "Habitat Monitoring With Sensor Networks,"
Communications of the ACM - Wireless sensor networks, vol. 47, no. 6, pp. 34-40. , 2004.
[image:5.595.49.297.560.732.2]9. K. Martinez, and J. K. Hart. "Glacier Monitoring: Deploying Custom
Hardware in Harsh Environments," In Proc. Wireless Sensor
Networks, Boston, MA, 2010, pp. 245-258.
10. M. Navarro, T. W. Davis, Y. Liang and Xu Liang. “A study of
long-term WSN deployment for environmental monitoring,” In Proc. 2013 IEEE 24th Annual International Symposium on Personal, Indoor, and Mobile Radio Communications (PIMRC), 2013, pp. 2093-2097.
11. I. Martin, T. O’Farrell, R.Aspey, S. Edwards, T.James, P. Loskot, T.
Murray, I. Rutt, N. Selmes and T. Bauge , "A high-resolution sensor network for monitoring glacier dynamics," IEEE Sensors Journal , vol. 14, no. 11, pp. 3926-3931, 2014.
12. FAO (2015), “Global Forest Resource Assessment (GFRA): How are
the world’s forests changing?” United Nations, Rome, Italy. [Online]. Available: http://www.fao.org/forest-resources-assessment/en/. 13. Forest Survey of India (2017), “Vulnerability of India's Forest to
Fires,” Ministry of Environment & Forests, Govt. of India, Dehradun,
India. [Online]. Available:
http://webline.co.in/fire-alert/vulnerability-of-forest-fire-february-201 7.pdf
14. NOAA satellite and information service, “Advanced Very High
Resolution Radiometer—AVHRR,” NOAA, USA:
http://noaasis.noaa.gov/NOAASIS/ml/avhrr.html
15. NASA, “MODIS, National Aeronautics and space administration,”
[Online] Available: http://modis.gsfc.nasa.gov/.
16. K. Nakau, M.Fukuda, K. Kushida, H. Hayasaka, K.Kimura and
H.Tani., “Forest fire detection based on MODIS satellite imagery, and Comparison of NOAA satellite imagery with fire fighters
Information,” In IARC/JAXA Terrestrial Team Workshop, February,
2006, pp. 18-23.
17. D. K. Davies, S. Ilavajhala, M. M. Wong and C. O. Justice, "Fire Information for Resource Management System: Archiving and
Distributing MODIS Active Fire Data," in IEEE Transactions on
Geoscience and Remote Sensing, vol. 47, no. 1, pp. 72-79, Jan. 2009.
18. Satendra, and A. D. Kaushik (2014), “Forest Fire Disaster
Management,” National Institute of Disaster Management, Ministry of
Home Affairs, Government of India, [Online] Available:
https://nidm.gov.in/PDF/pubs/Forest%20Fire%202013.pdf.
19. FSI, “Forest Fire Alert System 2.0,” [Online] Available:
http://webline.co.in/smsalerts/.
20. Y. Aslan, “A framework for the use of wireless sensor networks in the
forest fire detection and monitoring,” M.S. thesis, Department of Computer Engineering, The Institute of Engineering and Science, Bilkent University, Ankara, Turkey ,2010.
21. EUFOFINET Project (2010-2014), “DETECTION-Synthesis of Good
Practices,” National Forest Centre, Zvolen, Slovakia,[Online] Available:
http://www.onf.fr/++lang++en/projets_europeens/sommaire/projets_a cheves/eurofinet/20111229-102503-858395/8/++files++/3
22. Digital Imaging Systems (1994), “Fire Hawk,” South Africa [Online]
Available: http://www.firehawk.co.za/
23. EYEfi Pty Ltd, “Spatial predictive approximation and radial
convolution,” US patent US9058689B2, Jun 2015.
24. D. Stipaničev, T. Vuko, D. Krstinić, M. Štula and L. Bodrožić, “Forest
fire protection by advanced video detection system-Croatian experiences," In Third TIEMS Workshop-Improvement of Disaster Management Systems-local and global trends, Jan 2006.
25. P. Guillemant and J. Vicente, “Real-time identification of smoke
images by clustering motions on a fractal curve with a temporal embedding method,” Optical Engineering, Vol. 40 No. 4, pp. 554-563, April 2001.
26. R. V. Almeida and P.M. Vieira, “Forest Fire Finder - DOAS
application to long-range forest fire detection,” Atmospheric Measurement Techniques, Volume 10, Issue 6, pp.2299-2311, 2017.
27. G. Hough (2007), “Vision Systems for Wide Area Surveillance: Forest-
Watch—along range outdoor wildfire detection system,” In Proc.
Wildfire, [Online] Available:
https://www.fire.unifreiburg.de/sevilla2007/contributions/doc/SESIO NES_TEMATICAS/ST4/Hough_SOUTHAFRICA_EVSsystems.pdf.
28. S. Mathews, P. Ellis, and J. H. Hurle., “Evaluation of Three Systems”,
Bushfire Cooperative Research Centre, Australia, 2010.
29. D. Schroeder, “Evaluation of three wildfire smoke detection systems,”
In Proc. Wildfire Detection Workshop, ,vol 5 , no 24, Hinton, Alberta, March 25–27, 2003.
30. Y. Zhu, L. Xie and T. Yuan. ,“Monitoring system for forest fire based
on wireless sensor network,” In Proc of the 10th World Congress on
Intelligent Control and Automation (WCICA’10), Beijing, China, July 2012, pp 4245-4248.
31. L. Yu , N. Wang and X. Meng ,“Real-time forest fire detection with
wireless sensor networks,” In Proc. of the International Conference on Wireless Communications, Networking and Mobile Computing (WCNM’05), ,. Wuhan, China, September 2005, pp. 1214–1217.
32. N. Grammalidis, E. Çetin, K. Dimitropoulos, F. Tsalakanidou, , K.
Kose, O. Gunay, B. Gouverneur, D. Torri, E. Kuruoglu, S. Tozzi, S. and A. Benazza, "A multi-sensor network for the protection of cultural
heritage," In Proc. 2011 19th European Signal Processing
Conference, Barcelona, Spain , 2011, pp. 889-893.
33. E. Ngai, Y. Zhou, M.R. Lyu, and J. Liu, “A delay-aware reliable event
reporting framework for wireless sensor-actuator networks,” Ad Hoc
Networks, vol. 8, no. 7, pp. 694–707, 2010.
34. E. M. García, M. Á. Serna, A. Bermúdez and R. Casado, "Simulating a
WSN-Based Wildfire Fighting Support System," 2008 IEEE
International Symposium on Parallel and Distributed Processing with Applications, Sydney, Australia, 2008, pp. 896-902.
35. B.L.Wenning, D. Pesch, A. Timm-Giel, and C. Görg, , “Environmental
monitoring aware routing: Making environmental sensor networks more robust,” Telecommunication Systems, vol. 43, no. 1-2, pp. 3–11, 2010.
36. M. Hefeeda and M. Bagheri, “Wireless sensor networks for early
detection of forest fires,” In Proc. of the IEEE International Conference on Mobile Adhoc and Sensor Systems (MASS ’07), pp 1-6, October 2007.
AUTHORSPROFILE
A. Sharma, has been an Assistant Professor with the Electronics and Communication Engineering Department, Chandigarh University, Gharuan, Punjab. He is the author of 10 articles, and has filed 6 patents with the Indian Patent Office. His research interests include embedded system, internet of things, wireless sensor network and image processing.
B.S. Sohi, is the Pro Vice Chancellor with the Chandigarh University, Mohali, Punjab. He has more than 35 years of experience in teaching and administration. He has authored more than 100 research publications. His research interest
includes wireless networking, computer
networking and wireless sensor networks.