InTrans Project Reports Institute for Transportation
5-2005
Implementing the Mechanistic-Empirical
Pavement Design Guide: Implementation Plan
Brian Coree
Iowa State University
Halil Ceylan
Iowa State University, [email protected]
Dale Harrington
Iowa State University
Follow this and additional works at:http://lib.dr.iastate.edu/intrans_reports Part of theCivil and Environmental Engineering Commons
This Report is brought to you for free and open access by the Institute for Transportation at Iowa State University Digital Repository. It has been accepted for inclusion in InTrans Project Reports by an authorized administrator of Iowa State University Digital Repository. For more information, please [email protected].
Recommended Citation
Coree, Brian; Ceylan, Halil; and Harrington, Dale, "Implementing the Mechanistic-Empirical Pavement Design Guide: Implementation Plan" (2005).InTrans Project Reports. 51.
Implementing the Mechanistic-Empirical Pavement Design Guide:
Implementation Plan
Abstract
The current 1993 American Association of State Highway and Transportation Officials (AASHTO) Pavement Design Guide is based on the empirical interpretation of the results of the 1960 AASHTO Road Test. With the release of the new Mechanistic-Empirical (M-E) Pavement Design Guide, pavement design has taken a “quantum” leap forward.
In order to effectively and efficiently transition to the M-E Pavement Design Guide, state DOTs need a detailed implementation and training strategy. This document is a plan for the M-E Pavement Design Guide to be implemented in Iowa.
Keywords
design guide, implementation, pavement design, pavement performance, training
Disciplines
Civil and Environmental Engineering
Comments
I
MPLEMENTING THE
M
ECHANISTIC
-E
MPIRICAL
P
AVEMENT
D
ESIGN
G
UIDE
: I
MPLEMENTATION
P
LAN
Sponsored by
the Iowa Highway Research Board
(IHRB Project TR-509)
and
the Iowa Department of Transportation
(CTRE Project 03-166)
Department of Civil, Construction and Environmental Engineering
Disclaimer Notice
The opinions, findings, and conclusions expressed in this publication are those of the authors and not necessarily those of the Iowa Department of Transportation or the Iowa Highway Research Board. The sponsor(s) assume no liability for the contents or use of the information contained in this document. This report does not constitute a standard, specification, or regulation. The sponsor(s) do not endorse products or manufacturers.
About CTRE/ISU
Technical Report Documentation Page
1. Report No. IHRB Project TR-509
2. Government Accession No. 3. Recipient’s Catalog No.
4. Title and Subtitle
Implementing the Mechanistic-Empirical Pavement Design Guide: Implementation Plan
5. Report Date May 2005
6. Performing Organization Code
7. Author(s)
Brian Coree, Halil Ceylan, and Dale Harrington
8. Performing Organization Report No. CTRE Project 03-166
9. Performing Organization Name and Address Center for Transportation Research and Education Iowa State University
2901 South Loop Drive, Suite 3100 Ames, IA 50010-8634
10. Work Unit No. (TRAIS)
11. Contract or Grant No.
12. Sponsoring Organization Name and Address Iowa Highway Research Board
800 Lincoln Way Ames, IA 50010
13. Type of Report and Period Covered Implementation Plan
14. Sponsoring Agency Code
15. Supplementary Notes
Visit www.ctre.iastate.edu for color PDF files of this and other research reports. 16. Abstract
The current 1993 American Association of State Highway and Transportation Officials (AASHTO) Pavement Design Guide is based on the empirical interpretation of the results of the 1960 AASHTO Road Test. With the release of the new Mechanistic-Empirical (M-E) Pavement Design Guide, pavement design has taken a “quantum” leap forward.
In order to effectively and efficiently transition to the M-E Pavement Design Guide, state DOTs need a detailed implementation and training strategy. This document is a plan for the M-E Pavement Design Guide to be implemented in Iowa.
17. Key Words
design guide—implementation—pavement design—pavement performance— training
18. Distribution Statement No restrictions.
19. Security Classification (of this report)
Unclassified.
20. Security Classification (of this page)
Unclassified.
21. No. of Pages
38 22. Price
NA
I
MPLEMENTING THE
M
ECHANISTIC
-E
MPIRICAL
P
AVEMENT
D
ESIGN
G
UIDE
: I
MPLEMENTATION
P
LAN
May 2005
Principal Investigator
Brian Coree
Assistant Professor, Department of Civil, Construction and Environmental Engineering Iowa State University
Co-Principal Investigators
Halil Ceylan
Assistant Professor, Department of Civil, Construction and Environmental Engineering Iowa State University
Dale Harrington
Associate Director for Pavements, Center for Transportation Research and Education Iowa State University
Sponsored by
the Iowa Highway Research Board (IHRB Project TR-509)
Preparation of this report was financed in part
through funds provided by the Iowa Department of Transportation through its research management agreement with the
Center for Transportation Research and Education, CTRE Project 03-166.
A report from
Center for Transportation Research and Education
Iowa State University 2901 South Loop Drive, Suite 3100
TABLE OF CONTENTS
ACKNOWLEDGMENTS ... IX
1. INTRODUCTION ...1
1.1. Overview of the Mechanistic-Empirical Pavement Design Guide ...1
1.2. How Does It Work? ...2
1.3. Why Implement the M-E Pavement Design Guide?...4
1.4. Benefits of Implementing the M-E Pavement Design Guide ...5
2. M-E PAVEMENT DESIGN GUIDE COMPONENTS ...8
2.1. Traffic ...8
2.2. Environment...8
2.3. Pavement Structure ...11
2.4. New and Rehabilitated Pavement ...14
2.5. Distress Models...15
2.6. Sensitivity ...15
2.7. Reliability...16
3. VALIDATION AND CALIBRATION OF PERFORMANCE PREDICTION MODELS ...17
3.1. Default Calibration...17
3.2. The Need for Calibration ...17
4. TRAINING ...19
5. RECOMMENDATIONS FOR IMPLEMENTATION ...20
5.1. General Recommendations ...20
5.2. Specific Recommendations...20
5.3. Timeline ...22
5.4. Resources ...23
APPENDIX A. SUMMARY OF RESULTS OF SENSITIVITY ANALYSIS FOR RIGID PAVEMENTS...25
LIST OF FIGURES
Figure 1. Outline of M-E pavement design guide process... 3
Figure 2. Levels of predictive accuracy... 7
Figure 3. Predictive accuracy... 7
Figure 4. Current Iowa climatic sites... 11
Figure 5. Distribution of national calibration sections for fatigue cracking in HMA... 17
LIST OF TABLES Table 1. Site-specific climatic data for Iowa ... 10
Table 2. Rehabilitation options ... 14
Table 3. High sensitivity factors for Iowa ... 16
Table 4. Division of responsibilities ... 23
ACKNOWLEDGMENTS
1. INTRODUCTION
1.1. Overview of the Mechanistic-Empirical Pavement Design Guide
With the release of the Mechanistic-Empirical Pavement Design Guide (M-E Pavement Design Guide) and its associated software, the American Association of State Highway Transportation Organizations (AASHTO) also provided a memorandum that stated the overall aims, status, and caveats related to the release. An abridged text of this memorandum date June 23, 2004 is provided below with comments following:
The 1993 AASHTO Guide for Design of Pavement Structures was based on empirical
equations derived from the AASHTO Road Test. That test was conducted between 1958 and 1960, with limited structural sections at one location, Ottawa, Illinois, and with modest traffic levels compared to those of the present day. As such, designs
accomplished with the 1993 AASHTO guide are projected far beyond the inference space of the original data. The AASHTO Joint Task Force on Pavements (JTFP) in the mid 1990s proposed a research program to develop a pavement design guide based on mechanistic-empirical principles with numerical models calibrated with pavement-performance data from the Long-term Pavement Performance (LTPP) program. The decision was further made to use only validated state-of-the-art technologies in this development program. The research was conducted as National Cooperative Highway Research Program (NCHRP) Project 1-37A under the oversight of an NCHRP technical panel with membership drawn from state DOTs representing the JTFP, the hot mix asphalt (HMA) and portland cement concrete (PCC) paving industries, academia, and FHWA.
This M-E Pavement Design Guide provides significant potential benefits over the 1993 AASHTO guide in achieving cost-effective pavement designs and rehabilitation
strategies. Most importantly, its user-oriented computational software implements an integrated analysis approach for predicting pavement condition over time that accounts for the interaction of traffic, climate, and pavement structure; allows consideration of special loadings with multiple tires or axles; and provides a means for evaluating design variability and reliability. The M-E Pavement Design Guide will allow pavement designers to make better-informed decisions and take cost-effective advantage of new materials and features. The software can also serve as a forensic tool for analyzing the condition of existing pavements and pinpointing deficiencies in past designs.
In the next several years, the task force will work with the FHWA to introduce the guide to the user community through workshops, conferences, and training courses. In this same time period, it will coordinate the continued technical development of the guide, for example, by incorporating reflection and top-down HMA cracking models as they
It must be understood that because the software is a tool for pavement analysis it does not
provide structural thickness as an output. Nor, in its present form, does the M-E Pavement Design Guide lend itself directly to use as a tool for routine, day-to-day production work. The flexible design component does not specifically address recycled materials in HMA or special mix designs such as SMA, although the software does allow for analysis of a broad range of HMA mix design types. Similarly, the rigid design component considers only jointed plan concrete pavement (JPCP) and Continually Reinforced Concrete Pavement (CRCP), but not jointed reinforced concrete pavement (JRCP). Neither the interlocking concrete pavements concept nor geosynthetic
applications are specifically covered in the guide, and the M-E Pavement Design Guide and software are available only in U.S. customary units at this time.
The M-E Pavement Design Guide provides the user with an integrated set of models (climate + traffic + materials), which projects future performance (cracking, rutting, faulting, etc.) through a set of calibrated empirical models.
The current release is only the first draft, meaning that AASHTO has yet to release a provisional design guide. The edition currently available for evaluation will change: some areas of change are already known, while others have yet to be identified and may only come to light during general implementation.
In addition to changes to the current release, the M-E Pavement Design Guide, like its predecessor the AASHTO Pavement Design Guide, will evolve over time. The initial release simple represents a starting point. The evolution will bring into the M-E Pavement Design Guide such considerations, for example, as reflective cracking, as and when that model has been fully developed and validated.
It will take most states approximately three years just to prepare to implement the M-E Pavement Design Guide in its current form. Waiting until other states have implemented the guide will not avoid or shorten the three year pre-implementation phase. Incremental evolutionary “patches,” such as that for a reflective cracking module, will not impact the general pre-implementation process.
Comparison of the cost-effectiveness of alternative materials, features, or designs must be undertaken as a separate activity. This option is not integral to the M-E Pavement Design Guide software.
1.2. How Does It Work?
Pavements perform in response to three primary influences:
• Traffic • Environment
• Pavement (materials and thicknesses)
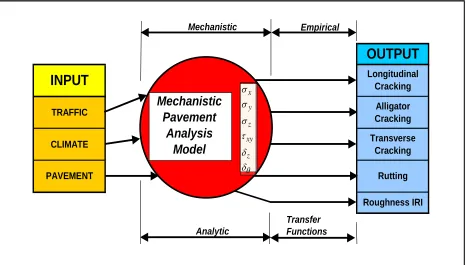
[image:12.612.75.541.207.472.2]The M-E pavement design guide performs a time-stepping process, which is illustrated in Figure 1. Empirical Transfer Functions Mechanistic Analytic Rutting Roughness IRI
OUTPUT
Longitudinal Cracking Alligator Cracking Transverse CrackingINPUT
TRAFFIC CLIMATE PAVEMENT Mechanistic Pavement Analysis Model θ δ δ τ σ σ σ z xy z y xFigure 1. Outline of M-E pavement design guide process
During the process, the following sequence of operations are undertaken. At time = t,
● The temperature and moisture profiles through the pavement are generated for the conditions at time = t (Environment)
● The spectrum of traffic loadings in the next time increment (Δt) are defined (Traffic)
● The elastic properties and thickness of each layer (E, µ, h) are defined from the initial input, the age since construction, the temperature and moisture profiles, and the speed (duration or frequency) of each load (Materials)
● The structural analysis is performed to estimate critical stresses and strains within the structure (Mechanistic)
● An ancillary analysis is performed to determine the non-load-related stresses and strains (i.e., due to thermal and moisture gradients–curling and warping) (Mechanistic)
● The load-related and non-load-related critical stresses and strains are combined
● The incremental distresses are computed based on the critical stresses and strains (or their increments). These include the basic set of distresses or “conditions,” such as rutting, faulting, transverse cracking, roughness (IRI), etc. These may be computed based on calibrated deterministic or empirical models (Empirical)
● Changes in initial material parameters (E, µ) resulting from the computed incremental damage are estimated. For example, if a cement stabilized layer (e.g., E = 2,400,000 psi) is found to have been over-stressed and cracked during this time interval, its effective modulus may be reduced (say to 1,200,000 psi) for the ensuing time interval)
● The time scale is incremented to t = t0 + Δt, and the cycle repeated
1.3. Why Implement the M-E Pavement Design Guide?
The current AASHTO Design Guide is based on methods that have evolved from the AASTHO Road Test (1958–1961). Through a number of editions from the initial publication (1962), the Interim Guide (1974) and other later editions, minor changes and improvements have been published. Nonetheless, these later modifications have not materially altered the original methods, which are based on empirical regression techniques relating simple material characterizations, traffic characterization and measures of performance. Since 1960, the following changes can be noted:
Road Test traffic varied; drivers were moving at about 35 mph; cross-ply truck tires were used with an average of 87 p.s.i. inflation pressure. By the end of the experiment, a total of approximately 1.1 million equivalent single axle loads (ESALs) had been recorded.
Modern highway traffic generally moves 50–70 mph, using radial tires with inflation pressures typically in the range of 100–120 p.s.i., with cumulative design (20-year) traffic repetitions (in Iowa) up to 100 million ESALs.
The environment was specific to Ottawa, Illinois.
The environment in Iowa is not dissimilar to that of Ottawa, Illinois, but not identical either– especially over a typical design period of 20 years compared to the 18 months of the AASHO Road Test.
The subgrade was a CL (low-plasticity clay) with an average California bearing ratio (CBR) of 3.5%.
Iowa subgrade soils cover a wide range of materials from clays, silts, sandy gravels, loess and calcareous outcropping.
Pavement materials in flexible pavement were characterized using “layer coefficients,” which have no physical meaning since they are simply regression coefficients. It has been shown that the layer coefficient for the HMA surfacing used at the Road Test (average 0.44) had a 90% confidence limit range of 0.24 to 0.75; and yet we still assign layer coefficients to newer Superpave mixtures at, or close to, the originally proposed values of 0.42 to 0.44.
and changed significantly in the intervening 45 years, as have the requirements of quality assurance and control. With Superpave mixtures, statistical quality control, and
assurance, there is absolutely no means available confidently to estimate appropriate layer coefficients.
The AASHTO Pavement Design Guide (1962 ff) is a “thickness design” method, designed to provide sufficient thickness for structure. In that regard, it has worked— there is little evidence of insufficient structure on Iowa public highways.
Insufficient structure is not the problem. Current concerns arise from functional distresses or failure (rutting, cracking, faulting, roughness etc.). The M-E Pavement Design Guide is more than just a thickness design tool—it yields predictions relative to the development of each individual distress type and roughness (IRI) over the design life.
From these observations, it is clear that the basis of the current AASHTO pavement design procedures are no longer applicable to conditions in Iowa in the early 21st century.
The M-E Pavement Design Guide relies on actual traffic operating at appropriate speeds and tire pressures using mathematical (not empirical) models to analyze the stress states within the pavement structures under appropriate local environmental conditions, which can change over the span of the design life of the pavement. The stress states at each time interval are used to evaluate and accumulate specific distress types using (mostly) calibrated distress models.
Even if the current AASHTO method could accurately predict the life of a pavement to yield a terminal serviceability of 2.5 after 20 years, there is no way to predict the development of the components of serviceability (rutting, cracking and patching, and roughness) over the design life. What serviceability might be expected after 10 years? What would be the controlling distress type? Its extent? Its severity?
Further, the reliability of the current AASHTO design method is, at least, questionable.
According to the current design protocol, a 20-year 20 million ESAL design might be expected to reach its state of terminal serviceability, somewhere between 7 and 56 million ESALs (or 7 and 56 years!) Alternatively, in order to assure the 20 million ESAL life, the method actually designs for 109 million ESALs (based on a standard deviation of 0.45).
From this example, it can be seen that the current AASHTO design method includes a very large “factor of ignorance” in order to compensate for the uncertainties inherent in the method. The proposed method promises to reduce this level of uncertainty, thereby reducing the level of over-design and conserving resources (materials and cost), while allowing a more accurate prediction of the development of distresses throughout the design period.
1.4. Benefits of Implementing the M-E Pavement Design Guide
different component properties, it is more likely that the benefits will be identified in the long term. These benefits will accrue in a number of areas:
More appropriate designs. Due to the inherently empirical nature of the current design
methods, pavement is inherently over-designed for strength. Other performance measures, such as rutting, thermal cracking, and faulting are not addressed. The M-E Pavement Design Guide method will significantly reduce the degree of uncertainty in the design process, and provide more realistic designs that are appropriate to the type of performance expected. Figures 2 and 3 indicate the type of benefits expected. The M-E Pavement Design Guide approach will allow the Iowa DOT to specifically design pavement to minimize or mitigate the predominant distress types that occur in Iowa.
Better performance predictions. For the design life of pavement, the predicted
occurrence of distresses will be much closer to the actual occurrence. Combined with realistic criteria for design levels of distress, this will lead to significantly less
maintenance and rehabilitation. Currently, although pavements are designed for 20 years, it is common that major rehabilitation may be required as early as 12 years into the design life. The M-E Pavement Design Guide will help ensure that this type of major rehabilitation activity occurs closer to the actual design life, i.e., 20 years. A saving of even 1% in maintenance and rehabilitation frequencies (which is considered
conservative: estimates vary from 1% to 15%) will lead to significant savings in the long term. Iowa spends approximately $400 million annually in maintenance and
rehabilitation; therefore, a 1% savings represents a potential annual savings of approximately $4 million.
Better materials-related research. Since the M-E Pavement Design Guide method is
based on actual material properties, “what if”-type research will enable the Iowa DOT to examine the effects of specification change on ultimate performance. It is likely that over the next five years or so, such questions as “should richer or leaner HMA base mixtures be promoted?” will arise. This type of question can be answered through the use of the M-E Pavement Design Guide, reducing the need to conduct extensive, lengthy, and costly field trials. Many other materials-related questions can be addressed in this manner.
Powerful forensic tool. The M-E Pavement Design Guide software has an interesting and
0 5 10 15 20 25 30 35 0.0 0.5 1.0 1.5 2.0 2.5 3.0 ACTUAL Current AASHTO design
Nationally calibrated MEPDG Iowa calibrated MEPDG
R e la ti ve Fr equ e n c y M e a s ur e of P e rf or m a nc e
0 2 4 6 8 10
Log (traffic)
Figure 2. Levels of predictive accuracy
Current AASHTO Nat'l Calib. MEPDG Iowa Calib. MEPDG
6.0 6.5 7.0 7.5 8.0 8.5 9.0
Log Traffic
Figure 3. Predictive accuracy
2. M-E PAVEMENT DESIGN GUIDE COMPONENTS
2.1. Traffic
2.1.1. Overview of Traffic
Traditionally, traffic has been treated by single numbers, such as the average annual daily traffic (AADT) or by the notional equivalent single axle load (ESAL). In developing the M-E Pavement Design Guide, it was recognized that these parameters do not sufficiently recognize the differing effects of different axle loads and configurations on pavement. Consequently, the use of “traffic spectra” is now recommended. In this approach, the anticipated traffic must be classified by axle type (single, tandem, tridem, etc.), and within each type, the distribution of axle weights is prescribed. Further, daily, weekly, and seasonal volume distributions are possible. In other words, the traffic spectrum approach requires a more realistic knowledge of the actual distribution of axle types, weights and occurrence in time than has been traditional.
2.1.2. Recommendations for Traffic
Iowa DOT is currently well-placed to use the M-E Pavement Design Guide traffic input format. However, a number of specific recommendations are made to increase the success of
implementation:
A joint committee of the Iowa DOT Design Section and Traffic Section should examine the various traffic input screens in the M-E Pavement Design Guide and come to
agreement on the best process to identify and transmit the data to the Design Section.
Project-specific traffic data transfer to the Design Section should be made by electronic means in the required formats, allowing the M-E Pavement Design Guide software to read and complete the traffic data input automatically.
Since many highways in Iowa are low-volume traffic platforms that carry generic traffic patterns, default traffic input files should be created for different functional highway classes, leaving the detailed site-specific traffic analyses to the higher classes of highway and those with significant seasonal imbalances.
2.2. Environment
2.2.1. Overview of Environment
of temperature has penetrated deeper into the pavement, generating an increasing thermal gradient with depth, and so on.
Under this scenario, the temperature vs. depth gradient with cause (i), a modulus (E*) gradient, with depth in HMA materials, and (ii) a warping of a PCC slab, which is expanding at the top relative to the bottom. The continuous variations of air temperature, solar radiation, etc., therefore have a decisive influence on both the structural (load-related) and non-structural (non load-related) states of stress and strain within pavement structures.
In order to incorporate environmental effects within the M-E Pavement Design Guide software, three elements are required: (i) a site-specific environmental data set (external), (ii) a material-specific set of thermal-related properties (heat capacity, thermal conductivity, etc.) (internal), and (iii) an algorithm to compute the transmission of heat (and moisture) within the pavement
structure:
i. The M-E Pavement Design Guide software incorporates a set of environmental data sets for specific locations within the US, with 15 locations in Iowa. The 15 Iowa data sets may be insufficient to derive full benefit from the site-specificity that the software can provide. Further, these data sets provide historical records for between 17 months and somewhat less than 5 years. Ideally, each data set should provide, at least, 11 years of historical data.
ii. The material-specific thermal-related properties required are entered as input with the materials selected for inclusion in the pavement.
iii. The driving algorithm for thermal transmission through the body of the pavement is based on the Enhanced Integrated Climatic Model (EICM) developed at the University of Illinois. The EICM is a very powerful and useful tool. Its successful use, however,
depends critically on the quality of the input data.
The software contains site-specific climatic data for 15 locations within Iowa, as listed in Table 1. The software cycles the available data until the design period is completed, so that, for example, a 20-year design in Marshalltown will concatenate the 5-year
Marshalltown data in the database 4 times to fill the 20-year requirement. Note that for Ottumwa, the same year would be concatenated 20 times. This is unsatisfactory, since repeating the relatively short data spans reinforces any bias in that sample.
Table 1. Site-specific climatic data for Iowa Number of months Site
data collected
Ames 63
Burlington 61
Cedar Rapids 66
Davenport 66
Des Moines 66
Dubuque 66
Estherville 66
Iowa City 66
Lamoni 49
Marshalltown 63
Mason City 17
Ottumwa 17
Sioux City 66
Spencer 63
Waterloo 66
With the M-E Pavement Design Guide, an Iowa DOT pavement designer should be able to
Access climate records for at least two (preferably three) locations within, 25 miles from any specific project site, and/or
Access a regional climate record covering the general area of the state in which the project is located.
Either type of record should be
based on at least 11 years, and preferably 20 years, of actual data, and
pre-checked for quality and completeness
2.2.2. Recommendations for Environment
This project team recommends that the Iowa DOT seek to fill the Iowa site-specific data sets with a minimum of 11 years (preferably 20 years) of continuous data in order to make the data sets more statistically representative. This may have to be done under research contract with the Iowa State University (ISU) Department of Agronomy, which may have the best access to the necessary data.
Figure 4. Current Iowa climatic sites
Inspection by the research team indicates that the variation of environment within Iowa is relatively mild. The M-E Pavement Design Guide may be used for site-specific design in cases where traffic and other considerations demand; however, in most cases, the design will be done in a more generic manner. In this approach, it is recommended that the Iowa DOT seek to identify one or more climatic regions within the state which may be used in a generic design (it would be convenient if these regions should coincide geographically with the Iowa DOT districts). For each such region, the environmental data should be essentially homogeneous and reasonably representative. This may have to be done under research contract with the ISU Department of Agronomy, which may have the best access to the necessary data and analytic tools.
2.3. Pavement Structure
2.3.1. Overview of Pavement Structure
2.3.2. Input Levels
In the AASHTO Design Guide process for flexible pavement, it was necessary to provide a thickness (hi), a layer modulus (ai), a moisture coefficient (mi) if necessary, and a subgrade resilient modulus, Mr. The data requirements in the M-E Pavement Design Guide are more demanding, however, since it is understood that often all material-related input is not known in advance, so the input can be provided at any of three levels of quality:
Level 1 (highest). Level 1 input is the highest quality of data. The input data is obtained
from direct testing on the actual material in question. This level of input is what the M-E Pavement Design Guide uses to model the pavement structure.
Level 2 (intermediate). Level 2 input is used when direct test results are not available, but
results from other testing are, and a relationship exists between them. For example, if the Level 1 data parameter is, the resilient modulus, Mr, of a soil material, but Mr is not available and the user has CBR results on the same material, then by using a known relationship such as Mr = 2555 CBR0.64, the resilient modulus may be estimated. In this case, the CBR may be entered as a Level 2 input.
Level 3 (lowest). Level 3 represents the lowest level of knowledge about the material. At
Level 3, not only are direct test results (Level 1) unavailable, but secondary test results (e.g., CBR) (Level 2) are also not available. Level 3 permits the user to enter a value directly for the needed variable, or to enter some other basic descriptor. For example, if it is known that the soil classifies as a CL (low-plasticity clay) material, this information alone brackets the resilient modulus such that 13,500 psi < Mr < 24,000 psi. This range is already programmed into the software for a CL input.
2.3.3. Structural Elements
Each material must have its structural properties defined as input. These properties are typically the elastic (or resilient) modulus E (or E*) and the Poisson’s ratio, µ. The input of these
properties permits the structural analysis algorithms to estimate critical stresses and strains within the pavement under the applied loadings (traffic spectrum). The information needed is somewhat material-type specific.
Hot-Mix Asphalt (HMA): Since HMA is visco-elastic, its properties depend on
temperature and time (or frequency) of loading. Consequently, it is necessary to provide or estimate the “master curve” of the HMA response. This information is processed internally to the algorithm to yield the dynamic modulus, E*, specific to the temperature and duration of load at the point and time under consideration.
Portland Cement Concrete (PCC): PCC input relies on simple elastic modulus, E, and
Stabilized Materials: Cement and Fly-ash stabilized materials typically behave like weak
concrete – rigid and brittle. For this it is necessary to define an elastic modulus, E, and Poisson’s ratio, µ, as well as a default minimum elastic modulus for the material after it has been overstressed and cracked. Other than Cold Recycled Asphalt (RAP) bases, bitumen stabilized materials are not characterized in the M-E Pavement Design Guide.
Subgrade and Unbound Materials: Subgrade and unbound material inputs are classified
through soil classification (Unified or AAHSTO). Since only Level 2 and Level 3 inputs are implemented in the software at this time, it is recommended that a joint committee (Office of Materials and the Office of Soils) establish, by consensus, a set of input data appropriate to each classification.
The Level 1 model exists within the software, but is not implemented in this initial release. Level 1 testing relies on sophisticated dynamic triaxial testing to obtain the factors k1, k2, and k3 as input to the following relationship (where MR is the Resilient Modulus):
MR =k1pa ⎛⎜⎜ θ ⎞⎟⎟
k2
⎛
⎜⎜τoct +1⎞⎟⎟
k3
⎝ pa ⎠ ⎝ pa ⎠
Since in most cases it is unlikely that project-specific material information (e.g., job-mix formulae) will be available at the time of the structural design, it is recommended that the Iowa DOT determine representative input values for each specification or bid-item in the current specification. For example, a typical input for HMA 30M S L-3 would be
established and used thereafter. Since this input is not currently available, the following sequence is recommended:
• In the absence of actual test results and using the available Level 2 or 3 input options within the software, establish “default” input files for each bid item, e.g.,
“HMA30MSL3est.dat” for the mixture referenced above.
• As projects are awarded and actual production samples become available for the bid item, perform Level 1 testing and replace the generic Level 2 and 3 inputs with actual Level 1 input. Thus, for each bid item, an input file, e.g., “HMA30MSL3.dat” would be created and replace the lower level default data file.
It is further recommended that in parallel with the immediate use of Level 2 and 3 input, the Iowa DOT consider awarding a longer-term third-party research project to undertake the advanced testing, and use the results (k1, k2, and k3) to establish predictive
relationships between the Level 2 and 3 input parameters and these k-parameters; thereby
2.3.4. Non-Structural Elements
In conjunction with the structurally-related input, the M-E Pavement Design Guide program requires a number of non-structural input values. These variously relate to the transmission of thermal energy through the material (heat capacity and thermal conductivity), the rheological properties of the asphalt binder, the specific gravity, hydraulic conductivity and degree of saturation of unbound materials, cross-sectional geometry, etc.
Other factors, such as slab width and length, dowel bar diameter and spacing, pavement cross slope, etc, are variously entered in the traffic and pavement material input screens. These factors are used in various sub-modules to compute the curling and warping of PCC slabs, the
movement of moisture and freezing interfaces, etc.
Sensitivity studies indicate that pavement performance may be significantly sensitive to the thermal properties of the materials. Therefore, the project team recommends that the DOT establish realistic thermal input values for Iowa materials (aggregates, HMA and PCC), i.e., heat capacity (HMA) and coefficient of thermal expansion (PCC).
2.4. New and Rehabilitated Pavement
The M-E Pavement Design Guide can analyze the design of both new and rehabilitated overlay pavements. The major elements, including traffic, environment, and structure (materials) remain the same the AASHTO Design Guide. However, when analyzing rehabilitated pavement with the M-E Pavement Design Guide, the condition of the existing pavement must be defined. This differs slightly between rigid (PCC) and flexible (HMA) pavements, but the input requirements for either both are immediately available from the Iowa DOT Pavement Management
Information System (PMIS) database (it may be necessary to use the falling weight
deflectometer [Office of Materials, Special Investigations Section] to characterize the dynamic modulus of subgrade reaction, k pci).
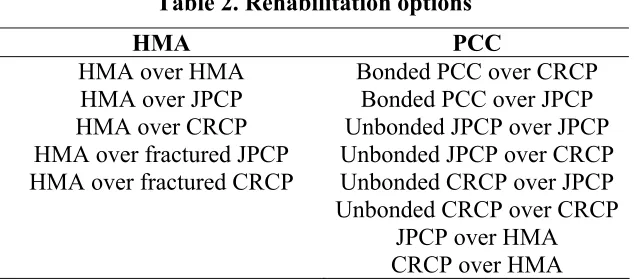
[image:23.612.149.466.549.689.2]The various rehabilitation options available are listed in Table 2.
Table 2. Rehabilitation options
HMA PCC
HMA over HMA Bonded PCC over CRCP
HMA over JPCP Bonded PCC over JPCP
HMA over CRCP Unbonded JPCP over JPCP
HMA over fractured JPCP Unbonded JPCP over CRCP HMA over fractured CRCP Unbonded CRCP over JPCP Unbonded CRCP over CRCP
JPCP over HMA
The project team recommends that a standard form be prepared for use during project concept visits so that condition data and field observations required for input can be properly recorded for use by the pavement design section.
2.5. Distress Models
After the M-E Pavement Design Guide computes the instantaneous state of stress and strain within the pavement structure, the next step is to use these results in combination with calibrated distress models to estimate any incremental damage to the pavement. These incremental amounts of damage are ultimately summed, or integrated, over each successive increment of time.
The distress models used are based in theory, e.g., fracture mechanics. While theory dictates the form of the relationships, most of the relationships will have been calibrated to adjust for real-world conditions. Most likely, many of these models will be improved over the next 10–15 years as further studies are conducted.
Some of these models are currently under investigation for refinement and further definition. However, changes to these models as a result of these investigations will not be made for many years and the Iowa DOT is advised to accept the current models for implementation. The
refinement of these models and their incorporation into the software is beyond the purview of the Iowa DOT.
The laboratory-calibrated distress models, usually conducted under artificial and controlled conditions, cannot reflect all the possible conditions observed in highways. Consequently, the projections of distress made by the M-E Pavement Design Guide program will have to be calibrated to national, regional, or local conditions. The preliminary calibrations built into the program rely heavily on a set of national calibrations based on the LTPP data set. It is important to realize that this default calibration may not accurately reflect local reality. This is further addressed below.
The need for Iowa validation and calibration is clear. The M-E Pavement Design Guide, as released, has been calibrated to national data, which are not necessarily representative of Iowa’s conditions. This is similar to the concept of an automobile whose engine has been tuned for higher elevations in Colorado. Such a vehicle would run in Iowa, but would probably run rather inefficiently and would benefit from tuning to run more efficiently in Iowa.
2.6. Sensitivity
In addition to the factors listed in Table 3, other factors exist that exhibit some degree of
sensitivity, such as joint spacing in PCC slabs. However, this factor exhibits extreme sensitivity only for thin slabs; slabs within the normal range of thickness do not exhibit such high
sensitivity. It should be realized that not all input factors are under the control of the designer, and can be categorized as follows:
• Directly under the control of the designer (e.g., layer thickness)
• May be changed, but will require committee action (e.g., specification committee), such as dowel diameter and spacing
• Should be changed by the designer, but must be known, such as climate, traffic, coefficient of thermal expansion, etc.
Table 3. High sensitivity factors for Iowa
Factor HMA pavement PCC pavement
Extreme sensitivity
Curl/warp effective temperature difference* – D
Coefficient of thermal expansion* – D
28-day compressive strength – D
Dowel diameter – D
Performance grade (PG) binder D –
Initial volumetrics* D –
Heat capacity* D –
Maximum aggregate size D –
Very sensitive
Thermal conductivity* –
D
* It is recommended that this factor be considered in the first round of research.
2.7. Reliability
At meetings held throughout the last 12 months, such as TRB, AASHTO etc., many national experts and professionals have expressed their concern about how the M-E Pavement Design Guide defines and reports reliability. In addition, the manner in which it is estimated is certainly flawed.
3. VALIDATION AND CALIBRATION OF PERFORMANCE PREDICTION MODELS
3.1. Default Calibration
The performance models in the M-E Pavement Design Guide have been calibrated against information in the national LTPP database. Not only is that database somewhat imperfect (as it contains a lot of Level 3 input), but the coverage of appropriate pavement types is somewhat incomplete and Iowa may not be adequately represented. It will be necessary, therefore, to validate the default calibration against Iowa data and recalibrate the default calibrations as necessary.
3.2. The Need for Calibration
[image:26.612.91.520.370.669.2]Figure 5 indicates the locations of LTPP sites used in calibrating fatigue cracking in HMA pavements. Since there was no calibration site in Iowa, it is important that the Iowa DOT (1) validates the M-E Pavement Design Guide output (i.e., how well does the M-E Pavement Design Guide predict pavement distresses when compared to actual PMIS data?), and (2) obtains the necessary field data to provide a local calibration.
Many of the M-E Pavement Design Guide calibrations were carried out in the mid-to-late 1990s. Since that time, more of the state-submitted LTPP program data has passed quality screening and is now available. While it is clear that when the calibrations were undertaken, Iowa was under represented in the LTPP database, that situation either has, or shortly will be, corrected. This will allow Iowa to undertake local validation and calibration activity.
The project team recommends that the Iowa DOT validate performance predictions using available LTPP and PMIS data. This activity will require a number of steps:
• Identify and rank the predominant distress types in Iowa for each pavement type through an examination of the PMIS database.
• Select a statistically significant number of highway sections for each distress type. Use of LTPP sites with these distresses is particularly encouraged.
• Input data appropriate to the last major construction activity on these sections, and use it to predict the development of the relevant distress to the current time.
• Compare the M-E Pavement Design Guide predictions against the LTPP or PMIS measured distresses.
• Determine if the M-E Pavement Design Guide accurately predicts the distress level. If YES, the M-E Pavement Design Guide algorithm for this distress is valid.
If NO, the M-E Pavement Design Guide algorithm for this distress is not valid. Compare the PMIS data to the M-E Pavement Design Guide data to determine adjustment factors for re-calibrating the model.
At this time, the project team cannot make any recommendations for planning and conducting local calibration. First, the need has to be validated and then a statistically valid experiment must be designed, conducted, and its results analyzed. However, there is currently an NCHRP project (1-40B “Local Calibration Guidance for the Recommended Guide for Mechanistic-Empirical Design of New and Rehabilitated Pavement Structures”) whose purpose is to define the activities and requirements for local calibration. It is therefore recommended that until the
4. TRAINING
In order to adequately implement the use of the M-E Pavement Design Guide, it will be
necessary to train all Iowa DOT staff involved with the design process, not just Pavement Design Section staff. Training should be provided for representatives from the areas of traffic, materials, PMIS and special investigations from central and district offices.
During the initial phase (possibly through the first year), the principals in each identified area from the central office should be trained. FHWA supports a number of training activities for state personnel, which may include traditional workshops, as well as technology-enhanced training, such as web-available tele-conferences. Some of this training is targeted at specific disciplines (e.g., traffic, materials, etc.).
It is highly recommended that the Iowa DOT encourage and enable the appropriate personnel to attend and participate in these free training activities. It is understood that in these times of budgetary concerns, out-of-state travel restrictions are in effect. Nonetheless, it is strongly recommended that Iowa DOT personnel be permitted to travel to such FHWA-sponsored events, if only to those held in surrounding states.
The M-E Pavement Design Guide contractors, as part of their contractual obligations, are required to produce training materials and undertake field training. Details of these training activities are not yet publicly available. It is recommended that the Iowa DOT take the earliest possible opportunity to sign-on for such training and sponsor such events within the state.
Iowa DOT has already established a strong relationship with both the Minnesota DOT and Wisconsin DOT. Training may be strengthened by cooperative training with these agencies.
After the principles have undergone initial training, it is recommended that the Iowa DOT, using their own resources (as well as materials supplied from the FHWA or the M-E Pavement Design Guide contractors) and personnel, or by contract with the M-E Pavement Design Guide
5. RECOMMENDATIONS FOR IMPLEMENTATION
5.1. General Recommendations
It is recommended that the Iowa DOT seek to implement the M-E Pavement Design Guide as the preferred approach to pavement design and evaluation. However, immediate implementation is neither feasible nor possible. Therefore, the DOT should seek to position itself such that general implementation is possible in approximately three years, and allow a further two years for full implementation. The following sequence of implementation activities is proposed.
As will be apparent from the following recommendations, resource needs, and projected timeline, the process of implementation constitutes a large number of activities. It is recommended that the Iowa DOT establish a Project Coordinator position. The Project Coordinator will have oversight and responsibility for the implementation process. This is an important position and we recommend that the position be 50% full-time equivalent (FTE). Whether this position is internal or external to the Iowa DOT constitutes a management policy decision outside the scope of this project.
5.2. Specific Recommendations
The following recommendations are numbered. Further reference to them is made by number. The project team makes the following recommendations to ensure successful implementation of the M-E Pavement Design Guide:
1. Examine the various traffic input screens in the M-E Pavement Design Guide and agree on the best process to identify and transmit the data to the Design section. A joint committee of the DOT Design Section and Traffic Section should complete this task. 2. Transfer project-specific traffic data to the Design section electronically and in the
required formats so the M-E Pavement Design Guide software can read and complete the traffic data input automatically.
3. Create default traffic input files for different functional highway classes, leaving the detailed site-specific traffic analyses to the higher classes of highway, such as those with significant seasonal imbalances, etc.
4. Complete the environmental data set with a minimum of 11 years, preferably 20 years, of continuous data. This may have to be done under research contract with the ISU
Department of Agronomy, which may have the best access to the needed data. 5. Add more locations to the Iowa Climatic Database. This may have to be done under
research contract with the ISU Department of Agronomy, which may have the best access to the needed data.
6. Identify one or more climatic regions within the state for use in a generic design. It would be convenient if these regions should coincide geographically with the DOT districts. For each region, the environmental data should be relatively homogeneous and reasonably representative. This may have to be done under research contract with the ISU
7. Determine representative input values for each HMA specification or bid-item in the current specification. For example, a typical input for “HMA 30M S L-3” would be established and used thereafter. Since this input is not currently available, the following sequence is recommended:
a. In the absence of actual test results and using the available Level 2 or 3 input options within the software, establish default input files for each bid item, e.g.,
“HMA30MSL3est.dat” for the mixture referenced above.
b. As projects are awarded and actual production samples become available for the bid item, perform Level 1 testing and replace the generic Level 2 and 3 inputs with Level 1 input. Thus, for each bid item thereafter, an input file, e.g., “HMA30MSL3.dat” would be created and replace the lower level default data file.
8. Determine representative input values for each PCC specification or bid-item in the current specification. Thus, for example, a “typical” input for “PCC Type A” would be established and used thereafter. Since this input is not currently available, the following sequence is recommended:
a. In the absence of actual test results and using the available Level 2 or 3 input options within the software, establish “default” input files for each bid item, e.g.,
“HMAtypeAest.dat” for the mixture referenced above.
b. As projects are awarded and actual production samples become available for the bid item, perform Level 1 testing and replace the generic Level 2 and 3 inputs with actual Level 1 input. Thus, for each bid item thereafter, an input file, e.g., “PCCtypeA.dat” would be created and replace the lower level default data file.
9. Determine representative input values for each stabilized material specification or bid-item in the current specification. Thus, for example, a typical input for fly ash would be established and used thereafter. Since this input is not currently available, it is
recommended that in the absence of actual test results and using the available Level 2 or 3 input options within the software, default input files should be established for each bid item, e.g., “FlyAshest.dat” for the mixture referenced above.
10. Determine representative input values for each soil type. Thus, for example, a typical input for CL should be established and used thereafter. Since this input is not currently available, the following sequence is recommended:
a. In the absence of actual test results and using the available Level 2 or 3 input options within the software, establish default input files for each bid item, e.g., “CLest.dat” for the mixture referenced above.
b. In parallel with the immediate use of Level 2 and 3 input, the Iowa DOT should consider awarding a longer-term third-party research project to undertake the
advanced testing and use the results (k1, k2 and k3) to establish predictive relationships
between the Level 2 and 3 input parameters and these k-parameters, thereby avoiding
the need to test each individual subgrade and unbound material sample that may arise. This approach ultimately lends itself to Artificial Neural Network analysis.
11. Establish realistic thermal input values for Iowa materials, including aggregates, HMA and PCC.
13. Ignore the 90% reliability reported by the M-E Pavement Design Guide until further notice and rely on the 50% reliability output for design and analysis.
14. Validate performance predictions using available LTPP and PMIS data. This activity will require a number of steps:
a. Examine the PMIS database to identify and rank the predominant distress types in Iowa for each pavement type.
b. Select a statistically significant number of highway sections for each distress type.
Use of LTPP sites with these distresses is particularly encouraged. Using the M-E Pavement Design Guide, input data appropriate to the last major construction activity on these sections to predict the development of the relevant distress. Compare the M E Pavement Design Guide predictions against the LTPP or PMIS measured distresses and determine if the M-E Pavement Design Guide accurately predicts the distress. If YES, the M-E Pavement Design Guide algorithm for this distress is valid. c. If NO, the M-E Pavement Design Guide algorithm for this distress is not valid.
Compare the PMIS data to the M-E Pavement Design Guide data to determine adjustment factors for re-calibrating the model.
15. Encourage and enable the appropriate personnel to attend and participate in free training activities. It is understood that in these times of budgetary concerns, out-of-state travel restrictions are in effect. Nonetheless, it is strongly recommended that Iowa DOT
personnel be permitted to travel to such FHWA-sponsored events, if only to those held in surrounding states. It is also recommended that the Iowa DOT take the earliest possible opportunity to sign-on for training and even sponsor events within the state conducted by M-E Pavement Design Guide contractors, who, as part of their contractual obligations, are required to produce training materials and undertake field training. Details of these training activities are not yet publicly available.
16. Establish by consensus a set (or sets) of acceptable performance criteria for highway design.
17. Resolve differences between the measurement units used in the M-E Pavement Design Guide (e.g., % cracks) and the PMIS (e.g., linear feet of crack per mile).
18. Establish criteria for each distress type and functional class of highway. 19. Establish a set of recommendations to enable the pavement designer to make
adjustments to the design to meet performance criteria.
20. Establish a Pavement Design Manual similar to the Construction Manual for use by the
Pavement Design Section.
21. Prepare and submit an implementation report to the Iowa DOT.
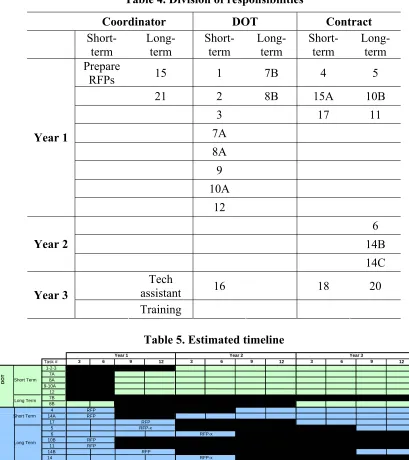
5.3. Timeline
Table 4. Division of responsibilities
Coordinator DOT Contract
Short-term Long-term Short-term Long-term Short-term Long-term
Year 1
Prepare
RFPs 15 1 7B 4 5
21 2 8B 15A 10B
3 17 11
7A 8A 9 10A 12 Year 2 6 14B 14C Year 3 Tech assistant Training
16 18 20
Table 5. Estimated timeline
Task # 3 6 9 12 3 6 9 12 3 6 9 12
1-2-3 7A 8A 9-10A 12 7B 8B 4 14A 17 5 6 10B 11 14B 14 C16 18 20 21 RFP RFP-x RFP RFP RFP-x RFP RFP RFP-x Tr-3 +
Year 1 Year 2
Short Term Long Term Contract RFP RFP RFP Year 3 Short Term Long Term DOT 5.4. Resources 5.4.1. Personnel
The Iowa DOT should expect to establish a 50% FTE project coordinator position.
addition to their normal duties. For those tasks indicated as short-term, this might comprise a few weeks of committee activities. However, those tasks indicated as long-term may require
additional or temporary personnel to complete the activities.
The activities indicated in Table 4 as contractor responsibilities would be funded through an external research contract through the Iowa regents’ universities or CTRE. Without detailed RFP’s from which to develop cost estimates, a global estimate, based on 10% faculty (PI) time and one 50% graduate student, with typical overheads and non-salary items, would cost
approximately $35,000 per year per research contract. In this case, first year estimated costs are $70,000–$100,000, second year estimated costs are $230,000–$290,000 and third year estimated costs are $180,000–$230,000.
5.4.2. Equipment
Equipment costs are more difficult to estimate. The two major equipment items identified are
• Upgrade and establishment of control software for the Iowa DOT Nottingham Asphalt Tester (NAT) and for the ISU NAT. Approximately $25,000–35,000.
APPENDIX A. SUMMARY OF RESULTS OF SENSITIVITY ANALYSIS FOR RIGID PAVEMENTS
JPCP concrete
material inputs Faulting Cracking Performance models Smooth- Input level
ness 1 2 3
Design
fe
at
ur
es
Curl/warp effective
temperature difference ES ES ES ● ● ●
Joint spacing I/LS ES S ● ● ●
Sealant type I I I ● ● ●
Dowel diameter I/LS I I/LS ● ● ●
Dowel spacing I I I ● ● ●
Edge support I S LS ● ● ●
PCC-base interface I I I ● ● ●
Erodibility index I I I ● ● ●
Drai
na
ge and
surface
proper
ties
Surface shortwave
absorptivity I/LS LS/S LS/S ● ● ●
Infiltration of surface
water I I I ● ● ●
Drainage path length I I I ● ● ●
Pavement cross slope I I I ● ● ●
PCC gener
al
proper
tie
s
PCC layer thickness I/(LS) ES S ● ● ●
Unit weight LS S I/LS ● ● ●
Poisson’s ratio LS S S ● ● ●
PCC
therm
al
proper
t
ies
Coefficient of thermal
expansion LS / S ES ES ● ● ●
Thermal conductivity LS / S VS / ES VS ● ● ●
JPCP concrete
material inputs Performance models Input level
Faulting Cracking Smooth-ness 1 2 3
PCC
mi
x
pr
oper
ties
Cement type I / LS I I ● ● ●
Cement content LS / (S) I LS / (S) ● ● ●
Water/cement ratio LS / (S) I LS / (S) ● ● ●
Aggregate type I I I ● ● ●
PCC set (zero stress)
temperature I / LS I I / LS ● ● ●
Ultimate shrinkage at
40% R.H. LS I LS / I ● ● ●
Reversible shrinkage I I I ● ● ●
Time to develop 50% of
ultimate shrinkage I I I ● ● ●
Curing method I / LS I I ● ● ●
PCC
strength proper
ti
es
28-day PCC modulus of
rupture LS / I ES S ●
28-day PCC
compressive strength I ES S ●
Tra
ffic
AADTT S/VS S/LS S/VS ● ● ●
Mean Wheel Location S S S/VS ● ● ●
Traffic Wander I I I ● ● ●
Design Lane Width I I I ● ● ●
Clima
t
e (in Iowa)
Climatic data from
different stations LS LS / S LS ● ● ●
ES = Extreme sensitivity VS = Very sensitive S = Sensitive LS = Low Sensitivity I = Insensitive
● = Applies to a specific input level
Bold = Designer can control directly
Italic = Designer may change, but needs to get permission of a specific committee or the agency
APPENDIX B. SUMMARY OF RESULTS OF SENSITIVITY ANALYSIS FOR FLEXIBLE PAVEMENTS Flexible pavement inputs Performance models
Cracking Rutting Smooth
ness Longitudi
nal Alligator Trans-verse
ACC surface ACC base Sub-base
Sub-grade Total
ACC general
propert
y ACC layer
thickness
S I I I I I I I / LS I
ACC mix p
ropert
ies
Nominal maximum size
S I I I / LS I I I I / LS I
PG grade ES I ES LS / S I I I LS / S LS / S
Volumetric (Vbe/Va/V MA )
VS I VS / ES LS I I I LS LS / S
Unit weight LS /S I I I / LS I I I I / LS I
Poisson’s
ratio LS / S I I S I I I S I
ACC thermal properties
Thermal
conductive S I LS I / LS I I I I I
Heat
Capacity VS I VS LS / S I I I LS / S LS
Tra
ffic
Tire
pressure VS I I LS I I I LS I
AADT VS LS / S I ES S I S ES I
Traffic
distribution VS I I LS I I I LS I
Traffic
velocity VS I I S/VS I / LS I I
S /
VS I
Traffic
Flexible pavement
inputs
Performance models
Cracking Rutting Smooth
ness Longitu
dinal Alligator Trans-verse surface ACC ACC base Sub-base grade Sub- Total
Climate
Climate data from different stations
VS I ES S I/LS I I/LS S S
Base
Layer
thickness S/VS S/VS I VS I/LS I I/LS VS LS
Type of
base (Mr) LS / S ES I/LS VS LS/S I/LS I/LS VS VS/S
Subbase
Layer
thickness LS / S I I I I I I/LS I I
Type of sub-base (Mr)
I I I I I I I I I
Subgrade
Type of subgrade
(Mr ) ES LS I I I I I/LS I/LS I / LS
Othe
rs Aggregate thermal
coefficient I I I I I I I I I
ES = Extreme sensitivity VS = Very sensitive S = Sensitive LS = Low Sensitivity I = Insensitive
● = Applies to a specific input level
Bold = Designer can control directly
Italic = Designer may change, but needs to get permission of a specific committee or the agency