Using Web 2.0 for Scientific Applications and Scientific Communities
Marlon E. Pierce1, Geoffrey C. Fox1,2,3, Jong Y. Choi1,2, Zhenhua Guo1,2, Xiaoming Gao1,2, and Yu Ma1,41Community Grids Laboratory
2Computer Science Department
3Department of Informatics
4University Information Technology Services
Indiana University, Bloomington, IN 47404 {marpierc, gcf, jychoi, zhguo, gao, yuma}@indiana.edu
Abstract: Web 2.0 approaches are revolutionizing the Internet, blurring lines between developers and
users and enabling collaboration and social networks that scale into the millions of users. As we have
discussed in previous work, the core technologies of Web 2.0 effectively define a comprehensive
distributed computing environment that parallels many of the more complicated service‐oriented
systems such as Web service and Grid service architectures. In this paper we build upon this previous
work to discuss applications of Web 2.0 approaches to four different scenarios: client‐side JavaScript libraries for building and composing Grid services; integrating server‐side portlets with “rich client” AJAX tools and web services for analyzing Global Positioning System data; building and analyzing folksonomies
of scientific user communities through social bookmarking; and applying microformats and GeoRSS to
problems in scientific metadata description and delivery.
1.
Introduction
Integrating distributed and Web technologies into the scientific enterprise has been an active area of
research for many years and is commonly called cyberinfrastructure or e‐Science. Much of this research and development has focused on Service Oriented Architectures that are realized through Web service
standards such as WSDL and SOAP and their many associated specifications. While these XML‐based
interface and messaging standards represent a major simplification over the distributed object
technologies such as CORBA that preceded them, they have proven in practice to still be too
complicated. Even though XML was often touted as a “human readable” markup format in its early days,
even the foundation standards WSDL and SOAP are quite complicated and are usually generated by
software tools. This situation is further complicated by the numerous additional specifications for
notification, reliability, security, addressing, and management [1] [2] [3] . Not only do these add to the complexity, but they also have not matured or met with general adoption as we originally expected [4] .
The result of Web service efforts, and of much of enterprise computing in general, has been an
extremely complicated development environment that requires dedicated experts in the underlying
Information Technology. While this may be acceptable for many commercial and governmental
enterprises, it is not desirable in e‐Science. This approach too often ends up treating the scientists as
customers in the Cyberinfrastructure enterprise rather than participants. Obviously this is a poor use of
Web services and Enterprise computing in general. We believe it is worthwhile to adapt these approaches to e‐Science.
Web 2.0 [5] is a catch‐all term commonly applied to a wide range of recent Web activities that range
from Google Map mash‐ups to Blogs and Wikis (with associated RSS feeds) to social networks like
Facebook. As we discussed in previous papers [6] [7] , these generally uncoordinated activities closely parallel Web and network computing but have an emphasis on simplicity and user participation. That is,
many Web 2.0 services such as YouTube, Flickr, del.icio.us and so on have programming interfaces as
well as user interfaces. The “do‐it‐yourself” approach of Web 2.0 (documented by
www.programmableweb.com) is a very attractive model for e‐Science since it would potentially enable
computational scientists and information technology researchers to work more closely together. We
obviously also expect to leverage the extensive online infrastructure of Google, Microsoft, Amazon, and other leading companies.
As an aside, we note the similarity in spirit of the “cloud computing” trend exemplified by Amazon Web
Services, Microsoft Skydrive, and Google App Engine with Web 2.0. These development platforms
resemble Grids in broad terms but exhibit an important asymmetry between the complicated internal
workings of the cloud deployment and the much simpler API that is exposed to the developer. In
contrast, classic Grids and Web Service architecture‐based systems have never adequately made this
distinction.
The remainder of this paper is devoted to four usage scenarios that illustrate the application of Web 2.0 techniques to e‐Science. In Section 2, we investigate the architecture of JavaScript and AJAX approaches
to accessing Grid Services. Section 3 looks at a specific application that integrates server‐side
technologies, Global Positioning System time series analysis Web services, and rich client interface tools.
Section 4 reviews our work building social bookmarking services and the associated folksonomies that
these systems generate. In Section 5 we discuss how we convert metadata for signal image processing data into microformats and how to publish this data in GeoRSS and KML formats. These simple formats allow us to take advantage of several third party tools. Finally, Section 6 concludes the paper and surveys additional related work and future efforts.
2.
Web 2.0 Access to Grid Services
Grid Services such as the Globus toolkit (http://www.globus.org) have adopted and extended several
Web Service standards [8] [8]. Although any number of services can be developed and deployed in a
Grid Web Service container, the job management (WS‐GRAM) and data management (GridFTP and RFT) services are the workhorses for most production Grids. Examples of these production Grids include the TeraGrid and Open Science Grid in the United States. The Java COG Kit [10] provides a popular means of
accessing remote Globus services. The COG provides a powerful abstraction layer that hides the
difference between Grid toolkit versions and also enables composition of services into composite task
graphs. These graphs can be encoded as Java, or they can be scripted and dynamically processed
The power of client tools like the COG Kit is that they can be embedded in any Java application. Thus one can use the COG to invoke Grid services from applets, Java‐based desktop applications, server‐side Java Web tools such as Servlets, and even other Web services.
Web 2.0 applications take advantage of AJAX and similar approaches that make extensive use of
JavaScript with call‐backs to remote servers over HTTP. Messages may be sent via XML, or as we show here, in JavaScript Object Notation (JSON). These are suitable for browser clients, making them active participants in the system rather than simple HTML renderers. This is notably different from Web
service clients, which communicate with potentially complicated SOAP messages. Thus to provide a
Web 2.0 layer for Grid applications, we need to mediate between the AJAX and JSON messaging world of browsers and the SOAP messaging world of services.
From these considerations, we now propose and investigate a Web 2.0 architecture for interacting with Grid services. Our architecture consists of three layers:
• JavaScript clients running in a browser. These compose Karajan workflows that are passed to a
COG‐based agent service.
• An agent Web service that consumes and executes Karajan‐described workflows while
communicating back to the browser using AJAX and JSON.
• The Grid Service layer, consisting of GRAM, GridFTP, and other basic Globus services.
These components are illustrated in Figure 1 and will be described in detail in subsequent sections. Our motivation for building JavaScript client libraries is to simplify the creation of science gateways with “rich client interfaces” in Web 2.0 terminology. That is, we can use client side integration to combine our non‐visual workflow libraries with visual widgets and gadgets. This makes it possible to build highly
interactive user interfaces and also integrate our Grid libraries with visual component libraries such as
the Yahoo! User Interface toolkit and Open Social JavaScript APIs.
JavaScript support is also an important cross‐development framework tool. While the Enterprise
community is dominated by .NET and numerous server‐side Java tools (and Java dominates science
gateway development; c.f. [9] ), PHP, Python, and Ruby on Rails are popular in the Web 2.0 world. All of these are server‐side technologies that can generate or include JavaScript. Thus JavaScript libraries can be used in many different development frameworks.
2.1.
JavaScript
Clients
Our overall goal is to develop JavaScript libraries for interacting with Grid Services. Given the limits of JavaScript Web service clients, we do not interact with the Grid services directly but instead go through
and agent service. JavaScirpt XML limitations are not our only motivation: we furthermore wanted to
prototype alternative message protocols for Grid services. In any case, our motivating problem is the
classic one of running remote codes and staging in and out files associated with the simulation.
more workflows. Workflows in the workflow queue can be executed in arbitrary order, which means that these workflows are totally independent. However, jobs in a specific workflow are usually related so that they must be executed in a certain order.
Our JavaScript clients invoke functions at the agent server by XML‐RPC. XML‐RPC makes use of XML as a
transmission format to invoke remote procedure calls. It specifies how to encode procedure name,
parameters and return value, etc. One advantage is that it is platform‐independent. We use the Jsolait
javascript library for this (http://jsolait.net/). XML is useful for conveying both operational instructions
for the remote service and Karajan XML payloads for the service to execute on the remote Grid services.
At client side, we provide functionality of converting between JSON and XML. XML is a powerful
markup language that has many advantages. However, in some scenarios, it is too complicated and
cumbersome. In web applications, JSON comes with a native support from JavaScript, which makes JSON
perform better than corresponding XML processing. It is also often more succinct and so uses less
memory (an important consideration for browsers). As a result, JSON is supported by many web
applications (such as Yahoo! web service, Google GData, etc). Support for both JSON and XML in client enhances the flexibility of our application.
To ease composition of workflow, we provide client widgets so that users do not need to edit workflow
XML encodings directly. Users can also manage workflow queues and workflows as well as the
dependencies among jobs in a workflow. A user interface is provided to make arrangement of jobs in
any workflow easier.
2.2.
Job
submission
Our agent service uses Apache XML‐RPC toolkit (http://ws.apache.org/xmlrpc/) to handle XML‐RPC
request. After the user is authenticated, the agent receives the job submission request, which consists
of user name and workflow. Then agent transforms original workflow into an internal format. Echo
messages are added to report the progress of execution of the workflow. A unique id is generated for
every workflow of a user. This is called wfid (workflow id). In other words, every workflow is uniquely
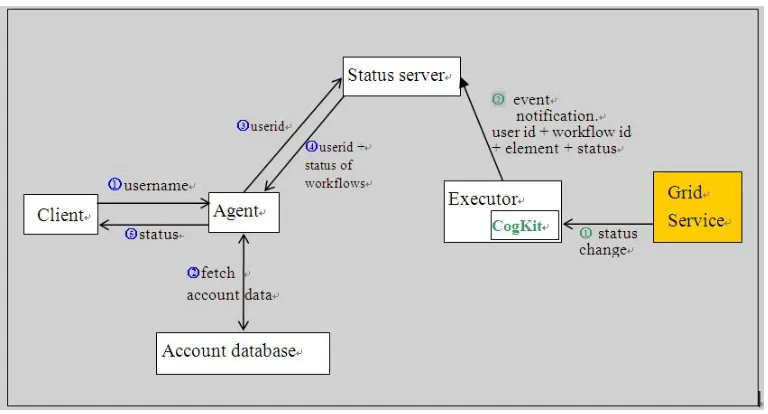
Figure 1 Executor and status service are both wrapped as web services.
After the transformation is complete, the agent sends the original workflow to the status server and
sends the transformed workflow to the executor. Besides the workflows themselves, the agent also
sends the corresponding wfid to the status server and executor. The executor receives transformed
workflow from agent and submits the workflow to underlying grid infrastructure by using Java CoGKit. This process is illustrated in Figure 1.
2.3.
Job
Status
Collection
Status update: When the workflow starts execution, the executor sends a message to the status server to indicate the starting of execution of workflow. During the execution, status messages are generated to report progress of the execution. Every time a status message is generated, the executor sends it to the status server. When the workflow is completed, the executor sends a message to the status server
to indicate the completion of execution of workflow.
One current issue is that we cannot guarantee that messages are received in the order they are sent.
After investigation, we found out that this issue does not have much effect on our application. The reason is that the same set of messages in different order will eventually generate the same outcome. In
other words, the final result depends on message content instead of message order. But during the
status update of a job, disordered messages may affect the user experience. For example, if a user submits a job consisting of two tasks A and B which should be executed sequentially, it is possible that sometime when the user queries status, he/she will see that task B is being executed while task A has
not completed. One possible solution that complies with current open standard is to use WS‐Reliable
Another issue is that messages may be lost during transmission. In our case, if the message of a task is received that indicates that the task is executed successfully, we can deduce that all previous tasks have been executed successfully as well, or else that task would not be executed because of failure of some previous task. Because of this, unordered messages don’t affect correctness. By using this strategy, the
effect of losing messages can be reduced dramatically. In any case, message ordering and
acknowledgement strategies for Web 2.0 messaging need to be investigated.
JSON Representation of Workflows: During job submission, the status server receives the workflow from the agent. The status server builds an element tree based on the workflow. Status data is stored in every node of the workflow. A helper function is provided to serialize the element tree into JSON format. Below is a sample workflow description in Karajan XML:
<project>
<include file="cogkit.xml"/> <execute executable="/bin/rm"
arguments="-f thedate" host="gf1.ucs.indiana.edu"
provider="GT2" redirect="false"/> <execute executable="/bin/date"
stdout="thedate"
host="gf1.ucs.indiana.edu"
provider="GT2" redirect="false"/> <transfer srchost="gf1.ucs.indiana.edu"
srcfile="thedate"
desthost="localhost" provider="gridftp"/>
<set name="date">
<readFile file="thedate"/> </set>
<echo message="The date is {date}"/> </project>
A sample status report in JSON has the format below:
{"uid": "testuser", //userid
"workflows": [ //work flow list
{"wfid":"test_221", //workflow id
"status":"workflow execution completed", //status
"elements":[ //elements(or subtasks)
{"name":"project", //name of an elment
"status":"project completed", //status of the element "statuscode":2, //status code
"children":[ //subelements of this element.
{"name":"include",
{"name":"execute",
"status":"job:execute(/bin/rm) completed", "statuscode":2,
"children":[]},
{ …… }
]}
]}
]}
This structured object can be directly used by client‐side JavaScript.
2.4.
Job
status
query
During job execution, the status server receives status message from executor. The status server
updates status of the corresponding node in the element tree. There are two kinds of status messages. First, we have status messages related to status of whole workflow. Second, we have status messages related to status of a specific element in the workflow.
Check on demand: Every time a client sends a status‐checking request to status server, status server
processes and sends this request to executor that manages execution of the submitted workflows.
When status server gets response from executor, it relays the transmission to return status response to
end users. To some extent, status server acts as a proxy. This mechanism guarantees that the client
always gets accurate and real‐time result. However, it may result in unnecessary workload. Even if the status of a certain job does not change, the whole process must be performed. In this case, a separate status server does not benefit us except that it provides a clearer logic representation.
Update on demand: Every time the status of a job changes, the executor notifies the status server. When a user sends a request to get status of his/her jobs, the agent server gets result from the status
server. However the status server does not need to sends request to executor. By this means,
Figure 2: Steps for status query
Result
retrieval:
The first option is to analyze content of the Karajan workflow to determine output files. However, if we use this method to track all output files, it is difficult and time‐consuming because it is possible that many elements generate output files. As a result, we must capture possible output files from all these elements.
We use another strategy. The newly submitted workflow is executed in a newly created directory. After execution, the new files (except workflow file) in the directory are output files. For the same workflow, we can categorize it based on different criteria. For example, we can categorize a workflow based on the
date on which it is submitted, the date on which it is completed or the user whom it belongs to. We
make use of workflow id and user id to categorize the workflows. All workflows submitted by a user
belong to the same group that can be accessed by this user. Within these workflows, the workflow id is used by the user to access a specified workflow. The id of every workflow belonging to a user is unique. So, the directory layout may look like this:
users/user1/workflow_122/output_file1 users/user1/workflow_122/output_file2 users/user2/workflow_1/output_file1
We provide a RESTful interface by which users can retrieve output files. In our implementation, URLs to access output files look like this:
http://domain:port/resources/user_name/workflow_id/
This retrieves list of all output files for the corresponding workflow.
This will retrieve the specified output file directly. This method obviously has the drawback that the URLs can be guessed, so data is not private. Amazon S3 provides an interesting enhancement on this: one may have URLs that are public but not easily guessable since part of the URL is generated by message hashing with a private key. We are considering these approaches.
3.
Building
web
services
and
portlets
for
accessing
and
analyzing
GPS
data
This section presents the design and implementation of Daily RDAHMM Analysis (DRA) Web Service and
portlet, which are a part of the QuakeSim2 [12] project. Regularized Deterministic Annealing Hidden
Markov Model (RDAHMM) is an application for analyzing time series data. Using no fixed parameters, it classifies the sequence into “clusters” of states. In the case of GPS daily time series data, states typically
persists for several weeks and are altered by various underdetermined (hidden) causes that are not
known a priori. Causes of state changes include both seismic and aseismic activity. State changes can
also indicate mundane events such as equipment problems. It is our goal to provide a view of a large
GPS network’s state using RDAHMM. To provide adequate interactivity that will allow scientists to
interact with the data, we have investigated combining Web 2.0 approaches within QuakeSim’s Web
Services and Web portal framework.
3.1.
Requirements
We have an XML formatted list of 442 GPS stations provided by the Scripps Orbit and Permanent Array
Center (SOPAC) through its Geophysical Resource Web Service
(http://reason.scign.org/scignDataPortal/grwsSummary.jsp), which provides the stations’ position data
every day in three dimensions: east‐west, north‐south, and up‐down. We want to do daily RDAHMM
analysis for all stations in this list. For the DRA web service, we first need to run RDAHMM analysis in
training mode on the coordinate data of every station to build a RDAHMM model for each station, and
then run RDAHMM analysis every day in evaluation mode for every station, and get their day‐to‐day
state change trace during the time period from 1994‐01‐01 to the current day. For the DRA portlet, we need to present the state change trace of all stations in a way the supports rich user interactions, so that
the user can choose to check the state change trace of any station on any date, as well as fetch their
3.2.
Design
and
Implementation
of
DRA
web
service
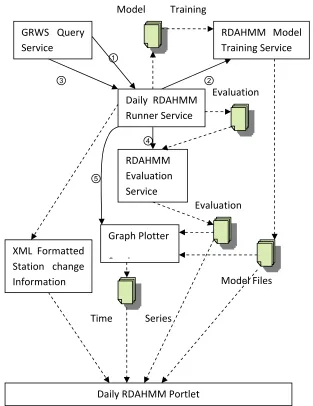
The web service architecture for daily RDAHMM analysis is shown in Figure 3, and the DRA web service
involves steps 1 to 5 of the figure. The Daily RDAHMM runner service in the figure is the basic driver
service of the whole DRA service process. After starting up, the daily RDAHMM runner creates a list of all stations, each of which is marked as not evaluated for “today”. Then it creates a certain number (which can be set as a service argument, with a default value of 8) of threads, each of which will keep getting the next unmarked station from the station list, and does the following analysis for this station:
① Check if the RDAHMM model of this station has been built yet. If yes, go to step ③;
otherwise call GRWS query Service to fetch the coordinate data from 1994‐01‐01 to 2006‐09‐30
of this station, and trim this data to a properly formatted model training input for RDAHMM
analysis;
GRWS Query
Service
Daily RDAHMM
Runner Service ①
RDAHMM Model
Training Service
② ③
④ RDAHMM Evaluation Service
Model Files Evaluation
Evaluation
Graph Plotter
S i
Time Series
⑤
XML Formatted
Station change
Information
Daily RDAHMM Portlet
[image:10.612.127.440.111.517.2]Model Training
② Call RDAHMM model training Service to run RDAHMM analysis on the trimmed data in training mode, so as to build the RDAHMM model for this station;
③ Call GRWS query service to fetch the coordinate data from 2006‐10‐01 to “today” of this
station, and trim this data to a properly formatted evaluation input for RDAHMM analysis;
④ Call RDAHMM evaluation service to do evaluation for this station on its evaluation input,
generate its state change trace from 1994‐01‐01 to “today”, and save this trace both as a
separate evaluation result file, and in an xml result file;
⑤ Call graph plotter service with the evaluation result and model files as inputs. The service will use gnuplot to plot the time series coordinate trace from 1999‐01‐01 to “today” for the station in all three directions. There is one point for the station’s coordinate on each day in the plot, whose color depends on the state of the station on that day;
⑥ Mark this station as evaluated for “today”.
After all stations have been evaluated for “today”, all of the threads will go to sleep, and then wake up again at 4:00am on the next day to do evaluations for all stations for the next day.
The dates above are somewhat arbitrary. The GPS network’s time series data for the earliest stations is available from GRWS back to 1994, but most stations were added more recently. The date of 2006‐09‐
30 is chosen as the end of the training period for RDAHMM. RDAHMM’s sensitivity to the size of its
training data is beyond the scope of our current work, although aiding the RDAHMM developer in this
investigation is a possible future application. We must also in the future provide a strategy for retraining stations after long operational periods.
Some of this data processing may be transferred to cluster scheduling software such as Condor.
Condor’s Web Service interface (Birdbath) simplifies the integration with our Web Service infrastructure.
3.3.
Design
and
Implementation
of
the
DRA
portlet
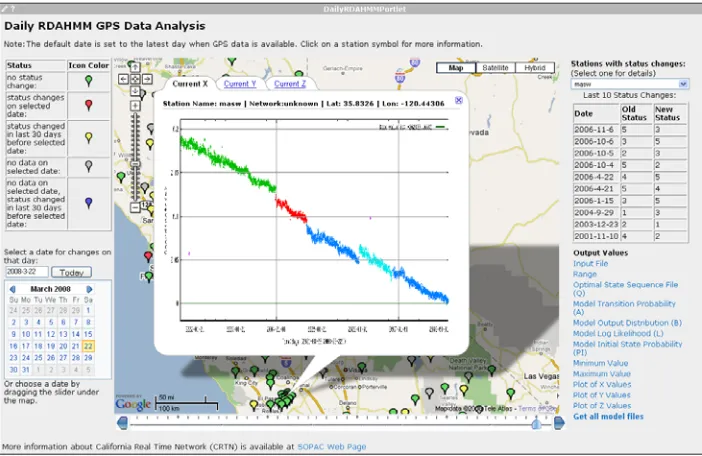
We build a Daily RDAHMM portlet in the QuakeSim2 portal to provide a rich user interface to access the DRA results, as shown in Figure 4.
We use Google Map and markers to show all stations’ state change information, as well as YUI calendar and slide bar gadgets to provide a convenient interface for users to select a specific date that they are interested in. We create one marker for each station at its location on the map. When a date is selected, markers of different colors will be shown on the map. The color of a marker denotes the state change
information for its corresponding station: green for no state change, red for state change on the
had a state change in last 30 days before, its color will be blue instead of grey. When a station’s marker
is clicked, a tab window will pop up, which shows the plots for the coordinate data of that station in
three directions for the whole time period from 1994‐01‐01 to “today”. At the same time, the station’s
last ten state changes will be shown on the right side of the portlet, along with links to its evaluation
results and model files.
Here we have two challenges in implementing the portlet. The first one is the large amount of state
change data for all stations. We have 442 stations in total, each of which has 0 to hundreds of state changes during the whole time section from 1994‐01‐01 to “today”, as well as hundreds of time sections when there is no GPS data for it. Since we have to recheck all station’s whole state change traces and no‐data time sections to further recolor their markers whenever a new date is selected, completing such a large amount of computation is infeasible for client side scripts such as JavaScript. Therefore, we use the server‐side managed bean technique to move this computation work from the web browser to the portal server. We create one managed bean, DailyRDAHMMResultBean, for the portlet, which provides an interface (function) for computing the color for every station whenever a new date is selected by the
user, and the parameters and returned results of this interface are both passed by hidden html input
box components. We reduced the response time of the portlet by a large amount by using the server for processing. For instance, while it takes as long as 3 seconds for JavaScript codes to compute the colors
for nearly 100 stations, the managed bean can complete the same computation for all 442 stations in
around 40ms. In addition, the loading time of the portlet is also brought down from over 1 minute to
about 10 seconds, according to the test on a computer located in the subnet as the portal server.
The second challenge is the time needed to create markers for all stations. Since the total time needed for creating the markers is linear to the number of stations, reducing the number of stations involved in
the creation is helpful in shortening the portlet’s response time. Therefore, instead of creating all 442
stations’ markers at one time when a new date is selected, we create the markers inside the current
Figure 4 Daily RDAHMM Analysis Portlet. The station state color key is shown in the upper left. The calendar and slider bar can be used to view system states on selected days. The right column shows the dates of state
changes for selected stations and links for the RDAHMM analysis input and output files.
Thus the user interface needs to combine several different strategies: AJAX, in‐browser client‐side
processing, and server‐side processing.
4.
Web 2.0 techniques for scientific community – Folksonomy Analysis
Folksonomies, also known as collaborative tagging or social indexing, have been used to annotate
Internet objects such as documents, Internet media, URLs and so on simply by using keyword “tags” [13]
[13]. This concept is often used in social bookmarking sites such as del.icio.us, CiteULike, and Connotea.
Any list of keywords can be used when describing the bookmarked URL. Even neologisms (like “to‐do”) can be used as tags [15] . Due to their simple semantics, folksonomies are widely applied in the Internet. The real usefulness of folksonomies comes from collaboration. Tagging can be done collaboratively by
multiple users and the accumulated list of tags can represent the knowledge from people. For those
reasons, folksonomies can be used as a way to collect people’s knowledge for annotation,
recommendation, and classification. Folksonomy analysis is thus useful for building systems that can
manage user driven information.
Although the analysis of folksonomies is an important task to search information and discover
meaningful knowledge produced by people, the task is challenging. This is because i) the volume of data to process is huge, ii) the data is dynamic rather than static, and iii) the meaning of tags is not uniform:
the same tags can be used in different contexts by different users. Thus, developing efficient methods
for folksonomy analysis is required. Research on folksonomy analysis can be performed in three
directions: document searching, community discovery, and recommendation systems. We will discuss
4.1.
Document
Searching
Searching documents in folksonomies is a basic and an important task. The techniques for searching
documents can be easily extended to schemes for searching other objects, like users or tags [16] .
For indexing documents in the field of information retrieval, two models have been widely used: the
vector space model and the graph model. For examples, Latent Semantic Indexing (LSI) [17] , which is
one of the most popular search algorithms, uses the vector space model for indexing and measuring
similarities between documents. The famous rating algorithm PageRank [18] used by Google is based on
the graph model. Although both models share many similarities, they have their own distinct
characteristics. While the vector space model is easy to apply, the graph model requires more
computational efforts but has advantages in taking into account between‐object relationships which are commonly observed in various social networks.
The vector space model associates each document with a collection of keywords, which is also known as bag‐of‐words model. In the vector space model, representing each document with a q‐length vector, we can describe the collection of n documents as n‐by‐q matrix A = [wij], where wij is a weight of the
occurrence of the jth tag in the ith document. Among various weight schemes used in practice, the most
popular schemes are Term Frequency (TF) and Term Frequency‐Inverse Document Frequency (TF‐IDF)
[19] . With the document‐tag matrix A, the LSI scheme can find the most statistically significant factors
by computing eigenvalues and eigenvectors and measure query‐document similarities to output the
most overlapping and meaningful documents for given user input queries. Regarding the similarity
measurement between queries and documents, Cosine, Jaccard, and Pearson schemes are commonly
used [20] .
Although the vector space model can be easily applicable for searching documents in folksonomies, it
lacks ability to estimate fine‐tuned document‐document (or tag‐tag) similarities. In fact, the vector space model measures similarities in a uniform way. For an example, a folksonomy can be depicted as a graph,
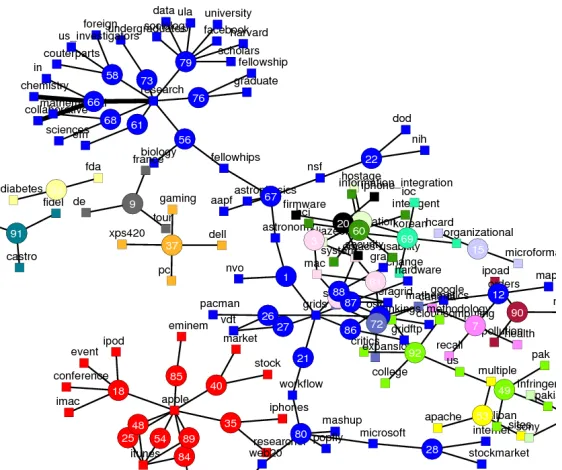
which is known as a tag graph, where tags and documents are represented as nodes and their
connections as edges (See Figure 5). In the tag graph, similarity can be measured as the edge distances, and it can vary depending on the en‐route paths if two nodes are apart, whereas the vector space model treats them equally. This is the intuition of the graph model.
Figure 5. An example of tag graph taken from the MSI‐CIEC portal (http://www.msi‐ciec.org). In the graph, tags (squares) and documents (circle) are represented as nodes and their connections as edges.
4.2.
Discovering
Communities
Discovering communities is also important task in folksonomy analysis [21] and compliments the more explicitly managed social networks of systems such as Facebook. Dimension reduction and clustering are mainly used for this purpose. Dimension reduction is a process to reduce high‐dimensional data, which
is commonly observed in folksonomy data, into ones in human‐recognizable dimensions and helps to
visualize the data for human analysis. Various dimension reduction schemes and visualization
techniques have been studied in the literature. Multi‐dimensional Scaling (MDS) [22] and Laplacian
Eigenmaps [23] are commonly used in the field.
As shown in Figure 6 for an example, a part of folksonomy data obtained from our in‐house social
application, the MSI‐CIEC Social Networking Web [13] [13], has been visualized by using the classical MDS and Laplacian Eigenmap schemes. In the graphs, document‐document similarities are projected in 2‐dimension, in which circles and edges represent documents and their direct‐relatedness respectively.
Choice of dimension can vary depending on the level of abstraction. Based on these graphs, we can
Figure 6. Examples of 2‐D representation of Classical Multidimensional Scaling (left) and Laplacian map (right) of folksonomy data, showing document‐document similarity. Data has been taken from the MSI‐CIEC Social Networking Web [13] .
Clustering analysis is a technique to classify unlabeled data into groups. Numerous algorithms have been suggested and developed in many fields. Hierarchical clustering [24] [24], K‐Means [25] [25], and
Deterministic Annealing [26] [26] are examples. The challenges to applying these well‐known techniques
to folksonomies include choosing the optimal parameter space and pursuing global solutions. For
example, since the nature of folksonomy data is unsupervised and includes no explicit information about clusters, it is difficult for a user to choose the correct number of clusters, which is an important
parameter in using K‐Means or Deterministic Annealing method. Furthermore, due to the high
complexity of the folksonomy data, the results of clustering are often trapped in local solutions and fail
to output unique global solutions, unless we use the right algorithms. Deterministic Annealing is the
best known for avoiding local solutions.
4.3.
Applications
Various applications can be developed in the form of online services by the analysis of folksonomy data. Text analysis of tag data can be used to build an auto‐complete function, by which a system can guess user’s intention in an on‐the‐fly manner from the uncompleted input of tags. Such systems have a side effect of propagating folksonomic definitions.
Furthermore, a service can be developed to recommend for a user a set of the most relevant tags that have been frequently used by others but ignored by the current user. In this way, a user can easily
obtain other people’s knowledge through the system. For developing more sophisticated and user‐
tailored recommendation systems, we can combine other data sources, such as user profiles and user
tagging or social activities. An example using user profile can be found in [27] [27].
Trend detection is also an interesting application. Temporal analysis of folksonomy data can reveal
users to keep up with up‐to‐date topics. Trend detection using folksonomy data can be found in [28]
[28].
5.
Applying Microformats and GeoRSS to Polar Science Field Data
The Center for Remote Sensing of Ice Sheets (CReSIS, https://www.cresis.ku.edu/) is an NSF‐funded
project for collecting field data and modeling the changes of glaciers in the Arctic and Antarctic. The
associated Polar Grid project (http://www.polargrid.org) acquires computing hardware that supports
image processing of data in the field. During the 2007 Arctic campaign, the CRESIS team will take up to
1.2 Terabytes of Synthetic Aperture Radar (SAR) image data per day. Processing at least some of this
data in the field is crucial since it can help team members adjust their campaigns or, more mundanely
but importantly, detect problems with the data or equipment. It is also desirable to share interesting
images and associated metadata with team members back at the home universities. All of this must be done over modest bandwidth, and communication is costly.
The operational flow for the field researchers is as follows:
• SAR data is collected in two daily flights.
• Data is uploaded to the Polar Grid field cluster.
• Selected data is processed using parallel signal image processing codes. These codes’ outputs
include processed image files and metadata about the images (such as the location, information about the radar, etc).
• A subset of this data (chosen by the field team) is transferred back to host servers at Indiana
University using rsync. The metadata is stored in a web accessible MySQL database.
• Upon request, the database can emit GeoRSS encoded versions of the transmitted field data.
The metadata is reformatted into browser‐compatible microformats, and each metadata group, along with the processed images, forms an entry in the GeoRSS feed.
• Alternatively, the user can request Google Earth‐compatible KML version of the information.
RSS and Atom feeds are popular ways for syndicating time‐stamped content such as news items or blog entries. As we have discussed in [6] [6], these are essentially the Web 2.0 equivalent of the SOAP
envelop and can be used for machine‐to‐machine as well as machine‐to‐human communication. RSS
feeds are readable by numerous clients. GeoRSS is a variation of RSS and Atom that includes simple
geographic tags (for latitude and longitude) in the feed. GeoRSS is an Open Geospatial Consortium
standard that has been notably adopted by Google Maps. Google Maps will convert the feed entries
into clickable icons at the provided coordinates, and the content of a feed entry can be viewed by clicking an icon.
5.1.
Microformats
Microformats are very useful markups for name‐value pairs, from which we can build up more extensive
semantic descriptions. Consider the GEO microformat, which can be used to encode latitude and
<span class="longitude">-2.193</span>• <span class="latitude">52.686</span>• </span>
Anyone can define a microformat by extending XHTML with <div> or <span> tags (the choice is somewhat arbitrary). Microformats will be treated as regular XHTML by default but may have additional
tool support. We review several examples below. We use the “pg” namespace to denote our
definitions. Thise serves as a somewhat simplistic shield against name conflicts. The World Wide Web
Consortium’s Gleaning Resource Descriptions from Dialects of Languages (GRDDL) markup
(http://www.w3.org/2004/01/rdxh/spec) is a possible future candidate for managing these namespaces if Microformats proliferate.
We use Microformats for describing metadata about the signal image processing runs and the
associated SAR data. We present several examples that show various data types that we model. The full
example is documented at http://tethealla.blogspot.com/.
Units: Measured values and their units are expressed as below: <span class="pg:delay">
<span class="pg:value">2.5</span> <span class="pg:unit">ms</span> </span>
This illustrates the simple compositional property of Microformats. There is no overarching schema for
our definitions, so these formats will not be validated except as XHTML. Format enforcement must
come from higher‐level tools.
Data Objects: Building on our earlier examples, we can encode composite objects using smaller format
pieces, and we can reuse other microformats where appropriate. Below is a “data‐chunk” object
containing time stamps and geo‐location information. Note we reuse the GEO format discussed
previously.
<span class="pg:data-chunk">•
<span class="pg:name">Start/Stop</span>
•<span class="pg:utc-timestamp">1202755351.892651</span>• <span class="geo">•
<span class="longitude">-2.193</span>• <span class="latitude">52.686</span> </span>
</span>
Arrays: XML is notoriously verbose when expressing array structures (e.g. SOAP array encodings). Below
we give our encoding of an object array in a composite microformat. Each element of the array is an
“antenna” object with various properties. The array size is specified using the “array‐size” attribute. <span class="pg:antenna-array">•
<span class="pg:array-size">2</span>• <span class="pg:antenna”>
<span class="pg:attenuation">0</span>• </span>•
<span class="pg:antenna”>
<span class="pg:id">1</span>• <span class="pg:type">TX</span>• <span class="pg:attenuation">0</span>•
</span> </span>
5.2.
GeoRSS
and
Tools
Following the above conventions, we are able to encode all of our metadata in a specific set of
measurements in a set of microformats. This formatted data is (in the absence of any additional
validating and processing tools) just XHTML. Each piece of metadata contains both time and location, so we can encode this as GeoRSS. A sample entry in the feed is shown below.
<entry>
<title>Data Chunk: 2008-03-11 11:55:41</title> <id>
tag:pg3.ucs.indiana.edu,2008:polargrid expedition-2008-05-262</id> <updated>2008-03-11T11:55:41Z</updated>
<content type="html">
… (data chunk metadata described in microformats) … </content>
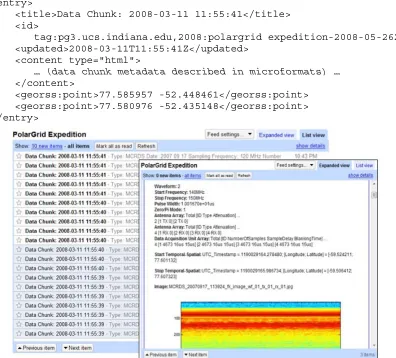
[image:19.612.110.506.282.640.2]<georss:point>77.585957 -52.448461</georss:point> <georss:point>77.580976 -52.435148</georss:point> </entry>
Figure 7 The Polar Grid GeoRSS feed is consumed by a Google Reader client. The inset shows the contents of one of the entries.
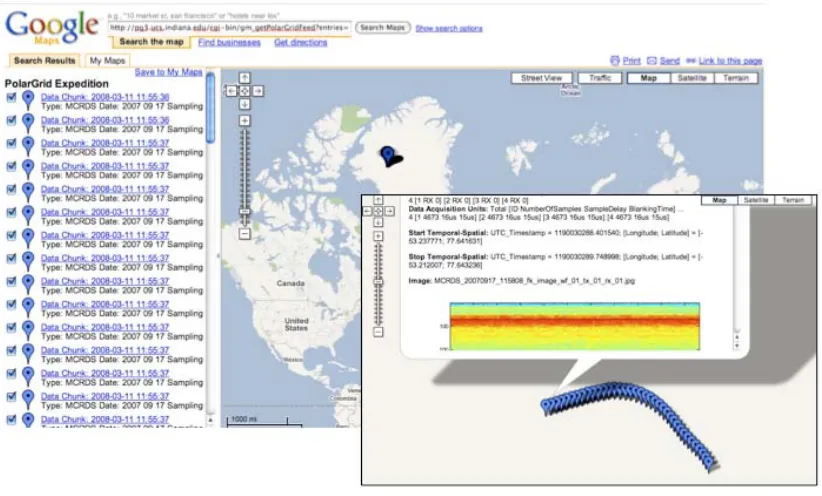
The content of the entry is an instance of the microformat that we outlined in the previous section. The value of using GeoRSS is that it can be easily consumed by several different tools, including both general‐purpose RSS readers and Google Maps. This is illustrated in Figures 7 and 8. We note no additional coding of the mash‐up (Figure 8) is required. Note also the microformatted entry data is rendered as HTML in all cases. Thus by using this simple format, we can capture metadata information while leveraging many different tools.
[image:20.612.78.489.193.441.2]
Figure 8 The Polar Grid GeoRSS feed rendered using Google Maps. The same feed is used as in the previous figure. The feed contents are displayed by clicking the location of the measurement. (inset).
6.
Conclusions
In this paper we have reviewed several activities we are undertaking to apply Web 2.0 approaches to
cyberinfrastructure projects. We discussed the application of JavaScript and JSON as an environment for building clients to access Grid services. We also surveyed the integration of older technologies (such as portlets) with newer technologies and approaches (AJAX and reusable JavaScript libraries) through the
Daily RDAHMM Analysis of GPS station data. Folksonomies underlie many Web 2.0 applications,
including our social bookmarking and tagging work on the MSI‐CIEC portal. We discussed our efforts to
analyze this data in order to help users manage information. Finally, we provided examples of using
Microformats and GeRSS to manage field‐collected SAR data.
Much of our efforts are in their early stages and need further investigation. In particular, the security
requirements of JavaScript Grid client libraries will need to be addressed. SSL and HTTP authentication
provide minimal security, but the dynamic, mutable nature of JavaScript introduces many new
Other research and development groups are investigating the application of Web 2.0 and cloud
computing to scientific problems. Two prominent examples include MyExperiment
(http://www.myexperiment.org/) and SciVee (http://www.scivee.tv/). MyExperiment is designed to
allow users to share and rate scientific workflows and bases social networks around these. SciVee
provides a YouTube‐like Web forum for sharing and discovering scientific visualizations, presentations,
and documents. We anticipate many more such services for the scientific community to come.
Acknowledgements: The NSF OCI SDCI program, the NASA Advanced Information System Technology
(AIST) program, and the NSF OCI CI‐TEAM program provided support for the work described in this
paper. We thank Prof. Gregor von Laszewski for his help with the Java COG kit.
7.
References
[1] Shrideep Pallickara, Geoffrey Fox, Sangmi Lee Pallickara: An Analysis of Reliable Delivery
Specifications for Web Services. ITCC (1) 2005: 360‐365.
[2] Shrideep Pallickara, Geoffrey Fox: An Analysis of Notification Related Specifications for Web/Grid Applications. ITCC (2) 2005: 762‐763.
[3] Harshawardhan Gadgil, Geoffrey Fox, Shrideep Pallickara, Marlon E. Pierce: Scalable, fault‐tolerant
management in a service oriented architecture. HPDC 2007: 235‐236.
[4] Malcolm P. Atkinson, David De Roure, Alistair N. Dunlop, Geoffrey Fox, Peter Henderson, Anthony J.
G. Hey, Norman W. Paton, Steven Newhouse, Savas Parastatidis, Anne E. Trefethen, Paul Watson,
Jim Webber: Web Service Grids: an evolutionary approach. Concurrency ‐ Practice and Experience
17(2‐4): 377‐389 (2005).
[5] Tim O’Reilly, “What is Web 2.0: Design Patterns and Business Models for the Next Generation of
Software”. Available from http://www.oreillynet.com/pub/a/oreilly/tim/news/2005/09/30/what‐is‐
web‐20.html.
[6] Marlon E. Pierce, Geoffrey Fox, Huapeng Yuan, and Yu Deng, “Cyberinfrastructure and Web 2.0”
Proceedings of HPC2006, July 4 2006 Cetraro Italy.
[7] Geoffrey C. Fox, Rajarshi Guha, Donald F. McMullen, Ahmet Fatih Mustacoglu, Marlon E. Pierce,
Ahmet E. Topcu, and David J. Wild, “Web 2.0 for Grids and e‐Science” INGRID 2007 ‐ Instrumenting the Grid 2nd International Workshop on Distributed Cooperative Laboratories ‐ S.Margherita Ligure Portofino, ITALY, April 18 2007.
[8] Ian T. Foster: Globus Toolkit Version 4: Software for Service‐Oriented Systems. J. Comput. Sci.
Technol. 21
[9] Jay Alameda, Marcus Christie, Geoffrey Fox, Joe Futrelle, Dennis Gannon, Mihael Hategan, Gopi
Kandaswamy, Gregor von Laszewski, Mehmet A. Nacar, Marlon E. Pierce, Eric Roberts, Charles
Severance, Mary Thomas: The Open Grid Computing Environments collaboration: portlets and
services for science gateways. Concurrency and Computation: Practice and Experience 19(6): 921‐
942 (2007).
[10] Kaizar Amin, Gregor von Laszewski, Mihael Hategan, Rashid J. Al‐Ali, Omer F. Rana, David W.
[11] Robert Granat, Galip Aydin, Marlon E. Pierce, Zhigang Qi, Yehuda Bock: Analysis of streaming GPS measurements of surface displacement through a web services environment. CIDM 2007: 750‐ 757.
[12] Marlon E. Pierce, Geoffrey C. Fox, Galip Aydin, Zhigang Qi, Andrea Donnellan, Jay Parker and
Robert Granat QuakeSim: Web Services, Portals, and Infrastructure for Geophysics December 19
2007 to be published in 2008 IEEE Aerospace Conference March 1‐8 2008, Big Sky MT.
[13] Marlon E. Pierce, Geoffrey C. Fox, Joshua Rosen, Siddharth Maini and Jong Y. Choi. Social
Networking for Scientists Using Tagging and Shared Bookmarks: a Web 2.0 Application. 2008
International Symposium on Collaborative Technologies and Systems (CTS 2008), 2008.
[14] A. Mathes. Folksonomies‐Cooperative Classification and Communication Through Shared
Metadata. Computer Mediated Communication, LIS590CMC (Doctoral Seminar), Graduate School of Library and Information Science, University of Illinois Urbana‐Champaign, December, 2004.
[15] H. Halpin, V. Robu, and H. Shepherd. The complex dynamics of collaborative tagging.
Proceedings of the 16th international conference on World Wide Web, pages 211‐‐220, 2007.
[16] A. Hotho, R. Jaschke, C. Schmitz, and G. Stumme. Information retrieval in folksonomies: Search
and ranking. The Semantic Web: Research and Applications, 4011:411‐‐426, 2006.
[17] S. Deerwester, S. Dumais, G. Furnas, T. Landauer, and R. Harshman. Indexing by latent semantic
analysis. Journal of the American Society for Information Science, 41(6):391‐‐407, 1990.
[18] L. Page, S. Brin, R. Motwani, and T. Winograd. The pagerank citation ranking: Bringing order to
the web, 1998.
[19] D. Grossman and O. Frieder. Information Retrieval: Algorithms And Heuristics. Springer, 2004.
[20] K. Boyack, R. Klavans, and K. Börner. Mapping the backbone of science. Scientometrics,
64(3):351‐‐374, 2005.
[21] H. Wu, M. Zubair, and K. Maly. Harvesting social knowledge from folksonomies. Proceedings of
the seventeenth conference on Hypertext and hypermedia, pages 111‐‐114, 2006.
[22] J. Kruskal. Multidimensional scaling by optimizing goodness of fit to a nonmetric hypothesis.
Psychometrika, 29(1):1‐‐27, 1964.
[23] M. Belkin and P. Niyogi. Laplacian Eigenmaps for Dimensionality Reduction and Data
Representation, 2003.
[24] Y. Zhao, G. Karypis, and U. Fayyad. Hierarchical Clustering Algorithms for Document Datasets.
Data Mining and Knowledge Discovery, 10(2):141‐‐168, 2005.
[25] C. Ding and X. He. K‐means clustering via principal component analysis. ACM International
Conference Proceeding Series, 2004.
[26] K. Rose. Deterministic annealing for clustering, compression, classification, regression, and
related optimization problems. Proceedings of the IEEE, 86(11):2210‐‐2239, 1998.
[27] J. Diederich and T. Iofciu. Finding Communities of Practice from User Profiles Based On
Folksonomies. Proceedings of TEL‐CoPs 06. 2006.
[28] A. Hotho, R. Jaschke, C. Schmitz, and G. Stumme. Trend detection in folksonomies. Prof. First

![Figure 6. Examples of 2‐D representation of Classical Multidimensional Scaling (left) and Laplacian map (right) of folksonomy data, showing document‐document similarity. Data has been taken from the MSI‐CIEC Social Networking Web [13] .](https://thumb-us.123doks.com/thumbv2/123dok_us/8132037.242547/16.612.77.535.85.253/examples-representation-classical-multidimensional-laplacian-folksonomy-similarity-networking.webp)