Abstract: Undoped CdO, Mn3O4 and CdO - Mn3O4 doped nanocomposites in the ratio 9:1, 8:2, 7:3 and 6:4 were successfully synthesized through thermal decomposition at high temperature by adopting the method of solid state reaction. powder X-ray diffraction (PXRD) was employed to carry out the structural characterization. It was found that as the concentration of Mn3O4 was increased the size of the prepared CdO-Mn3O4
composites has decreased. The change of various dielectric variables like dielectric loss (tanδ), dielectric constant (εr) was
determined. Moreover the change of ac conductivity (σac) with
respect to frequency was carried out using LCR meter. It was found that these dielectric parameters have increased with respect to the temperature. It was also found that, with an increase in temperature the dc conductivity measurements for the prepared nano composites have also increased
Index Terms: ac conductivity (σac), dielectric constant (εr),
dielectric loss (tanδ),PXRD.
I. INTRODUCTION
Owing to the enhanced optical and electrical properties, great awareness was created in the midst of scientists and researchers towards nanosized semiconductor metal oxides. The discoveries of new type of nano sized metal components have increased day by day due to their present day
developments in the processing of various materials and their characterizations. Increasing the additives of more compounds into composites has increased the flexibility of modifying and mastering over most of the properties and functionalities of nanomaterials. Most of the doped nanomaterials and composite nanomaterials come under hybrid nanomaterials. Nowadays hybrid nanomaterials amidst improved optical and electronic properties have become an essential requirement for many emerging technologies including conversion of solar energy, optical instruments, optical imaging and biomedical detection and therapy [1], [2].
More fascinating properties are exhibited in mixed phase nanocomposites, rather than that of single phase nanostructured materials. The inculcation of mixed phases in a nano composite enhances the mechanical, magnetic, thermal, optical and catalytic properties drastically. Greater attention have been shown by the scientific community towards the transition metal oxide magnetic nanocomposites, due to their technological utilizations for the microwave industries, high speed audio-visual developments, magnetic levitated trains, ferro fluids and magnetic refrigeration systems [3], [4]. Cadmium oxide (CdO) is a known n-type
Revised Manuscript Received on September 03, 2019
C. Sagi Rani, Department of Physics, Noorul Islam centre for Higher Education, Kumaracoil, Tamil Nadu 629180, India.
N. Joseph John, Department of Physics, Kamarajar Government Arts and Science College, Surandai, Tamil Nadu - 627 859, India
semiconductor exhibiting a direct band gap inbetween 2.2 to 2.5 eV. The oxides of cadmium also show an indirect band gap of 1.36 to 1.98 eV [5], [6]. But evidences have shown that the band gap of CdO can also vary in the range of 1.1 to 3.3 eV [7], [8]. This drastic change in band gap is considered as lattice’s defects that arise as a result of Burstein-Moss effect [9].
Nanoparticles of Transition- metal oxides have heightened optical, magnetic and electrical properties rather than their bulk equivalents, thus setting them for a large number of interesting applications. Thus Manganese is one of the transition metal, which exhibit more number of interesting properties. Even though manganese is complex it is a fair centre for revealing many oxidation states and constitutes separate oxides like MnO, Mn2O3, Mn3O4, MnO2 portrayed
through different mineral names such as birnessite, manganosite, hausmannite, pyrolusite, respectively, possessing a wide selection of technological utilizations viz. stimulant agents, reciprocal transfer of ions, molecular absorption, dry cells, varistors, high density magnetic storage media, photo voltaic systems, etc. [10]. Manganese oxides crystallizes into numerous different structures due to the availability of various oxidation states of manganese Mn2+, Mn3+ and Mn4+ [11]. Referring to the oxides of these manganese nanoparticles exhibiting magnetic properties, trimanganese tetraoxide (Mn3O4, hausmanite) is one of the
essential material as a magnetic transition metal oxide. A great deal of attention has been paid to Mn3O4 in view of its
prevailing use in multitudinous operations like batteries, high intensity magnetic storage media, electro chromic materials, super capacitors, sensors, corrosion-inhibiting pigment and catalysts. It also acts as the matrix material for synthesizing pliable magnetic materials, which have ample applications in electronic and information technologies serving as high-density magnetic recording media, ferrofluid technologies, spin valves, magnetic resonance imaging, magneto caloric refrigerator, etc [12].
In the present work, multiphased mixed nanocrystals (nanocomposites) depending on cadmium oxide and manganese oxide in different compositions were prepared with an intention of originating new substances. Cadmium oxide and manganese oxide crystals are isomorphous to one other. Their lattice constants are comparable, having a difference of 6 % only. Stationed on this condition, mixed crystals of different molar concentrations may be attainable. The outcomes obtained are reported here and discussed.
Effect of Mn
3
O
4
on the Dielectric
Characteristics of Cdo - Mn
3
O
4
Nanocomposites
II. EXPERIMENTAL
A. Synthesis of CdO-Mn3O4 Nanocomposite:
Analytical reagent grade cadmium acetate dihydrate and manganese acetate tetra hydrate were used for the preparation of samples. The chemicals used in the present study are used as such received without any further purification. Cadmium acetate dihydrate and manganese acetate tetra hydrate in its six different molecular ratios viz 10:0, 9:1, 8:2, 7:1, 6:4 and 0:10 were mixed thoroughly to a fine mixture using an agate mortar and pestle. This fine mixture is transferred to an alumina crucible and is heated for a period of 24 hours in a muffle furnace maintained at a temperature of 950°C. The resulting sample is the CdO-Mn3O4 nanocomposite and the
resultant sample thus obtained is collected for further characterizations.
III. RESULTSANDDISCUSSION
A. PXRD ANALYSIS
The powder XRD computations were performed by a XPERT-PRO diffractometer with monochromatized Cu K-Alpha radiation [K-Alpha= 1.54443Å]. The peak position and intensity were obtained between 20 and 80º with the velocity 0.02º per second. Fig. 1 presents the powder XRD paradigm of the as synthesized six CdO-Mn3O4 nano
composites. The XRD pattern has confirmed the formation of CdO-Mn3O4 nano composite that exhibits various peaks.
Almost all the peaks are dominant indicating the crystalline nature of the prepared samples.
The XRD paradigm fig. 1(a) has confirmed the formation of CdO nano particle (JCPDS card no: 75-0594) that exhibits various peaks at 32.850, 37.90, and 55.930 and they can be readily indexed as (111), (200) and (220) respectively and be in harmony with the cubic nature of CdO. No other impurity peaks were diagnosed, designating that the obtained CdO was phase pure [8]. Fig. 1 (b) presents the crystalline structure of Mn3O4 with several significant peaks
that can be readily indexed as (112), (200), (103), (211), (004), (220), (105), (224), (312) and (400) crystal planes respectively, that is in good compatibility with the standard value, JCPDS No. 0240734. All the peaks in the pattern can be indexed to a tetragonal phase with lattice constants a = b = 5:7621 (A°) , c = 9:4696 (A°) [4] . Fig. 1 (c), (d), (e) and (f) shows the XRD pattern for the prepared CdO-Mn3O4 nano
composite. It indicates the presence of two phases namely CdO (JCPDS card no: 5-640) and Mn3O4 (JCPDS card no:
24-734). The powder XRD pattern has confirmed the formation of CdO-Mn3O4 nano composites that exhibits
various peaks at 33.04º, 38.35º, 55.34º, 66.00º and 69.29º [13]. Further it is also confirmed that the synthesized nanocomposites were free of impurities as it does not contain any characteristic peaks other than CdO-Mn3O4.
The average particle size is estimated by utilizing the Debye-Scherrer formula [14], [15].
(1)
[image:2.595.332.537.153.348.2]Where, β is the Full Width at Half Maximum intensity [FWHM] corresponding to the diffraction angle 2θ in radian, and λ is the wavelength of Cu-kα radiation. Scherrer method allocates the average crystallite size in reference to the broadening of the peaks. From the computed average crystallite size, it has been found that all the prepared nanocomposites are in nano regime. The average particle size for the prepared nano composites were given in table I.
Fig. 1: PXRD paradigm for the prepared CdO-Mn3O4
Nano-Composites ( (a) undoped CdO, (b) undoped Mn3O4,
(c) 9:1 CdO-Mn3O4 , (d) 8:2 CdO-Mn3O4 (e) 7:3
CdO-Mn3O4 , (d) 6:4 CdO-Mn3O4 )
Table I.: Average particle size for the prepared nanocomposites
CdO : Mn3O4 ratio
Particle size
10:0 82.44
9:1 72.04
8:2 74.64
7:3 59.19
6:4 52.17
0:10 86.30
B. Dielectric constant
The dielectric constant is expressed as a complex quantity given by
(2)
(3)
where tanδ is called the dielectric loss [16-20]. The
capacitance(C) and
dielectric loss factor (tanδ)
measurements for the
prepared nano composites
20 30 40 50 60 70 80
(f) (e) (d)
(c) (b)
Mn3O4 Jcpds No:24-0734
(2
1
1
)
(3
2
1
)
(2
0
4
)
(2
0
0
)
(1
1
2
)
(2
2
2
)
(3
1
1
)
(2
2
0
)
(2
0
0
)
In
te
n
s
it
y
(
a
.u
.)
(Deg)
(1
1
1
)
CdO Jcpds No:75-0594
[image:2.595.358.496.442.618.2]were carried out by employing a LCR meter for numerous temperatures ranging from 40 to 150°C at four dissimilar frequencies, viz. 1kHz, 10kHz, 100kHz and 1MHz [21,22]. The prepared nanocomposites in their pellet forms were used for these measurements. Opposite faces of the pellets were glazed with graphite to achieve a good conductive surface layer. The temperature was administered to an accuracy of ±1°C. The investigations were made while cooling the sample. Air capacitance (Cair) was also measured. The
dielectric constant of the nanocrystal was estimated using the relation
where, C is the capacitance of the nanocrystal (pellet) and Cair
[image:3.595.313.513.50.249.2]is the capacitance of the air having the same dimension as that of the pellet.
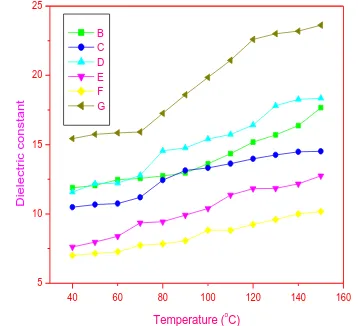
Fig. 2: Change of dielectric constant with temperature for 1 KHz frequency ( (B) undoped CdO, (C) undoped Mn3O4, (D)
9:1 CdO-Mn3O4 , (E) 8:2 CdO-Mn3O4 (F) 7:3 CdO-Mn3O4 ,
(G) 6:4 CdO-Mn3O4 )
Fig. 3: Change of dielectric constant with temperature for 10 KHz frequency ((B) undoped CdO, (C) undoped Mn3O4, (D)
9:1 CdO-Mn3O4 , (E) 8:2 CdO-Mn3O4 (F) 7:3 CdO-Mn3O4 ,
(G) 6:4 CdO-Mn3O4 )
Fig. 4: Change of dielectric constant with temperature for 100 KHz frequency ((B) undoped CdO, (C) undoped Mn3O4, (D)
9:1 CdO-Mn3O4 , (E) 8:2 CdO-Mn3O4 (F) 7:3 CdO-Mn3O4 ,
(G) 6:4 CdO-Mn3O4 )
Fig. 5.: Change of dielectric constant with temperature for 1 MHz frequency ((B) undoped CdO, (C) undoped Mn3O4, (D)
9:1 CdO-Mn3O4 , (E) 8:2 CdO-Mn3O4 (F) 7:3 CdO-Mn3O4 ,
(G) 6:4 CdO-Mn3O4 )
The change of dielectric constant with temperature for different frequencies is shown in fig. 2-5. It was found that for all the samples in the measured four frequencies, the dielectric constant have increased with an increase in temperature. The results attained in the present study indicate that at 1 KHz and 10 KHz frequencies all CdO-Mn3O4 nanocomposites have
lesser dielectric constant than undoped Mn3O4. At 100 KHz
and 1 MHz frequencies CdO-Mn3O4 (9:1) nanocomposites
has higher dielectric constant than all other samples. The dielectric constant is associated with four different types of polarizations namely thespace charge, dipolar, ionic and electronic [23, 24]. A sharp increase in dielectric
40 60 80 100 120 140 160
5 10 15 20 25
B C D E F G
Di
el
ec
tric
c
on
s
tan
t
Temperature (o
C)
40 60 80 100 120 140 160
5 10 15 20
B C D E F G
Di
el
ec
tric
c
on
s
tan
t
Temperature (o
C)
40 60 80 100 120 140 160
0 5 10 15
20 B
C D E F G
Di
el
ec
tric
c
on
s
tan
t
Temperature (oC)
40 60 80 100 120 140 160
0 5 10 15 20
B C D E F G
Di
el
ec
tric
c
on
s
tan
t
[image:3.595.77.257.274.437.2]constant was reported at lower frequency region and it was attributed to the space charge and dielectric polarizations because they have a strong dependence on temperature.
C. Dielectric loss
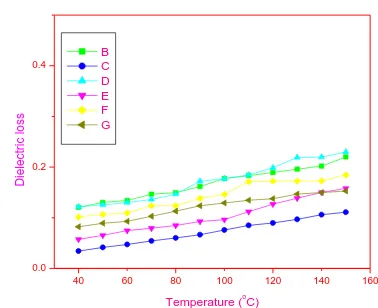
The energy deprivation in the dielectric system was determined by the dielectric loss factor tanδ and it was found to arise when the polarization lags behind the applied electric field. The change of tanδ with frequency at different temperatures for the prepared CdO-Mn3O4 nano composites
[image:4.595.318.522.71.293.2]is shown in fig: 6 – 9 and it clearly depicts that the loss in dielectric increases with increase in temperature and decreases with increase in frequency. It is also observed from the figures that the dielectric loss is high at higher temperatures and lower frequencies. It can be explained on the basis that at lower frequencies the trend is loss due to the space charge polarization and at higher frequencies, dielectric loss may be due to space charge polarization and at higher temperature behavior of loss may be due macroscopic distribution of charges [25]. Further, it can be explained by Shockley-Red mechanism. According to this mechanism, at lower and middle frequencies and at higher temperature the imputity ions in the bulk crystal matrices capture the surface electron, causing the surface charge polarization at the surfaces. This process increases with increase in temperature. Generally the loss in a dielectric loss arises mainly due to grain boundaries, impurities and imperfection in the crystal lattice [26].
Fig. 6: Change of dielectric loss with temperature for 1KHz frequency ((B) undoped CdO, (C) undoped Mn3O4, (D) 9:1
CdO-Mn3O4 , (E) 8:2 CdO-Mn3O4 (F) 7:3 CdO-Mn3O4 , (G)
[image:4.595.314.509.344.508.2]6:4 CdO-Mn3O4 )
Fig. 7: Change of dielectric loss with temperature for 10 KHz frequency ((B) undoped CdO, (C) undoped Mn3O4, (D) 9:1
CdO-Mn3O4 , (E) 8:2 CdO-Mn3O4 (F) 7:3 CdO-Mn3O4 , (G)
6:4 CdO-Mn3O4 )
Fig. 8: Change of dielectric loss with temperature for 100KHz frequency ((B) undoped CdO, (C) undoped Mn3O4,
(D) 9:1 CdO-Mn3O4 , (E) 8:2 CdO-Mn3O4 (F) 7:3
[image:4.595.71.271.414.578.2]CdO-Mn3O4 , (G) 6:4 CdO-Mn3O4 )
Fig. 9: Change of dielectric loss with temperature for 1MHz frequency ((B) undoped CdO, (C) undoped Mn3O4, (D) 9:1
CdO-Mn3O4 , (E) 8:2 CdO-Mn3O4 (F) 7:3 CdO-Mn3O4 , (G)
6:4 CdO-Mn3O4)
E. AC conductivity
The AC conductivity measurements depicts the conduction mechanisms in the prepared nanocomposites.. The change of ac conductivity with temperature is shown in fig: 10, 11, 12 and 13. The AC electrical conductivity (σac) was
calculated using the relation
where is the permittivity of free space (8.85x10⁻¹² C2 N-1 m-2) and ω is the angular frequency (ω = 2πf; f =1 kHz,10 kHz, 100 kHz and 1 MHz in the present study) and tanδ is the dielectric loss factor. From fig: 11-14, it was found that σac
values increases with increase in temperature. All the prepared nanocomposites
possess the value of AC electrical conductivity in the order of 10-7 mho/m. At 1
40 60 80 100 120 140 160
0.0 0.1 0.2 0.3 0.4 0.5 0.6 0.7 0.8 0.9 1.0
B C D E F G
Di
el
ec
tric
l
os
s
Temperature (oC)
40 60 80 100 120 140 160
0.0 0.2 0.4
B C D E F G
Di
el
ec
tric
l
os
s
Temperature (oC)
40 60 80 100 120 140 160
0.00 0.05 0.10 0.15 0.20 0.25
B C D E F G
Di
el
ec
tric
l
os
s
Temperature (o C)
40 60 80 100 120 140 160
0.0 0.1 0.2
B C D E F G
Di
el
ec
tric
l
os
s
Temperature (o
[image:4.595.69.258.630.784.2]KHz frequency undoped Mn3O4 higher than all other samples,
other frequencies 9:1 ratio sample has higher conductity. However there were no systematic changes in σac for the
[image:5.595.309.529.55.249.2]prepared samples.
Fig. 10: Change of AC conductivity with temperature for 1 KHz frequency( (B) undoped CdO, (C) undoped Mn3O4, (D)
9:1 CdO-Mn3O4 , (E) 8:2 CdO-Mn3O4 (F) 7:3 CdO-Mn3O4 ,
[image:5.595.60.276.103.276.2](G) 6:4 CdO-Mn3O4 )
Fig. 11: Change of AC conductivity with temperature for 10 KHz frequency ((B) undoped CdO, (C) undoped Mn3O4, (D)
9:1 CdO-Mn3O4 , (E) 8:2 CdO-Mn3O4 (F) 7:3 CdO-Mn3O4 ,
(G) 6:4 CdO-Mn3O4 )
Fig. 12 : Change of AC conductivity with temperature for 100 KHz frequency( (B) undoped CdO, (C) undoped Mn3O4, (D)
9:1 CdO-Mn3O4 , (E) 8:2 CdO-Mn3O4 (F) 7:3 CdO-Mn3O4 ,
[image:5.595.68.270.326.522.2](G) 6:4 CdO-Mn3O4 )
Fig. 13 : Change of AC conductivity with temperature for 1MHz frequency( (B) undoped CdO, (C) undoped Mn3O4,
(D) 9:1 CdO-Mn3O4 , (E) 8:2 CdO-Mn3O4 (F) 7:3
CdO-Mn3O4, (G) 6:4 CdO-Mn3O4 )
F. DC conductivity
The DC conductivity measurements for all the prepared nanocomposites were carried out using the conventional two-probe system at various temperatures ranging from 400-150ºC [10-17]. The resistances of the nanocrystals (pellets) were measured using a million - megohmmeter. The DC conductivity (σdc) of the prepared nanocomposite was
calculated using the relation
where R is the calculated resistance, d is the thickness of the sample and A is the area of the surface of the pellet that is in contact with the electrode. The change of σdc with temperature
is shown in fig: 14. It confirms that the DC conductivity of the prepared nanocomposites increases with increase in temperature. This emerges due to the transfer of ions to the vacancies or interstices in the ionic solids under the action of an electric field. [21], [22] .
Fig. 14 : Change of DC conductivity with temperature ((B) undoped CdO, (C) undoped Mn3O4, (D) 9:1 CdO-Mn3O4 ,
(E) 8:2 CdO-Mn3O4 (F) 7:3
CdO-Mn3O4 , (G) 6:4
CdO-Mn3O4 )
40 60 80 100 120 140 160
0 2 4 6 8 10 12 14 16
B C D E F G
A
C c
ond
uc
ti
v
ity
(
x
10
_7 m
ho)
Temperature (oC)
40 60 80 100 120 140 160
20 40 60 80 100 120
B C D E F G
A
C c
ond
uc
ti
v
ity
(10
-7 m
ho)
Temperature (oC)
40 60 80 100 120 140 160
0 200 400 600 800 1000 1200
B C D E F G
A
C c
on
du
c
ti
v
ity
(X
10
-7 m
ho
)
Temperature (oC)
40 60 80 100 120 140 160
0 2000 4000 6000 8000 10000
B C D E F G
A
C c
on
du
c
ti
v
ity
(X
10
-7 m
ho
)
Temperature (o
C)
40 60 80 100 120 140 160
0 100 200 300 400 500
B C D E F G
DC
con
du
ctivity
Temperature (o
[image:5.595.333.513.555.702.2] [image:5.595.64.259.582.743.2]Author-2 Photo IV. CONCLUSION
UndopedCdO, Mn3O4 and their coupled nanocomposites in
the ratio 9:1, 8:2, 7:3 and 6:4 were successfully synthesized
through thermal decomposition at high temperature by adopting the solid state reaction method. The particle size for the prepared nanocomposites is characterized by PXRD. In the present study doping has decreased the particle size. The temperature dependence of dielectric studies revealed that for all the samples studied, dielectric constant, dielectric loss and ac conductivity increase with increase in frequency. Similar result hold good for dc conductivity also. The low dielectric loss at higher frequency and temperature makes these nanocomposites as a candidate for high frequency applications.
REFERENCES
1. J. Li and J. Z. Zhang, “Infochemistry: information processing at the nano scale’ Coord. Chem. Rev. 253, 3015 (2009).
2. S. Ajin Sundar and N. Joseph John,” Synthesis and studies on structural and optical properties of zinc oxide and manganese-doped zinc oxide nanoparticles”; Nanosystems: Physics chemistry Mathematics.2016, 7 (6), pp.1024-1030.
3. M. Srivastava, Mater. Chem. Phys. 120, 493 (2010).
4. C. Sagirani, P. Athira, P. and N. Joseph John,”Investigations on tri manganese tetra oxide nano particles prepared by thermal decomposition, Nanosystems: Physics chemistry Mathematics. 2016, 7 (4), pp. 647-649.
5. M. Ghosh, C.N.R. Rao,” Solvothermal synthesis of CdO and CuO nanocrystals”, Chem. Phys. Lett. 393, 493–497 (2004)
6. W. Dong, C. Zhu, “Optical properties of surface-modified CdO nanoparticles”, Opt. Mater. 22, 227–233 (2003).
7. A.A. Dakhel,, “ Optoelectronic properties of Eu- and H-codoped CdO films”, Current Appl. Phys. 11, 11–15 (2011)
8. C. Sagirani, N. Thangaraj, D.M. Suresh and N. Joseph John, “Influence of ball milling on CdO nanoparticles prepared by thermal decomposition”, Ori. J.. Chem., 34, 1, 2018,pp. 568-572.
9. M. A Grado-Caffaro, “A quantitative discussion on band-gap energy and carrier density of CdO in terms of temperature and oxygen partial pressure”, Phys. Lett. A. 372, 4858–4860 (2008).
10. S. Thota, B. Prasad, J. Kumar, Mater. Sci. Eng.B 167, 153 (2010). 11. S. Fritsch, J. Sarrias, A. Rousset and G. U. Kulkarni, Mater. Res. Bull.
33, 1185 (1998).
12. I. K. Gopalakrishnan, N. Bagkar, R. Ganguly, S. K. Kulshreshtha, J. Cryst. Growth, 280, 436 (2005).
13. C. Sagirani, N. Joseph John,” Investigations on solid state synthesized CdO-M3O4 nanocomposites”, J. che. Pharm. Sci., 9( 4) , 2016, pp.
2025-2030.
14. L.R.P. Elton and Daphne.F.Jackson,’X-Ray diffraction and the Bragg law’, American Journal of Physics, 34(11), 2005, pp.1036(1966). 15. S. Ajin Sundar, N. Joseph John, “Investigations on the effect of Mn on
structural and optical properties of ZnO nanoparticles, Int. J. current Research, 2016, 8(4), pp. 29398-29402
16. C. Ku, R. Liepins, “Electrical properties of Polymers”, Hanserp, New York, 1987, 20-58.
17. G. Wagner and P. Hantemann, J. Chem. Phys.18, 72. (1950) 18. S. Ajin Sundar, and N. Joseph John., “Synthesis, Structural, Optical
and Dielectric Studies on Carbon dot-Zinc oxide (CDZO) nanocomplexes”, Int. J. Nanoscience, 16, 3, 2017, 1750021-1750030, DOI: 10.1142/S0219581X17500211.
19. . N.E. Hill, W.E. Vaugham, A.H. Price, and M. Daries (1969) Dielectric properties and molecular behaviour [Von Nostiand Reinhold Company, London].
20. Nima Jessiba Daniel, Thangaraj N., Suresh D. M., Joseph John N., “ Studies on CdSeO3 nano particles prepared by solvothermal Process”,
International Journal of Current Science , 9,10,2017.59736-59739 21. Nima Jessiba Daniel, N. Thangaraj, D. M. Suresh, and N. Joseph
John, “Electrical measurements on cadmium selenite nano complexes”, Int. J. Res. Rev., 24(9), 2017, pp. 1-5.
22. S. Ajin Sundar and N. Joseph John “ Dielectric properties of Mn doped ZnO nanostructures”, Int. J. of Eng. and App. Sci., 3(3), 2016, pp. 26-29.
23. L.C. Hench and J.K. West (1990) Principles of Electronic Ceramics [John Wiley and sons , NewYork]
24. A.Verma, O.P.Takur, C.Prakash, T.C. Goel and R.G. Mendrinatta, "Temperature dependence of electrical properties of nickel–zinc ferrites processed by the citrate precursor technique‖ Mater.Sci. Engg. B 116, 1, pp. 1-6 (2005)
25. B. P. Das Mahapatra, P. K. Choudhry R.,” Mater. Sci.: Materials in Electronics, ‘15, 2004, 107-114.
26. Mangalaraja R. V., Manohar, P., Gnanam F. D., Electrical and magnetic properties of Ni0.0Zn0.2Fe2O4 / Silica composite prepared by sol gel method, Journal of Material Science, 39, 2004, 2037-2042. http:/dx.doi.org / 10.1023/B:jmsc.00000017766.07079.80
27. I. Bunget and M. Popaseu (1984) Physics of Solid Dielectrics [Elsevier, NewYork].
AUTHORSPROFILE
C.Sagi Rani , serves as an Assistant Professor / part time research scholar, at Noorul Islam centre for Higher Education, in Tamil Nadu, South India. She has more than 10 years of teaching experience. She has completed her M.Sc and M. Phil degree from Manonmaniam Sundaranar University, Tirunelveli. Her research interests are nanomaterials, Thin films etc.