Where does all the data come from?
Geoffrey Fox (Indiana University, USA), Tony Hey (Microsoft Research, USA) and Anne Trefethen (Oxford University, UK)
1.
Introduction
The data deluge [1] is all around us, and this book describes the impact that this will have on science. Data are enabling new discoveries using a new – the fourth [2] -- paradigm of scientific investigation. This chapter provides an overview of the diverse nature of the data driving the fourth paradigm with the data’s richness of size, variety of characteristics and need for computational processing. New fields are being born from for example the study of tweets and the acceleration pace of changes in previously quiescent ice sheets. Other fields such as earthquake prediction cry out for new observations to improve forecasting. Areas such as genomics and the search for fundamental particles at the Large Hadron Collider drive the main stream of the field with many petabytes of data derived from advanced instruments. The deluge and its impact are pervasive.
Data born digital comes in many sizes and shapes and from a vast range of sources – even in our daily lives we create a massive amount of digital information about ourselves and our lives. We do this by shopping with credit cards, using on-line systems, social networking, sharing videos, capturing traffic flow, measuring pollution, using security cameras, and so on. In addition, in healthcare we now routinely create digital medical images as part of ‘electronic health record’ or EHR. In this chapter, after looking briefly at the explosion of digital data and devices that are impacting our daily lives, we shall focus on some examples of the scientific data deluge. We anticipate that some of the tools, techniques and visualizations that are now being used by scientists to explore and manage their challenging data sets will find their way into business and everyday life – just as was done with creation of the Web by Tim Berners-Lee and the particle physics community. In our focus on scientific data, it is important not to ignore the digital aspects of the social sciences and the humanities which, although physical artefacts still play an important role in research, are becoming increasingly digitally driven.
2.
An Explosion of Data in our lives
A recent report by McKinsey Global Institute [3] reports that there are 30 billion pieces of content shared on Facebook every month, that the US Library of Congress had collected 235 terabytes of data by April 2011 and that 15 out of 17 sectors in the US have more data stored per company than stored by the US Library of Congress. The future only sees this content increasing, with a projected growth of 40% in global data generated by commerce and individuals per year. The McKinsey report [3] estimates that globally, enterprises stored more than 7 exabytes of new data on disk drives in 2010, comprising data generated through interactions with a customer base and data supporting the provision of services through the Internet. Individuals stored a similarly impressive amount - more than 6 exabytes of new data on home and hand-held devices.
The report also notes that there are over 30 million networked sensors deployed in the transportation, industrial, retail, and utilities sectors and that this number is increasing by more than 30% per year. We will return to the issue of sensor data below as we look in more detail at the Smart Grid and oceanographic examples of data collection.
It is a truism to say that the Internet has changed everything - today our lives are often as much digital as physical. Our collaborations and friendships are as likely to be virtual as being based on real, physical, face-to-face meetings, and the management of our lives – be it banking, house utilities, health, or car insurance – is increasingly dominated by networked systems and on-line commerce.
Figure 1: Breakdown of Top Level Domains over 5 quarters [4]
Using this information, TNW (The Next Web) [5] estimate the number of pages on the web to be between 42 billion and 121 billion, a 21 % increase from 2008. There is an estimate [6] of 45-50 billion for the indexed world wide web. Verisign also reports that in the last decade, the number of Internet users has increased by 500%. It is notable, however, that this growth is not homogenous globally. Certain international regions are exploding in their use of the Internet. For example, a decade ago, Africa had less than 5 million Internet users: it now has more than 100 million. The report also estimates that in 2010 less than 40% of Internet users were English speaking.
Social use of the Internet is generating content constantly and in ever-increasing amounts. Search Engine Watch [7] includes some interesting statistics on YouTube, the video sharing community site. In 2010, more than 13 million hours of video were uploaded to the site; in two months (60 days) more video was uploaded than had been created in six decades by the three major networks (ABC, CBS, NBC). By May 2011, more than 48 hours of video were being uploaded per minute, and YouTube had surpassed 3 billion views per day.
shared each month, emails, YouTube and other social data transfers. The use of these social network and related tools is beautifully illustrated by JESS3 [9] in Figure 2.
Figure 2: The Geosocial Universe
Flickr, the photo sharing site now hosts over 4 billion images. These images are generally family photographs, holiday snaps and the like. However, the increasing demand for digital image storage is a growing concern as we turn to healthcare and the medical images that are now a standard part of our healthcare systems. Medical images are created in many forms and for a broad range of diagnostic reasons. They include magnetic resonance imaging (MRI), digital mammography, positron emission tomography (PET), and X-ray computed tomography (CT). Together, these images amount to over 20 thousand terabytes of data: a single CT study consists of sixty-four 512 x 512 x 16 bit images and can correspond to as much as tens or even hundreds of megabytes. In the case of mammography, the size of digital data collected is approximately 200 megabytes per examination.
Ninety-six percent of radiology practices in the USA are filmless and Table 1 below illustrates the annual volume of data across the types of diagnostic imaging [10]; this does not include cardiology which would take the total to over 109 GB (an Exabyte).
Modality Part B non HMO All Medicare All Population Per 1000 persons Ave study size (GB) Total annual data generated in GB
CT 22 million 29
million
87 million 287 0.25 21,750,000
MR 7 million 9 million 26 million 86 0.2 5,200,000
Ultrasound 40 million 53
million
159 million 522 0.1 15,900,000
Interventional 10 million 13 million
40 million 131 0.2 8,000,000
Nuclear Medicine 10 million 14 million
41 million 135 0.1 4,100,000
PET 1 million 1 million 2 million 8 0.1 200,000
Xray, total incl. mammography
84 million 111 million
332 million 1,091 0.04 13,280,000
All Diagnostic Radiology
174 million 229 million
687 million
2,259 0.1 68,700,000
The image repositories required to store medical images are more complex than those required to store photos on Flickr – the data are more complex, there are often diverse user access requirements, and a need to search and analyze the data in collections, according to particulars of an individual or to a specific disease type. The National Cancer Institute maintains a survey of biomedical imaging archives [10] but the terabytes listed there are only the tip of the iceberg.
There are also other considerations addressing the management of medical images. In the US, providers must meet HIPAA (Health Insurance Portability and Accountability Act) regulations that require a data back-up plan and disaster recovery plans. BridgeHead Software, who describe themselves as a Healthcare Storage Virtualization company, found the top IT spending priorities of hospitals for 2010 were disaster recovery (44%), Picture Archiving and Communication Systems or PACS (38%) and digitizing paper records (35%) [11]. In addition, each state in the US has its own medical record retention rules, typically for a minimum of seven years.
generators and end-users. In the UK, the Department of Energy and Climate Change have set about rolling out smart meters across the UK [13] and it is anticipated that by 2019, 50 million smart meters will have been installed. The likely data generated and collected from these meters includes 12 readings per hour at 50 bytes per reading which, together with the system monitoring tools, will create Gbytes of data each. The challenges for the Smart Grid are not only technical – how to store and analyse such data – but also raise issues of security and policy. How will the data be kept private? How long will it be kept for? How much data should be kept locally versus centrally. And of course the telecommunications networks required to implement such capabilities are not generally readily available. However, the move to Smart Grids is global and as micro-generation of electricity increases through local renewable energy schemes, the requirements for Smart Grid technologies will only increase [14].
Finally, an IDC report [15] titled ‘The 2011 Digital Universe Study: Extracting Value from Chaos’ estimates that in 2011 the total volume of information created and replicated ‘will surpass 1.8 Zettabytes (1.8 trillion gigabytes) - growing by a factor of 9 in just five years’. The report estimates that 75% of this digital content will be created by individuals. The report also estimates that the number of files is growing even faster than the information itself and attributes this rapid growth to the increasing number of embedded systems now generating data.
3.
Research Data from Observations
3.1 Astronomy: The Square Kilometre Array (SKA)
[image:6.595.66.562.509.664.2]At the present time hundreds of astronomers, computer scientists and technology engineers across the globe are designing the next generation radio telescope - the Square Kilometre Array or SKA [16]. It is anticipated that construction of the first phase of the telescope will begin in 2016 with the full telescope completed and in operation by 2022. The decision where to locate the SKA will be made in 2012 and it is likely be located in either Australia or South Africa, in a desert so as to have little or no interference, but will be a collaborative effort involving over 50 groups in 19 countries.
Figure 3: Possible Configuration of SKA and artist's impression of the SKA core [17]
is intended to provide data to answer fundamental questions about gravitation and magnetism, galaxy formation and even the question of life on other planets. The design of the SKA is developing through studies based on the science requirements, and on a number of SKA ‘Pathfinder’ projects that provide experience of design options, and technology capability considerations.
The SKA provides an enormous information technology challenge, with a typical data rate from each dish antenna on the order of 100Gbs-1 aggregating to over 100Tbs-1 [18] and need for exaflop-scale computation [21] for post-processing. The IT infrastructure required to support the science at the SKA will range from real-time capability to transport and analyse the data at these high-data rates together with the capacity to store and “publish” the data for later analysis and interpretation by the global astrophysics community. The computational systems will likely range from specifically designed FPGA-like units to exascale computing systems and Cloud data centres. The communications infrastructure will range from high bandwidth intra-chip and inter-chip connections on a high-performance computing system, to trans-oceanographic data transmission optical fibers supporting data rates of at least 100Gbs-1. The SKA will succeed or not depending on both the physical implementation of the telescope design and the software infrastructure that will enable it. The software infrastructure required to realise this information technology challenge is itself has been identified as > 2000 person year task [22] but even this may not take full account of the complexity of the task.
3.2 Astronomy: The Large Synoptic Survey Telescope (LSST)
The Large Synoptic Survey Telescope (LSST) [23] is the most ambitious survey currently planned in the optical part of the electromagnetic spectrum. The LSST is driven by four main science themes: probing dark energy and dark matter, taking an inventory of the Solar System, exploring the transient optical sky, and mapping the Milky Way. It will be a large, wide-field ground-based telescope designed to obtain multiple images covering the sky that is visible from Cerro Pachón in Northern Chile. The current LSST design has an 8.4m (6.7m effective) primary mirror, a 9.6 deg2 field of view, and a 3.2 Gigapixel camera. This will allow about 10,000 square degrees of sky to be covered using pairs of 15-second exposures twice per night, every three nights on average. The system is designed to yield high image quality as well as high astrometric and photometric accuracy. The total survey area will include 30,000 deg2 and will be imaged multiple times in six bands covering the wavelength range 320—1050 nm. The project is scheduled to begin the regular survey operations before the end of this decade. About 90% of the observing time will be devoted to a deep-wide-fast survey mode which will uniformly observe a 18,000 deg2 region about 1000 times (summed over all six bands) during the anticipated 10 years of operations. These data will result in databases including 10 billion galaxies and a similar number of stars, and will serve the majority of the primary science programs [24, 25].
3.3 Earth Observation Data
NASA’s Earth Observing System Data and Information System, EODIS [27] manages and distributes data products through its Distributed Active Archive Centers or DAACs. Each DAAC processes, archives, documents, and distributes data from NASA’s past and current research satellites and field programs. Each center serves one or more specific Earth science sub-discipline and provides appropriate data products, data information and services for its community. In Europe, the European Space Agency ESA [28] plays a similar role to EOSDIS and oversees an Earth observation program. For EOSDIS the growth in the archive is around 1 PB/yr. For ESA, including missions such as Envisat, Cryosat and AATSR, the data volumes are comparable. Space missions from Japan and India contribute around 0.5 PB/yr and aircraft missions, including LIDAR, probably account for another 0.5 PB/yr. New missions, still in the planning stage, which are expected to launch in the next 5 – 10 years are likely to generate another 1 PB/yr.
If we add up all these sources we arrive at around 4 PB/yr for Earth observation data, depending on the precise definitions (i.e., storage or distribution). For example, EOSDIS distributes 3.62 PB/yr now – made up of 4200 data products, > 400 million product distributions and over 1M users.
3.4 Oceanographic data
Present ocean sensors tend to generate relatively low volumes of data and typically do so intermittently – during cruises or delivery to shore-side systems. All told, this probably only amounts to tens of GB/day. However, there will be a transformational change with the deployment of real-time ocean observatories.
The Ocean Observatory Initiative or OOI [29] is a long-term, NSF-funded program to provide 25-30 years of sustained ocean measurements to study climate variability, ocean circulation and ecosystem dynamics, air-sea exchange, seafloor processes, and plate-scale geodynamics [25]. The OOI will enable powerful new scientific approaches for exploring the complexities of Earth-ocean-atmosphere interactions, and accelerate progress toward the goal of understanding, predicting, and managing our ocean environment. The Observatory is planned to be a networked infrastructure of science-driven sensor systems to measure the physical, chemical, geological and biological variables in the ocean and seafloor. When complete, the OOI will be one fully integrated system collecting data on coastal, regional and global scales. As a result, the data volumes are expected to increase dramatically and transform ocean-science from being a data-impoverished branch of science to one having an abundance of data.
3.5 Earthquake Science
Fortunately, for society if not science, large earthquakes are infrequent and so the study of earthquakes is observational data-limited compared to other fields. Major quakes occur all over the world and it is unrealistic to have substantial sensors deployed in most of these regions. Further, the quasi-periodicity of earthquakes implies that historical data is very important and we cannot increase that. Simulations can forecast damage and perhaps the aftershocks of an earthquake but the most important capability – forecasting new quakes is essentially entirely observational. Typically one uses patterns (in time series) to forecast the future with simulations useful to check if a particular pattern informatics approach is valid in an ensemble of simulated earthquakes. Important types of data include:
2) Geometry of Earthquake faults
3) Global Positioning data (GPS) recording time dependent positions
4) Synthetic Aperture Radar inferograms (InSAR) recording changes in regions over time.
The first two types of data, 1) and 2), are gathered carefully with recording of earthquakes and field analysis.; This is small in size and only growing slowly but of very high value.
For the GPS data there are currently fewer than 10,000 GPS stations recording data at intervals varying between one second and a day. Well-known GPS networks are the Southern California Integrated GPS Network, the Bay Area Regional Deformation Network in Northern California and the PBO Plate Boundary Observatory from UNAVCO [30].
The inSAR data could become voluminous but currently totals some 350 images (each covering around 10,000 km2) and only 2 Terabytes in size [31]. This data comes from uninhabited aerial vehicles (UAVSAR [32] from JPL) or satellites (WInSAR from UNAVCO [30]). The situation could be revolutionized by the approval of the DESDynI-R Mission (Deformation Ecosystem and Dynamics of Ice–Radar) recommended in the Earth Science Decadal Survey [33]. DESDynI would produce around a Terabyte of data per day but the mission has not so far been approved and so is many years away from a possible launch. This data is analyzed (as by QuakeSim [34, 35] for recent earthquakes) to find rates of changes, which are then used in simulations that can lead to better understanding of fault structures and their slip rates.
3.6 Polar Science
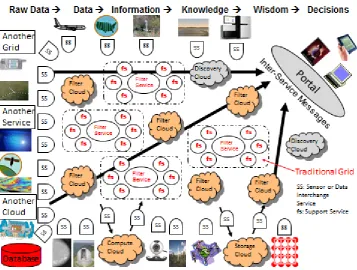
Figure 4: Architecture of PolarGrid data analysis Cyberinfrastructure [37] For the project, multiple expeditions fly instruments that collect data including:
1) ice thickness and internal layering from radar and seismics, and Synthetic Aperture Radar (SAR) images of ice-bed interface;
2) bed topography generated from ice thickness and surface elevation);
3) time series of change in surface elevation from airborne and satellite altimeters;
4) time series of surface velocity from repeat-pass satellite images, in situ GPS measurements, and aerial photos;
5) bed characteristics such as temperature, wetness, and sediment from seismics and radar.
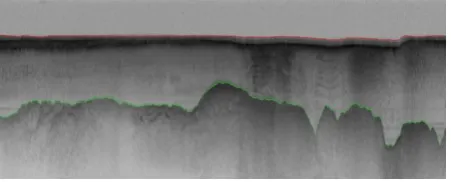
Figure 5: Radar Imagery from CReSIS with top and bed of ice sheet determined
The glacier-bed data illustrated in figure 5 is fed into simulations that aim to understand the effect of climate change on glaciers. Note that gathering of data is complicated by the paucity of electrical power and poor internet connectivity to the Polar Regions. The use of GPU’s is an interesting technology to deliver possible lower power data processing. The data is gathered on removable disks mounted in a storage array connected to just one or servers with rugged laptops as personal machines.
4.
Data from Experimentation and Instruments
4.1Particle Physics: The Large Hadron Collider (LHC)
The Large Hadron Collider LHC in Geneva is the highest energy particle accelerator ever constructed and operates in a 17 mile tunnel around the CERN Laboratory near Geneva [38]. Two proton beams can be accelerated to energies of up to 7 TeV and collided to produce a spectacular spray of particles. A major goal is to find a key ingredient of the Standard Model of particle physics, the Higgs Boson. The LHC is currently operating at half of its design energy and plans to go to the full energy of 7TeV per beam in 2014.
The LHC hosts four major experiments - Atlas, CMS, Alice and LHCb. The first two experiments each record around 100 events per second with each event about 1.5 Megabytes in size. These 100-450 events are selected in real time from the eventual 109 collisions (events) occurring every second at LHC. The experimental detectors contain 150 million sensors that record data 40 million times second (each read out contains over 20 overlapping events). The reduction of a factor of 4 105 in data size is achieved with a multi stage trigger [39, 40]. Having an effective trigger is a major part of design and selection of an experiment. The trigger is based on detecting “unusual events” with signatures of high transverse momentum and interesting particles (leptons and not baryons or mesons) being produced. The multi-stage trigger includes an initial hardware selection (giving a factor of about 400) followed by a software refinement executing on a dedicated cluster, which for CMS has 7000 cores. The software used in this final “higher level trigger” is a stripped down version of the basic analysis software and must reduce the Terabit/second input from the hardware trigger by about another factor of 1000. Alice is a heavy ion experiment to investigate collisions of lead nuclei in the LHC and has larger events and data rates. The LHCb experiment is lower in both respects than Atlas and CMS.
are regional systems. For example one LHC experiment (CMS) has 7 Tier-1 and 50 Tier-2 facilities [42, 43].
The initial data is analyzed in detail to find the parameters of the particles produced in the event and to disentangle the ~20 collisions in each event [44]. This analysis is often iterative as one improves the many calibration constants for the myriad of detector sensors. Detailed summaries of each event or reconstructed data are produced which yields about half the size of the raw data, i.e. ~0.75 Mb, with this process taking an average of around 15 minutes for each event. The experiments also create simple “analysis object data” or AOD that provides a trade-off between event size and complexity of the available information to optimize flexibility and speed for analyses. An AOD (~0.1 mb) is 5% of size of the raw data but with enough information for a physics analysis including this event. The other 95% of raw data would be preserved elsewhere as it would be necessary if, for example, the physics quantities were to be recalculated with a re-interpretation or re-calibration of the raw data. Finally, there are TAGs, about 2 kbyte per event that have enough information to select events for a physics analysis that would be performed with the AOD containing more details.
This analysis raw data reconstructed data AOD and TAGS Physics is performed on the multi-tier LHC Computing Grid. Note that every event can be analyzed independently so that many events can be processed in parallel with some concentration operations such as those to gather entries in a histogram. This implies that both Grid and Cloud solutions work with this type of data with currently Grids being the only implementation today.
4.2 Photon Sources
The European Synchroton Radiation Facility (ESRF) in Grenoble uses X-ray radiation in fields as diverse as protein crystallography, earth and materials science as well as certain areas of physics and chemistry [45]. The beamlines are planned to be upgraded to increase the present rate of data production, currently around 1.5 terabytes per day, by two or three orders of magnitude in ten years’ time.
The European X-Ray Free Electron Laser Project (European XFEL) is an international project with 14 participating countries that is located near Hamburg in Germany [46]. Free electron lasers generate high-intensity electromagnetic radiation by accelerating electrons to relativistic speeds in a linear accelerator. By 2015, the European XFEL will produce high-intensity X-ray pulses at intensities much brighter than those produced by conventional light sources. The data rates and data volumes generated by advanced facilities like the European XFEL or the LCLS at Stanford in the USA [41] will exceed those at conventional synchrotron light sources by at least an order of magnitude. Data rates are likely to be of the order of 7 terabytes per hour, depending on the experiment.
These futuristic projections need to be tempered with reality. At present the UK Diamond Light Source is storing approximately 200 terabytes in 88m files, increasing to a petabyte by 2014 [47]. For these facilities, it is often the number of files which is a challenge, rather than the total data volume.
4.3 Neutron Scattering and the Long Tail
structure and interactions of drugs, and the design of shampoos. There are over 25 different instruments at ISIS that support different types of experiments generating up to a few terabytes of raw data in day, with the facility running 100-200 days a year and producing in total up to a quarter of a petabyte total data in a year.
The large quantity of raw data doesn't necessary need to be moved far though. Consider one instrument SANS2d, which is a small angle scattering instrument. Neutrons are transported to the sample, where they are scattered at small angle and measured. One experimentalist [48] actually uses a white beam (neutrons from ~1.5 - 16 Angstrom) and a time of flight mode with a pulsed source. Small angle scattering gives you information about distance correlations that are "large" on the atomic scale, i.e. from about 8 - 400 Angstroms. This experiment class determines the structure of medium to large size biomolecules. This use of SANS2d can generate a gigabyte of raw data in a day but mostly this data largely records details that are not important for downstream analysis but are only important in the reduction of data down to the X-Y form in which it is normally used. Raw data files amounting to hundreds of megabytes are reduced to a single file of a few tens or maybe hundreds of kilobytes, and it is only that large because it is stored as a text file. The actual core data is probably less than a kilobyte. In the DIKW terminology the information (I) is this final kilobyte.
ISIS has in-house and visiting users. An experiment, usually lasting a few days, will involve running hundreds of samples, which in turn generate hundreds of data files. These are transferred, usually via a pen drive, to a visiting scientist's laptop to be taken home for further analysis. The in-house experimentalist [48] has accumulated perhaps 50 Gb of files in tens of directories, each relating to a specific experiment, or project. The analysis process usually involves taking each of the files from the experiment, fitting them to a model (or using the data to generate a model), often manually or in a semi-automated fashion. This probably doubles the quantity of files and volume on the local hard disk. External storage or compute capacity is rarely needed.
This analysis will probably get summarised in a table which is then used to draw conclusions about how the experimental parameters effected the system being studied. The composition of a mixture, temperature, or pH are all common variables, which are then graphed out and the changes compared to some physical theory. Alternately a whole series of measurements might be used to generate one model, generally a structure, of the system under study. This often involves a lot of exploration of different methods for working with the data, building test models, and comparing the results from a range of different methods.
This example illustrates the “long tail of science” [49, 50]. There are not, as in Large Hadron Collider LHC experiments, thousands of scientists collaborating on a single “big science” experiment but rather many thousands of individual scientists each doing their own experiment but with the total data involved at a petascale deluge.
4.4 European Bioinformatics Institute
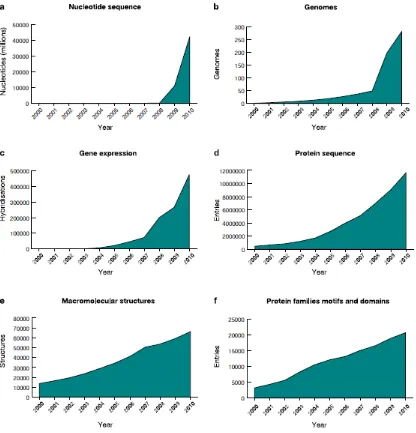
[image:14.595.86.502.297.730.2]Life sciences is one of the best examples of the data deluge and we start of giving examples from the European Bioinformatics Institute (EBI), which within Europe is the primary host for bioinformatics data, curating and sharing data from throughout Europe and beyond [51]. It is an academic research institute located in Hinxton near Cambridge (UK) and is part of the European Molecular Biology Laboratory (EMBL) [52]. The EBI annual report [53] reports on the status of the several databases within the EBI. For example, the European Nucleotide Archive (ENA) had an accumulation rate of more than 500, 000 bases per second. The data in figure 6, taken from the annual report [53], indicate the growth across other databases hosted at the EBI and the story is much the same.
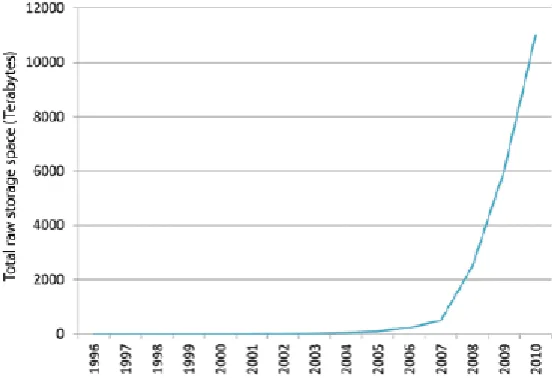
The increase in physical storage requirements of the Institute from 1996 to 2010 is shown in figure 7. The EBI, as part of the ENSEMBL project are now presenting data and services in the Cloud [54]– in this case in the Amazon Cloud.
Figure 7: Storage requirments of the EBI from 1996 to 2010
4.5 High Through-put Gene Sequencing
The discussion of radiology in section 2 shows that the life science data deluge impacts both research and our lives. Genomics is a field that directly spans this classification and here we look at the future growth of genomic data by studying the expectation that genome measurements for individuals will become an integral part of personal medicine. We will use one current sequencing instrument, the Illumina HiSEQ [55] machine, to quantify the analysis [56]. Each of these instruments generates 108 reads, each roughly 100 Nucleotides long, each day. Each Nucleotide is defined by 2 bits. It takes 100-10000 cores to use the Blast algorithm to compare with data from a central database in one day. Each read is distilled from a coverage of 50-100 times as much data including duplicates.
If we take a unit as a Human Genome with 3x10⁹ Nucleotides or 6x109 bits we can see more graphically the implications of this rate of data production. Each day one Illumina machine sequences 1010 Nucleotides, equivalent to 3.3 Human Genome units per day. If we assume that today there are around 1000 Illumina machines deployed world-wide (500 in USA), each capable of sequencing 3300 Human genomes per day, then this amounts to 2x1013 bits per day corresponding to about 7 petabits of data per year. (700 petabits per year including the extra factor of 100 from the coverage.)
It requires the capability equivalent to 1.5 million present day Illuminas to measure Human genomic data and 1.5*10^8 to 1.5*10^10 continuously running present day cores to perform a simple Blast analysis on the generated data [57-59]. Genomic data is notable for the intense computing effort associated with the data. This aspect is highlighted by the NIH observation that the cost of generating sequences has decreased over a factor of 100 more than the cost of computing over the last 3 years [60]. Note that NIH recently announced closure of a petabyte database [61] as they could not support it. Thus building scalable computing and storage infrastructure for genomics is challenging.
5.
Data from Simulations
5.1 Data from Weather and Climate Simulations
At a September 2008 meeting involving 20 climate modeling groups from around the world, the WCRP's [62] Working Group on Coupled Modelling (WGCM) [63] agreed to promote a new set of coordinated climate model experiments. These experiments comprise the fifth phase of the Coupled Model Intercomparison Project (CMIP5) [64]. CMIP5 will notably provide a multi-model context for:
1. Assessing the mechanisms responsible for model differences in poorly understood feedbacks associated with the carbon cycle and with clouds,
2. Examining climate “predictability” and exploring the ability of models to predict climate on decadal time scales,
3. Determining why similarly forced models produce a range of responses.
The fifth Coupled Model Intercomparison Project (CMIP5) will involve the global production and analysis of several petabytes of data. The Program for Climate Model Diagnosis and Intercomparison (PCMDI) [65], with responsibility for archival for CMIP5, has established the global “Earth System Grid Federation” (ESGF) [66] of data producers and data archives to support CMIP5. ESGF will provide a set of globally synchronized views of globally distributed data – including some large cache replicas which will need to persist for (at least) decades. ESGF will stress international networks, as well as the data archives themselves – but significantly less than would have been the case of a centralized archive. Developing and deploying the ESGF has exploited good will and best efforts, but future developments are likely to require more formalized architecture and management.
ESGF was born out of a number of initiatives to handle diverse, distributed data access for the climate community: In the U.S., the Earth System Grid (ESG [67]), in the UK, the NERC DataGrid [68] and in Germany, the Collaborative Climate Community Data Processing Grid (C3-Grid [69]). However, the dominant contribution has been that of the ESG. As a consequence, the ESGF architecture is currently a more mature version of the original ESG, extended and modified by both the code and experiences of the other partners.
ESGF exploits this information using four major components: data nodes, gateways, federation metadata services (to support authentication and authorization), and data services to be deployed adjacent (or on) the data nodes.
5.2 Data from Petascale and Exascale Simulations
In studies [73-75] of the requirements of applications in exascale computing including High-Energy Physics . Climate , Nuclear Physics, Fusion, Nuclear Energy, Basic Energy Sciences, Biology, and National Security it was reported that exascale applications will generate terabytes of data per second making them one of the largest sources of data. For exascale computing this means a new design for memory, I/O, operating system and software systems. It is likely that exascale simulations will behave as observational science does not in terms of reducing data created before seeking to store any results requiring a new integrated pipeline of data creation through to off-line storage.
This data is produced for two important reasons. One is to provide checkpointing for restart and the second is for visualization and analysis of simulation results. As machines grow in performance, the data produced by simulations naturally scales in size but the associated challenges grow even more as the mean time between failure (MTBF) of total system grows and the compute performance of high end supercomputers tends to grow much faster than disk I/O bandwidth is increasing. There have been several studies of these issues recently [76, 78] as part of studies of the next generation exascale systems. The latter will have up to a billion concurrent processes (perhaps arranged as a 1000 threads on each of a million nodes) compared to large simulations today on over 100,000 cores. A new area of study is emerging of processing simulation data in parallel on the nodes of a supercomputer with ADIOS[79] being an interesting approach [80, 81]. A study of fusion simulations [77] identified need to output 2 gigabytes of data per simulated time step for each core in the parallel simulation. For “just” a million cores this corresponds to 2 petabytes of data per time step requiring an aggregate I/O rate of 3.5 terabytes/second for a ten minute time step with a simulation of 1 billion cells and 1 trillion particles. An exascale simulation might be 100 times this rate. These data rates are clearly much larger than those associated with observational data although checkpoint data for example can be overwritten and perhaps visualization data will be analyzed in place (by parallel algorithms on same nodes as simulation) and reduced in size before permanent storage.
6.
Data Context and Curation
Data without context is of little or no value. It matters where data has come from and how it has been processed up to that point. This is the ‘data provenance’ that must be associated with the data for it to be usable by other researchers. Digital information is being generated in large quantities each day and, depending on the source, the data comes with a variety of characteristics and issues - ranging from questions about the appropriateness of the metadata and semantics to describe it, to the integrity and completeness of the data. Finally, all data comes with a cost for keeping it and pragmatic choices must be made about what data to keep and for how long - since it is impractical to retain all the data we are now generating. In some fields, such as particle physics and astronomy, the raw data rates are now so large that only a selection of the data can be retained for future analysis.
– data about the data – to document what the data is, how the data has been collected and what format has been used and so on, and perhaps adding higher-level annotations or semantic information by using ontologies or community-agreed vocabularies. All of these things are necessary to facilitate not only the ‘findability’ of data by search engines but also to allow the possibility of re-use and the creation of meaningful ‘scientific mashups’ of different data sets. Unfortunately, scientists are only human and the process of adding value to their data sets for others to use often receives scant reward. It is therefore not surprising that, all too often, the data curation and preservation procedures used will be imperfect or inadequate and that some important data will end up effectively being lost to future researchers. At least a part of our future occupation will likely to be something like a ‘digital archaeologist’ - trying to make sense of old data by piecing together the fragments of an inadequately documented historic past.
An interesting cautionary tale is that of the digital Domesday Book project in the UK [82, 83]. After William the Conqueror won the Battle of Hastings and took control of what later became the kingdom of England, he decided to take a census of his new realm. The result was the Domesday book completed in 1086 which can still be seen in the National Archives in London. In 1986, 900 years after the original census, the BBC produced a television program to celebrate this anniversary. One result of this project was an interactive video documentary implemented for the BBC microcomputer. At the launch of the UK Digital Preservation Coalition in London in 2002, broadcaster Lloyd Grossman called attention to the danger that the rapid evolution of computer media and recording formats would lead to the irretrievable loss of valuable historic records, and he gave the Domesday Book video-disks as an example. His remark sparked a heroic effort by many people to rescue the digital images, text and video of the BBC Domesday interactive-video project. Eventually,after a lot of work by some exceptionally dedicated individuals, a version was produced in modern formats and that works on a modern PC.
7.
Data Architecture for e-Science
The data deluge is changing the nature of computing in Science and the architecture of systems designed to support it [84]. Several important parameters differ between systems designed to support data analysis and those aimed at simulation. These include
The Ratio of Disk (I/O) bandwidth to instruction execution rate (Amdahl’s I/O number [85, 86])
The bandwidth and connection between source of data and computing system
The nature of data – size and dynamic structure. Is it an instrument or sensor generating a time series or a repository
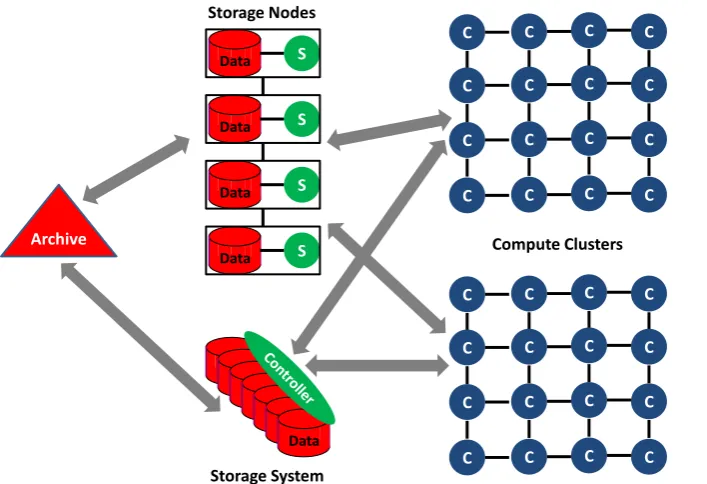
S Data S Data S Data S Data Archive Storage Nodes Compute Clusters C C C C C C C C C C C C C C C C C C C C C C C C C C C C C C C C Data Data Data Data Data Data Data Storage System
Figure 8: Computing System with a three level storage hierarchy supporting multiple clusters where "the work" gets done. Each computer C has its own local disk not shown. S represents a storage noted.
Figure 8 shows a three level data hierarchy with typically temporary data stored on cluster nodes, a shared set of files and a backend archival storage. The shared files are shown in figure as either managed by computers in hosted storage or as dedicated (SAN/NAS/etc.) storage. The shared file system for scientific computing may support high performance distributed file systems such as Lustre or GPFS. This architecture is used for both data and simulation intensive work with good success. There are many attractive features of this architecture including separation of concerns -- storage and its backup are managed separately from the possibly large number of clusters supported, computers and storage can be separately upgraded and a single storage system (and single copy of a data item) supports all computing venues. There is an obvious problem in data intensive applications that the bandwidth between the compute and data system components may be too small. Note clusters typically have bisection bandwidths that are very large scaling up with system size. However the link between storage and compute subsections are typically provisioned with static number of interconnects (perhaps some number of Gigabit or 10Gigabit Ethernet connections). Even simulation systems see the same issues [76, 78] at the largest scales when programs output data (for visualization) at volumes that overwhelm the connection to shared storage. Note important technologies like MPI-IO are built around this model.
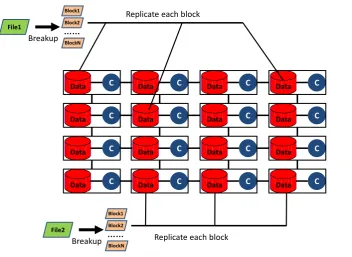
C Data C Data C Data C Data C Data C Data C Data C Data C Data C Data C Data C Data C Data C Data C Data C Data File2 Block1 Block2 BlockN ……
Breakup Replicate each block
File1 Block1 Block2 BlockN …… Breakup
[image:20.595.101.454.81.338.2]Replicate each block
Figure 9: Data Parallel File Systems showing disks attached to compute nodes with files broken into blocks and stored across multiple computers with replications for fault tolerance.
Here we have a simpler architecture with a uniform array of computer nodes with (large) local disks. User Files are broken up into blocks, which are replicated several times and spread across different nodes and different clusters. This architecture allows one to support “bringing the computing to the data” [2, 93]. Archival storage is not necessary – all copies can be stored on spinning disks. The copies should be designed that some are near each other to support local computing whereas at least one should be “far off” to provide a safe back up. Note the disks and compute nodes within a cluster are linked to the scalable cluster interconnect and so good performance in fetching data from disk does not require computing to be on node where data stored but rather on a node with a high performance (cluster) interconnect to data.
The architecture of figure 9 supports several data management systems including both databases and the important NOSQL developments [94, 95] constructs such as Bigtable [96], SimpleDB [97] in Amazon and Azure Table [98] while databases (for example SciDB and GrayWulf projects [26, 86]) essentially collocate data and associated processing. NOSQL technologies emphasize distribution and scalability while their support of simple tables in interesting given that tables are clearly important in science as illustrated by the VOTable standard in astronomy [99] and the popularity of Excel [100]. However, there does not appear to be substantial experience in using tables outside clouds. It seems likely that tables will grow in importance for scientific computing, and academic systems could support this using two Apache projects: Hbase [101] for BigTable and CouchDB [102] for a document store. Another possibility is the open source SimpleDB implementation M/DB [103].
figure 8 one only needs to place files in the shared file system to allow access for all clusters and applications. In figure 9, one has to be more careful and place the data on or “near” (in terms of scalable connectivity) the compute systems that will be allocated to users of the files. There does not seem any experience in supporting the architecture of figure 9 in a complicated heterogeneous multi-user environment. The problem is easier if one just has a few very clusters as is in fact used in clouds used for Internet search. Data parallel file systems on a grid of many (small) clusters seem difficult to use. More study is clearly needed here for multi-user environments in real data centers using data parallel file systems with multiple clusters.
Although DPFS originated in the cloud (internet search) arena, commercial clouds tend to use a rather different object store model seen in Amazon, Azure and the open source OpenStack system. Here one assigns a set of nodes to be storage servers as in the top of the middle layer of figure 8 but rather than the full distributed file semantics of Lustre, one supports a simple object model. Objects have containers and metadata with operations such as get, put, update, delete, and copy objects. Again there is little experience with this in scientific computing arena. The Simple Cloud APIs [111] for file storage, document storage services, and simple queues could help in providing a common environment between academic and commercial clouds. There is also some interesting work [112] involved relating these different file systems, so one can run applications – possibly with performance degradations – however the data is stored. This is closely related to data movement as one needs to change between storage modes and possibly use a replica system as one does for data grids [113].
A traditional approach to scientific data establishes a repository which stores the data and meta-data of a given experiment or set of experiments. As shown in previous sections, this has and will play a critical role but is often inadequate for the common case of enormous amounts of data requiring enormous computing as emphasized in section 4.5. We really need the data archives to be attached to an appropriate compute resource as it is often impractical for individual researchers to download their data to home compute resources.
8.
Conclusions
Figure 10: The DIKW Pipeline with Data and Sensor Grids and Clouds
We have also emphasized that data (interpreted broadly as any component of the DIKW Data Information Knowledge Wisdom pipeline) comes from itself. Figure 10 show that data is passed through a set of (filter) services as it goes along the DIKW pipeline. As in chapter 5, the source of data does not need to be an instrument or sensor; it can be a supercomputer or in fact any service, grid or cloud. Section 6 emphasizes the importance of metadata and sustainability. In section 7, we emphasized the need to re-examine the architectures used to support data intensive science with distributed dynamic data and major compute tasks associated with the data analytics. How do we bring the computing to the data?
Data has arrived; we need to learn how to use it for the benefit of society.
References
1. Tony Hey and Anne Trefethen, The Data Deluge: An e-Science Perspective, Chapter 36 in Grid
Computing: Making the Global Infrastructure a Reality, Fran Berman, Geoffrey Fox, and Tony
Hey, Editors. 2003.
2. Jim Gray, Tony Hey, Stewart Tansley, and Kristin Tolle. The Fourth Paradigm: Data-Intensive
Scientific Discovery. 2010 [accessed 2010 October 21]; Available from:
http://research.microsoft.com/en-us/collaboration/fourthparadigm/.
3. McKinsey Global Institute. Big data: The next frontier for innovation, competition, and
productivity 2011 May [accessed 2011 November 3]; Available from:
http://www.mckinsey.com/mgi/publications/big_data/index.asp.
4. Verisign, THE VERISIGN DOMAIN REPORT THE DOMAIN NAME INDUSTRY BRIEF, August, 2011. 8(3). http://www.verisigninc.com/assets/domain-name-report-august2011.pdf
5. TNW The Next Web. 24 editors & writers across Europe, Australia, Middle East, Africa, Asia
and North & South America: One of the top 10 most influential blogs in the world [accessed
6. Daily Estimated Size of the World Wide Web. [accessed 2011 November 4]; Available from:
http://www.worldwidewebsize.com/.
7. Search Engine Watch. New YouTube Statistics: 48 Hours of Video Uploaded Per Minute; 3
Billion Views Per Day. [accessed 2011 November 4]; Available from:
http://searchenginewatch.com/article/2073962/New-YouTube-Statistics-48-Hours-of-Video-Uploaded-Per-Minute-3-Billion-Views-Per-Day.
8. Greenpeace International. How dirty is your data? A Look at the Energy Choices That Power
Cloud Computing. 2011 April Available from:
http://www.greenpeace.org/international/Global/international/publications/climate/2011/ Cool%20IT/dirty-data-report-greenpeace.pdf.
9. JESS3. A creative agency that specializes in data visualization. [accessed 2011 November 3]; Available from: http://jess3.com/.
10. NIH National Cancer Institute NCI. CIP (Cancer Imaging Program) Survey of Biomedical
Imaging Archives. [accessed 2011 November 4]; Available from:
https://wiki.nci.nih.gov/display/CIP/CIP+Survey+of+Biomedical+Imaging+Archives. 11. BridgeHead Software. Data Management Healthcheck Survey Reveals Health IT's Top
Spending Priorities 2010 14 June [accessed 2011 November 4]; (BridgeHead Software is the
Healthcare Storage Virtualization (HSV) company) Available from:
http://www.ehealthserver.com/research-and-development/535-data-management-healthcheck-survey-reveals-health-its-top-spending-priorities.
12. AoL Energy. Keeping The Lights On: Data Overload And Its Impact On Storage In The Smart Grid. 2011 October 7 [accessed 2011 November 4]; Available from:
http://energy.aol.com/2011/10/07/keeping-the-lights-on-data-overload-and-its-impact-on-storage-i/.
13. UK Department of Energy and Climate Change. Smart Metering Implementation Programme. 2011 March [accessed 2011 November 4]; Available from:
http://www.decc.gov.uk/assets/decc/Consultations/smart-meter-imp-prospectus/1475-smart-metering-imp-response-overview.pdf.
14. UK Office of Gas and Electric Markets ofgem. Smart Metering Implementation Programme:
Data Privacy and Security. 2010 27 July [accessed 2011 November 4]; Available from:
http://www.ofgem.gov.uk/e- serve/sm/Documentation/Documents1/Smart%20metering%20-%20Data%20Privacy%20and%20Security.pdf.
15. IDC. The 2011 Digital Universe Study: Extracting Value from Chaos. 2011 June [accessed 2011 November 4]; Available from: http://www.emc.com/collateral/demos/microsites/emc-digital-universe-2011/index.htm.
16. The Square Kilometre Array. Home Page. [accessed 2011 November 4]; Available from:
http://www.skatelescope.org/.
17. The Square Kilometre Array. Precursors, pathfinders and design studies. [accessed 2011 November 4]; Available from: http://www.skatelescope.org/the-organisation/precursors-pathfinders-design-studies/.
18. P.J. Hall, Richard T. Schilizzi, P. E. F. Dewdney, and T. J. W. Lazio, The Square Kilometre Array
(SKA) Radio Telescope: Progress and Technical Directions. The Radio Science Bulletin (URSI),
September, 2008(326).
http://www.skatelescope.org/uploaded/54709_PHall_RSB_reprint.pdf
19. R. T. Schilizzi, P. Alexander, J. M. Cordes, P. E. Dewdney, R. D. Ekers, A. J. Faulkner, B. M. Gaensler, P. J. Hall, J. L. Jonas, and K. I. Kellerman. Preliminary Specifications for the Square
Kilometre Array. 2007 December SKA Memo 100 Available from:
20. Peter E. Dewdney, Peter J. Hall, Richard T. Schilizzi, and T. Joseph L. W. Lazio, The Square
Kilometre Array. Proceedings of the IEEE, August, 2009. 97(8): p. 1482-1496.
http://www.skatelescope.org/uploaded/8388_Dewdney_IEEE.pdf
21. T.J. Cornwell and Ger van Diepe. Scaling Mount Exaflop: from the pathfinders to the Square
Kilometre Array. 2008 [accessed 2011 November 4]; Available from:
http://www.atnf.csiro.au/people/tim.cornwell/publications/MountExaflop.pdf.
22. A.J. Kemball and T.J. Cornwell. A simple model of software costs for the Square Kilometre
Array. 2004 SKA Memorandum 51. Available from:
http://www.skatelescope.org/uploaded/8648_51_memo_Kemball.pdf.
23. Large Synoptic Survey Telescope. Home Page. [accessed 2011 November 4]; 8.4m wide-field telescope facility Available from: http://www.lsst.org.
24. Rocky Kolb. The Large Synoptic Survey Telescope (LSST). 2005 A Whitepaper prepared for the Dark Energy Task Force Committee Available from:
http://lsst.org/lsst/science/scientist_detf.
25. Large Synoptic Survey Telescope Community Science with LSST. 2011 January 10-11
[accessed 2011 November 4]; 9-13 January 2011 AAS Meeting in Seattle, WA Available from:
http://www.lsst.org/lsst/news/aas_217.
26. SciDB: Open Source Data Management and Analytics Software for Scientific Research.
[accessed 2011 May 25]; Available from: http://www.SciDB.org.
27. NASA. The Earth Observing System Data and Information System (EOSDIS) [accessed 2011 November 4]; Available from: http://earthdata.nasa.gov/.
28. European Space Agency (ESA). Home Page. [accessed 2011 November 4]; Europe’s gateway to space Available from: http://www.esa.int
29. NSF. Ocean Observatories Initiative (OOI) [accessed 2011 November 4]; Available from:
http://www.oceanobservatories.org.
30. UNAVCO. A non-profit membership-governed consortium, facilitating geoscience research
and education using geodesy. [accessed 2011 November 4]; Available from:
http://www.unavco.org/.
31. Alaska Satellite Facility. Downlinks, archives, and distributes satellite-based data to scientific
users around the world. . [accessed 2011 November 4]; Available from:
http://www.asf.alaska.edu/.
32. NASA JPL UAVSAR. Reconfigurable, polarimetric L-band synthetic aperture radar (SAR. [accessed 2011 November 4]; Available from: http://uavsar.jpl.nasa.gov/.
33. DESDynl. A dedicated U.S. InSAR and LIDAR mission optimized for studying hazards and global enviromental change. Science mission providing important observations for land surface change and hazards (surface deformation), and climatic variables (terrestrial
biomass and ecosystem structure and ice dynamics). [accessed 2011 November 4];
Available from: http://desdyni.jpl.nasa.gov/.
34. QuakeSim Cyberinfrastructure supporting Earthquake Science. Home Page. [accessed 2010
March 21]; Available from: http://quakesim.jpl.nasa.gov/.
35. Andrea Donnellan, Marlon Pierce, Dennis McLeod, Jay Parker, John Rundle, Lisa Grant, Rami Al-Ghanmi, Geoffrey Fox, and Robert Granat, Integrating GPS, InSAR, and UAVSAR date into
the QuakeSim Computational Environment in IEEE Aerospace Conference. March 5-12, 2011.
Big Sky, Montana, USA.
http://grids.ucs.indiana.edu/ptliupages/publications/Integrating%20InSAR%20and%20UAVS
AR%20date%20into%20the%20QuakeSim%20Computational%20Environment.docx.
36. Center for the Remote Sensing of Ice Sheets (CReSIS). CReSIS Homepage. [accessed 2009 December 31]; Available from: https://www.cresis.ku.edu/.
38. Jonathan Strickland. How the Large Hadron Collider Works. [accessed 2011 November 4]; How Stuff Works article Available from: http://science.howstuffworks.com/science-vs-myth/everyday-myths/large-hadron-collider3.htm.
39. Coustas Foudas. Overview of the LHC Triggers and Plans for LHC Start-up. 2007 April 13 [accessed 2011 November 4]; Available from:
http://www.docstoc.com/docs/42244651/Overview-of-the-LHC-Triggers-and-Plans-for-LHC. 40. Matthias Mozer, Triggers for New Physics at the LHC. Journal of Physics: Conference Series,
2009. 171 (012101). DOI::10.1088/1742-6596/171/1/01210. http://iopscience.iop.org/1742-6596/171/1/012101/pdf/1742-6596_171_1_012101.pdf
41. Large Hardon Collidor Computing Grid. Worldwide LHC Computing Grid Technical Site. [accessed 2011 November 4]; Available from: http://lcg.web.cern.ch/LCG/.
42. Iberian Grid Collaboration. The CMS Iberian Computing Sites performance in the advent of
the LHC era. 2010 May 24-27 [accessed 2011 November 4]; Available from:
http://www.ibergrid.eu/2010/pdfs/wednesday/3.%20The%20CMS%20Iberian%20Computin
g%20Sites%20performance%20in%20the%20advent%20of%20the%20LHC%20era.pdf.
43. CMS LHC EXperiment. CMS Computing Model [accessed 2011 November 4]; Available from: https://twiki.cern.ch/twiki/bin/view/CMSPublic/WorkBookComputingModel.
44. Ian Bird, Computing for the Large Hadron Collider. Annual Review of Nuclear and Particle Science, November, 2011. 61: p. 99-118. DOI:10.1146/annurev-nucl-102010-130059 45. European Synchrotron Radiation Facility (ESRF). Home apge for joint facility supported and
shared by 19 European countries. [accessed 2011 November 4]; Available from:
http://www.esrf.eu/.
46. The European X-Ray Free Electron Laser Project XFEL. Home Page. [accessed 2011 November 4]; Available from: http://www.xfel.eu/.
47. UK Diamond Light Source. Home Page of UK’s national synchrotron facility. [accessed 2011 November 4]; Available from: http://www.diamond.ac.uk/.
48. Cameron Neylon, Senior Scientist, Science and Technology Facilities Council, Didcot, United Kingdom, Neutron Scattering as Long Tail Science Personal Communication to, Tony Hey. 30 October, 2011.
49. P. Bryan Heidorn, Shedding Light on the Dark Data in the Long Tail of Science. Library Trends, 2008. 57(2, Fall 2008): p. 280-299. DOI:10.1353/lib.0.0036
50. Peter Murray-Rust. Big Science and Long-tail Science. 2008 January 29 [accessed 2011 November 3]; Available from: http://blogs.ch.cam.ac.uk/pmr/2008/01/29/big-science-and-long-tail-science/.
51. EMBL-EBI. European Bioinformatics Institute. [accessed 2011 November 3]; Available from:
http://www.ebi.ac.uk/.
52. EMBL. European Molecular Biology Laboratory. [accessed 2011 November 3]; Available from: http://www.embl.org/.
53. EMBL-EBI. EMBL-EBI's 2010 Annual Scientific Report. [accessed 2011 November 3]; Available from:
http://www.ebi.ac.uk/Information/Brochures/pdf/Annual_Report_2010_low_res.pdf. 54. EBI. Using the Ensembl data hosted on Amazon AWS. [accessed 2011 November 3];
Available from: http://www.ensembl.org/info/data/amazon_aws.html. 55. illumina. HiSeq 2000. [accessed 2011 November 4]; Available from:
http://www.illumina.com/systems/hiseq_2000.ilmn.
56. Haixu Tang, Indiana University, Data sizes for Genomics, Personal Communication to, Geoffrey Fox. May, 2011.
58. Elizabeth Pennisi, Will Computers Crash Genomics? Science, February 11, 2011, 2011. 331(6018): p. 666-668. DOI:10.1126/science.331.6018.666.
http://www.sciencemag.org/content/331/6018/666.short
59. Schatz, M. Cloud Computing and the DNA Data Race. 2011 [accessed 2011 June 26]; Keynote Presentation at 3DAPAS/ECMLS workshops at HPDC June 8 2011 Available from:
http://schatzlab.cshl.edu/presentations/2011-06-08.HDPC.3DAPAS.pdf.
60. NIH. DNA Sequencing Costs: Data from the NHGRI Large-Scale Genome Sequencing Program. [accessed 2011 May 20]; Available from: http://www.genome.gov/sequencingcosts/.
61. Uduak Grace Thomas. NCBI to End Support for Sequence Read Archive as Federal Purse
Strings Tighten. 2011 February 18 [accessed 2011 August 27]; Available from:
http://www.genomeweb.com/informatics/ncbi-end-support-sequence-read-archive-federal-purse-strings-tighten.
62. WCRP World Climate Research Programme. Home page of WCRP facilitating analysis and prediction of Earth system variability and change for use in an increasing range of practical
applications of direct relevance, benefit and value to society. [accessed 2011 November 4];
Available from: http://www.wcrp-climate.org/.
63. WCRP/CLIVAR Working Group on Coupled Modelling. Home Page. [accessed 2011 November 4];
64. WCRP World Climate Research Programme. CMIP5 Coupled Model Intercomparison Project [accessed 2011 November 4]; Available from: http://cmip-pcmdi.llnl.gov/cmip5/.
65. PCMDI Program for Climate Model Diagnosis and Intercomparison. Home Page for PCMDI with mission to develop improved methods and tools for the diagnosis and intercomparison
of general circulation models (GCMs) that simulate the global climate. . [accessed 2011
November 4]; Available from: http://www-pcmdi.llnl.gov/.
66. ESGF Earth System Grid Federation. Home page for ESGF, which is a non-profit organization formed by participates in the GO-ESSP collaboration to bring their knowledge and experience to bear on critical Earth System federations in the dissemination of climate data and related
products. [accessed 2011 November 4]; Available from: http://esg-pcmdi.llnl.gov/esgf.
67. ESG Earth Systems Grid. Home Page for ESG with a Gateway and two major projects ESGF (Earth System Grid Federation) and ESG-CET (U.S. Earth System Grid Center for Enabling
Technologies). [accessed 2011 November 4]; Available from:
http://www.earthsystemgrid.org.
68. NERC Natural Environment Research Council. NERC Data Grid Home Page. [accessed 2011 November 4]; Available from: http://ndg.nerc.ac.uk/.
69. "Collaborative Climate Community Data and Processing Grid" (C3Grid) Home Page.
[accessed 2011 November 4]; Available from: https://verc.enes.org/c3web.
70. METAFOR. Home Page for Common Information Model (CIM) for climate data and the
models that produce it. [accessed 2011 November 4]; Available from:
http://en.wikipedia.org/wiki/METAFOR.
71. Bryan Lawrence. Quality Control, Documentation, and Long Term Support (of the CMIP5
Archive) (& a dose of the IPCC-DDC). 2011 February [accessed 2011 November 5];
"Managing Data to Support the Assessment Process" session at GEOSS Support for IPCC assessment, Geneva Available from:
http://home.badc.rl.ac.uk/lawrence/static/2011/02/01/qc4ipcc.pdf.
72. Karl Taylor. CMIP5 Handling of Model Output. 2011 October 6 [accessed 2011 November 4]; 4th Annual Meeting of the Integrated Assessment Modeling Consortium (IAMC), Austria Trend Hotel Savoyen Rennweg 16, A-1030 Vienna, Austria
http://www.iiasa.ac.at/Research/ENE/IAMC/mtg11/agenda.html Available from:
73. Marc Snir, William Gropp, and Peter Kogge, Exascale Research: Preparing for the Post-Moore Era. 19 June, 2011.
http://www.ideals.illinois.edu/bitstream/handle/2142/25468/Exascale%20Research.pdf. 74. U.S. Department of ENERGY. ASCR News & Resources: ASCR Program Documents. 2011
[accessed 2011 November 3]; Available from: http://science.energy.gov/ascr/news-and-resources/program-documents/.
75. DOE OASCR Workshop on Exascale Data Management, Analysis, and Visualization. 2011 [accessed 2011 November 3]; Available from: http://www.olcf.ornl.gov/event/exascale-2011/.
76. C.S. Chang. Needs for Extreme Scale DM, Analysis and Visualization in Fusion Particle Code XGC. [accessed 2011 July 23]; Center for Plasma Edge Simulation CPES at Exascale data management, Analysis, and Visualization, Feb. 22-23, 2011, Houston, TX, Available from:
http://www.olcf.ornl.gov/wp-content/uploads/2011/01/CSChang_Fusion_final.pdf.
77. Scientific Grand Challenges: Fusion Energy Sciences and the Role of Computing at the
Extreme Scale. [accessed 2011 July 15]; U. S. Department of Energy, March 18-20, 2009.
Washington DC Available from: http://science.energy.gov/~/media/ascr/pdf/program-documents/docs/Fusion_report.pdf.
78. Jacqueline Chen and John Bell. Combustion Exascale Co-Design Center. [accessed 2011 July 15]; 6th International Exascale Software Project Workshop, San Francisco, CA, April 6-7, 201 Available from: http://www.exascale.org/mediawiki/images/3/38/Talk29-Chen.pdf.
79. ADIOS Adaptable IO System [accessed 2011 July 16]; Available from:
http://adiosapi.org/index.php5?title=Main_Page.
80. Jay Lofstead, Fang Zheng, Scott Klasky, and Karsten Schwan, Adaptable, metadata rich IO
methods for portable high performance IO, in Proceedings of the 2009 IEEE International
Symposium on Parallel and Distributed Processing. 2009, IEEE Computer Society. pages.
1-10. DOI: 1-10.1109/ipdps.2009.5161052.
81. Y. Tian, S. Klasky, H. Abbasi, J. Lofstead, R. Grout, N. Podhorszki, Q. Liu, Y. Wang, and W. Yu, EDO: Improving Read Performance for Scientific Applications Through Elastic Data
Organization, in IEEE Cluster. September 26-30, 2011. Austin, TX.
82. The Domesday Book Online. Site to enable visitors to discover the history of the Domesday Book, to give an insight into life at the time of its compilation, and provide information and
links on related topics. [accessed 2011 November 4]; Available from:
http://www.domesdaybook.co.uk/.
83. Jeffrey Darlington, Andy Finney, and Adrian Pearce, Domesday Redux: The rescue of the BBC
Domesday Project videodiscs. Ariadne Web magazine, July, 2003(36).
http://www.ariadne.ac.uk/issue36/tna/
84. Gordon Bell, Tony Hey, and Alex Szalay, COMPUTER SCIENCE: Beyond the Data Deluge. Science, 2009. 323(5919): p. 1297-1298. DOI:10.1126/science.1170411
85. Gordon Bell, Jim Gray, and Alex Szalay, Petascale Computational Systems: Balanced CyberInfrastructure in a Data-Centric World (Letter to NSF Cyberinfrastructure Directorate). IEEE Computer, January, 2006. 39(1): p. 110-112. http://research.microsoft.com/en-us/um/people/gray/papers/Petascale%20computational%20systems.doc
86. Yogesh Simmhan, Roger Barga, Catharine van Ingen, Maria Nieto-Santisteban, Lazslo Dobos, Nolan Li, Michael Shipway, Alexander S. Szalay, Sue Werner, and Jim Heasley, GrayWulf:
Scalable Software Architecture for Data Intensive Computing, in 42nd Hawaii International
Conference on System Sciences. 2009, IEEE. Waikoloa, Big Island, Hawaii. pages. 1-10. DOI:
http://doi.ieeecomputersociety.org/10.1109/HICSS.2009.750.
87. Sanjay Ghemawat, Howard Gobioff, and Shun-Tak Leung, The Google file system. SIGOPS Oper. Syst. Rev., 2003. 37(5): p. 29-43. DOI:10.1145/1165389.945450
88. Hadoop Distributed File System HDFS. 2009 [accessed 2009 December]; Available from:
![Figure 1: Breakdown of Top Level Domains over 5 quarters [4]](https://thumb-us.123doks.com/thumbv2/123dok_us/8129948.241938/3.595.153.439.106.476/figure-breakdown-level-domains-quarters.webp)
![Figure 3: Possible Configuration of SKA and artist's impression of the SKA core [17]](https://thumb-us.123doks.com/thumbv2/123dok_us/8129948.241938/6.595.66.562.509.664/figure-possible-configuration-ska-artist-impression-ska-core.webp)
![Figure 4: Architecture of PolarGrid data analysis Cyberinfrastructure [37]](https://thumb-us.123doks.com/thumbv2/123dok_us/8129948.241938/10.595.119.474.78.368/figure-architecture-polargrid-data-analysis-cyberinfrastructure.webp)