by
Brad Evans
,
Submitted in fulfilment
of the requirements for the degree of
Doctor of Philosophy (Zoology)
University of Tasmania
Molecular markers for abalone research
I hereby declare that:
a) The above thesis contains no material which has been accepted for a degree or diploma by the University or any other institution, except by way of background information and duly acknowledged in the thesis, and to the best of my knowledge and belief no material previously published or written by another person except where due acknowledgment is made in the text of the thesis. Any other assistance is stated below:
My colleagues, Messrs Neville Sweijd (Department of Zoology, University of Cape Town), Jason Bartlett (CSIRO Marine Research) and Nick Elliott (CSIRO Marine Research)
contributed to the development of the species identification technique presented as Chapter 8. Dr. Sweijd had previously developed a protocol for the identification of four abalone species utilising interspecific variation within the sequence of the lysin gene. Our aim was to extend this protocol to cover 11 species of commercial importance in the southern hemisphere. The approach taken to achieve this aim was conceived by a close collaboration between Dr. Sweijd and myself. The development of the protocol, and my role in its design and completion is presented as a prelude to Chapter 8. The validation of the inter-specific nucleotide differences identified by Dr. Sweijd and myself was undertaken by Mr Bartlett, who tested the protocol on large numbers of samples. The manuscript submitted for publication was written by Dr. Nick Elliott in close collaboration with myself.
My colleague, Dr. Neville Sweijd assisted me in the collection and processing of abalone samples in South Africa (Chapter 6). The conceptualisation and development of the methodology and subsequent analysis and interpretation of the data set was conducted independently by myself.
My colleagues, Jason Bartlett and Natalie Conod assisted in the collection of data for chapter 4. This data was collected using markers that I have developed (chapter 2), and all subsequent analysis and investigation of the data was conducted independently by me.
b) This thesis may be made available for loan and limited copying in accordance with the
copyright Act 1968.
JC— 3
Molecular markers for abalone research By Brad Evans
School of Zoology, University of Tasmania, GPO Box 252-05, Hobart, Tasmania 7001, Australia
September 2001
The Haliotidae is a family of marine gastropod molluscs, of the Order Archaeogastropoda (Schremp 1981). The world-wide family consists of 56 currently described species from temperate and tropical waters of both hemispheres. Approximately 25 abalone species are currently harvested commercially from at least 15 countries, with many more taken by recreational fisherman.
This thesis examines the utility of molecular genetic markers in abalone research, with particular emphasis to the Australian fishery and aquaculture industries. The development of microsatellite markers in temperate abalone, and their use in stock structure studies of abalone fisheries in Australia and South Africa are presented.
Twenty-two microsatellite loci were isolated from a Haliotis rubra partial genomic library, and their conservation in 12 other Haliotis species is presented. A maximum of 15 of these markers were retained in the most closely related species, Haliotis conicopora, but the species status of this group is questioned. Only 3 of the microsatellite loci examined were retained in each of two North American species, Haliotis corrugata and H. fulgens. Methods for the detection of microsatellite loci in other species is also discussed.
investigate the structure of H. midae populations in South Africa. Variation at three microsatellite loci was examined at six locations and showed a mean He of 0.528, and revealed a significant decline in the number of alleles from western to eastern samples (West Name = 12.3; East Nallek = 7.7). Highly significant differentiation was observed between samples from the west and east of Cape Agulhas (Fcr = 0.033; P < 0.0001). The results are discussed and compared to the findings of two previous studies and possible explanations are provided for the apparent contradiction between the allozyme data and that provided by mitochondrial DNA and microsatellite variation.
Microsatellite DNA markers were also used to investigate genetic diversity within cultured populations of H. rubra and H. midae in Tasmania and South Africa respectively. All cultured populations examined were the product of wild caught broodstock, and show a loss of genetic diversity, measured as number of alleles per locus, but no associated loss of heterozygosity. The production of 3 H. rubra, H. laevigata hybrid family lines is outlined, and evidence for selection against a microsatellite allele in one of those family lines is presented.
The global problem of abalone poaching is also discussed, and a DNA based PCR-RFLP protocol for the identification of 11 southern-hemisphere species of abalone is presented. The technique utilises variation within short (< 200 bp) fragments of the mitochondrial COI and COII genes, and is simple to perform in most standard genetic laboratories.
This research was funded by CSIRO Marine Research, the Aquaculture CRC Ltd., the FRDC abalone subprogram, Tasmania Police and a small ARC grant.
I thank Boze Hancock of Fisheries Western Australia for samples of H. roei and H. conicopora,
Liz O'Brien of the University of Queensland for samples of H. asinina, Neville Sweijd of the University of Cape Town, South Africa for samples of H. midae and H. spadicea, Phil Critchlow for samples of H. scalaris, Miguel Angel Del Rio of CICESE in Ensenada, Mexico for samples of H. fulgens and H. corrugata, and Rodney Roberts of the Cawthron Institute, New Zealand for samples of H. iris, H. virginea and H. australis.
I thank Pete Cook, Neville Sweijd and Cohen O'Ryan for looking after me at UCT and Genee Harms for the use of the ABI-373 at Groote Schur Hospital, Cape Town. I would also like to thank all the people who made my stay in South Africa so productive and enjoyable, particularly Maria Stacey and Neville Sweijd for taking me into their home and making me feel so welcome. To Verna and all the guys and girls from the Fitz, thanks for everything.
Special thanks must be reserved for the management and staff at the Tasmanian abalone hatchery who led me by the hand through the spawning, settlement and on-growing of abalone for
research, whilst still maintaining their commercial focus
I thank Bob Ward, Dan McGoldrick, Sharon Appleyard, John Benzie, Adam Smolenski, Simon Jarman, Bronwynn Innes, Cath Sliwa, Jason Bartlett, Stan Robert and Peter Rothlisberg for helpful comments on papers arising from this thesis, and for being available to discuss my research and the many small difficulties that arose throughout its course. I thank Alice Morriss for her Excel expertise that I blatantly borrowed to make my life easier this past year.
To my friends, all of whom have been very forgiving of someone who has serially declined social invitations of late, and has made no real efforts to keep in contact. Your support (and the home cooked meals) has been very much appreciated and I will attempt to make it up to you all in the coming months and years. Thanks also to Doiv and the staff at knoppies for supplying an avenue of escape when required.
Thanks to Rob White for his supervision and his funding, and particularly for encouraging me to apply for a scholarship before I got too old! Thanks for letting me control my own research and for the health warnings and pub lunches towards the end.
I offer my greatest thanks to Nick Elliott, who has given me so much of his own time, and
appreciated. Your friendship was as important as your supervision, thank you Nick.
My family also deserve special praise, their emotional and financial support has been amazing throughout my research, they have always believed in me, despite my own concerns, and are always there for me. Mum, thanks for the long walks, talks and many hot dinners. Dad, thanks for wanting to spend time on the water with me, I'm looking forward to many days of relaxing
boating to make up for the days we've missed. Michelle, thanks for being such a great sister to an average brother, typified by the wonderful gift of seeing John's last game, and another Wallaby triumph during such a draining time, it really helped.
This PhD has taken me through hard times and wonderful times, it has made me wonder if I could, and decide that I can. Through this work I met my wonderful girlfriend Carryn, but also because of this work I have been away from her for too long. The end of this thesis marks a new beginning for us both.
Declaration ii
Abstract iii
Acknowledgements v
Chapter 1: General Introduction-Abalone and molecular markers 1
/./ Abalone, Genus Haliotis 1
1.2 Harvesting a resource 1
1.3 History of abalone research 2
1.4 Genetic research 3
1.4.1 Uses in wild fishery 4
1.4.2 Uses in enforcement 5
1.4.3 Uses in aquaculture 6
1.5 Summary of contents 8
Chapter 2: Characterisation of microsatellite loci in the Australian blacklip 10
abalone (Haliotis rubra, Leach)
2.1 Prelude 10
2.2 Published manuscript 10
Chapter 3: Evaluation of microsatellite primer conservation in abalone 13
3.2.1 Microsatellite amplification. 15
3.2.2 H. midae optimisation. 16
3.2.2 H. laevigata and H. fulgens optimisation. 17
3.3 Results 17
3.3.1 Microsatellite amplification 17
3.3.2 Haliotis midae-the South African abalone. 18
3.3.3 Haliotis laevigata- The Greenlip abalone 19
3.4 Discussion 20
Chapter 4: Microsatellite DNA variation in the blacklip abalone, Haliotis rubra
23
Leach in southern Australia.
4.1 Introduction 23
4.2 Materials and Methods 25
4.2.1 Sample collection 25
4.7.2 DNA Extraction 25
4.2.3 Polymerase Chain Reaction 25
4.2.4 Statistical Analysis 26
4.3 Results 28
4.4 Discussion 34
Chapter 5: Identification and explanation of null (non-amplifying) alleles at two
41
H. rubra microsatellite loci.
5.1 Introduction 41
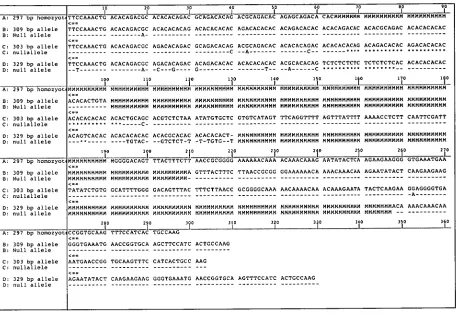
5.2 Identification of null alleles 42
5.3 PCR amplification and sequencing 43
5.3.1 Null 1.25 long PCR 43
5.4 Results 44
5.4.1 Null 1.25 44
5.4.2 Null 2.30 45
5.5 Discussion 47
Chapter 6: A marked genetic discontinuity in stocks of Haliotis midae separated 49
by Cape Agulhas: Evidence from al lozymes, mitochondrial DNA and
microsatellites compared.
6.1 Introduction 49
6.2 Materials and methods 50
6.2.1 Sample collection 50
6.2.2 DNA Extraction 52
6.2.3 PCR amplification of microsatellite DNA 52
6.2.4 Statistical Analysis 53
6.3 Results 54
6.4 Discussion 58
Chapter 7: Abalone culture- application of genetic markers 64
7.1 Introduction 64
7.2 Methods 65
7.2.1 Samples 66
7.2.1.1 South African hatchery abalone 66
7.2.2 DNA Extraction 69 7.2.3 PCR amplification of microsatellite loci 69
7.2.3.1 South African hatchery abalone 69
7.2.3.2 Tasmanian hatchery abalone 69
7.2.3.3 Tasmanian hybrid cohorts 69
7.2.4 Statistical analysis 70
7.3 Results 70
7.3.1 South African hatchery abalone 70
7.3.2 Tasmanian hatchery abalone 74
7.3.3 Tasmanian hybrid cohorts 75
7.4 Discussion 82
7.4.1 Hatchery abalone 82
7.4.2 Tasmanian hybrid cohorts 86
7.4.2.1 Family 2 86
7.4.2.2 Family 4 and 5 87
7.5 Conclusion 88
Chapter 8: Identification of Southern Hemisphere abalone (Haliotis) species by 89
PCR-RFLP analysis of mitochondria! DNA
8.1 Prelude 89
8.2 Lysin gene 89
8.3 Mitochondrial DNA 91
8.4 Haliotis rubra / Haliotis conicopora 95
8.5 Elliott et al (submitted). Identification of Southern hemisphere 98
Chapter 10: Literature Cited 123
Appendices: 139
A Allele frequencies at eight microsatellite loci in samples of 139
H. rubra from south-eastern Australia.
B Allele frequencies for three microsatellite alleles in wild and 145
farmed samples of Haliotis midae in south Africa.
C Allele frequencies at five microsatellite loci in farmed and 146
Chapter 1 Abalone and molecular markers
1.1 Abalone, Genus Haliotis
Abalone are a family of marine gastropod molluscs, of the order Archaeogastropoda (Schremp 1981). The world-wide family consists of 56 currently described species from the temperate and tropical waters of both hemispheres (Geiger 2000). Early research identified a number of genera based on shell form, but this taxonomy was questioned by Cox (1960) who
recommended all species within the family Haliotidae be classified into the single genus
Haliotis until more definitive taxonomic evidence for separating genera became available. Species delineation has been described as tenuous (Brown 1991), and is blurred further by the existence of natural hybrids between morphologically distinct species (Brown and Murray
1992). Geiger (2000) has recently reviewed literature and numerous specimens to produce the most current taxonomic description of the family, but he cautions that these groupings should be used only until a comprehensive phylogenetic analysis of the family is available.
1.2 Harvesting a resource
It is likely that abalone have been harvested by man as a food source for centuries. Geological records in southern Africa suggest that the South African abalone or Perlemoen (Haliotis midae Linnaeus 1758) was utilised by humans as long as 125 000 years before present (Voigt
1988). Evidence from Australian aboriginal middens (a mound consisting of shells of edible molluscs and other refuse, marking the site of prehistoric human habitation) show that abalone have been a significant part of the diet of coastal dwellers since humans first colonised
Australia approximately 40 000 years ago (Bailey 1975). Abalone has been an important resource in many ancient cultures, both directly as a foodstuff and indirectly through the trading of shells. The exploitation of abalone as a commercial resource is a relatively recent activity and is of importance in all of Australia's southern states, and in many countries around the world.
largest proportion of that harvest is from the Tasmanian abalone (Haliotis rubra Leach 1814;
H. laevigata Donovan 1808) fishery (2 565 t in 2000, ABARE 2001).
In addition to the wild fishery for abalone, there is an established and expanding commercial interest in the culture of the genus in at least 10 countries. The major producers of cultured abalone are Japan, China, Taiwan, with rapidly increasing production occurring in Australia, South Africa, Mexico and the USA (FAO 1999).
Abalone is currently marketed primarily in eastern countries with the majority of the wild and cultured product being exported to Japan (84% in 1993-94) and Hong Kong (13% in 1993-94). In 1999-2000 approximately 70% of the total Australian production of abalone was exported as either canned product (2 118 t, ABARE 2001) or fresh, chilled or frozen (1 691 t, ABARE 2001).
1.3 History of abalone research
Carl Linnaeus (Carl Von Linne) provides the earliest record of haliotid research in Systema
Naturae (1758), which contains the original descriptions of many abalone species. Linnaeus also facilitated the publishing of Gmelin's descriptions of New Zealand abalone species in a later edition of the same monograph (Linne 1791). Following these early descriptions, the first biological studies of abalone were produced by the French anatomists Lacaze-Duthiers in
1859 and Wegmann in 1884, and then by Croft in 1929. By far, the majority of haliotid
research has been produced in the late twentieth century and beyond. Since the early 1970s the level of research into various abalone species has increased exponentially, with most
concerned with the basic biology and ecology of abalone species. Research interests have mirrored commercial interests in that time, with the majority of research being directed to species of high commercial value, and the investigation of traits important for the
sustainability of the fishery as well as the ecology of the species.
Early research examined such parameters as age at maturity (Shepherd and Laws 1974 ), growth rates (Hirose 1974), reproductive success (Rho and park 1975), recruitment and mortality (Shepherd 1986), population density (Breen and Adkins 1982), size structure of fished and non-fished populations (Adkins and Stefanson 1977), larval settlement and
In more recent times, the focus of abalone research has shifted towards the conservation of declining abalone resources (Shepherd and Rodda 2000; Shepherd et al. 1998), and to areas more directly related to the expansion of abalone culture (Capinpin et al. 1999; Friedman et al.
2000). As the abalone culture industry expands, so does the need for specific information on spawning, fertilisation, hatching and grow-out of the animals. Diet, water quality and tank design are also areas of research that have seen substantial efforts in recent times.
An example of the shift in research focus can be seen in a review of the papers presented at the 4th International Abalone Symposium held in Cape Town, South Africa (Feb 2000). At this symposium, at least half of the oral presentations covered topics of commercial interest to aquaculture, including larval settlement, diet preference, physical tolerances, growth rates, survival and the evaluation of shore and sea-based culture systems. This is in stark contrast to the 1st International Abalone Symposium held in La Paz, Mexico in 1989, where only 10 aquaculture related papers were presented (of which four were regional reviews) out of a total of 46 papers.
1.4 Genetic research
The influence of genetic research on abalone industries has likewise increased dramatically as molecular techniques have improved and research focus changed. Prior to the initiation of my research thesis, only seven genetic studies of abalone were published (Fujio et al. 1983; Barrett 1989; Brown 1991; Brown and Murray 1992; Jiang et al. 1995; Mgaya et al. 1995; Gaffney et al. 1996). Since the inception of this research in 1997, there has been a
Development of genetic markers in abalone research has, as expected, mirrored their application in other fields. Most genetic investigations of abalone examine population level variation at protein coding allozyme loci. The aim of these studies was to provide a better understanding of the reproductive structure of abalone stocks, so the relevant fishery could be managed at a sustainable level. Early research was often hampered by the suggestion that allozymes were not variable enough to reveal genetic differences between populations that had only recently become reproductively isolated. Advances in genetic technologies have since provided more variable markers such as mitochondrial DNA (mtDNA) and hyper-variable nuclear DNA markers such as microsatellites that are fast becoming the marker of choice for population level analyses (see Ward and Grewe 1995). All these genetic techniques have been trialed in abalone with mixed results, and there are now a number of options available to the abalone researcher.
1.4.1 Uses in wild fishery
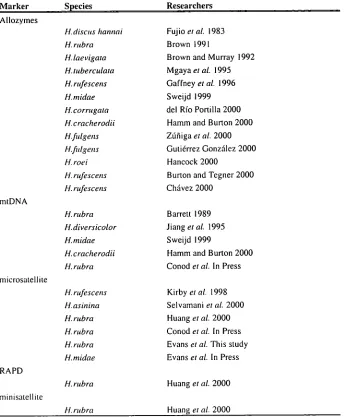
The use of genetic markers in wild fisheries has been a traditional area of genetic research. There have been numerous studies investigating the stock structure of marine species ranging from large pelagic vertebrates (eg. Chow et al. 1997) to sessile invertebrates (eg. Apte and Gardner 2001). Genetic markers have been used to examine the population structure of 12 abalone species. Twenty-one studies of abalone stock structure have been published in the past 20 years (Table 1-1), 13 of which measured genetic variation at protein coding allozyme loci. Five studies have examined mtDNA variation, and recently the microsatellite has become the marker of choice to investigate stock structure in abalone species, with six studies since 1998 examining variation at these highly polymorphic loci (this figure includes Chapters 4 and 6 of this thesis). One of these studies (Huang et al. 2000) also investigated the utility of randomly amplified polymorphic DNA (RAPD) and minisatellite DNA variation in the blacklip abalone,
Table 1-1 Studies of genetic variation within abalone populations
Marker Species Researchers
Allozymes
H.discus hannai Fujio et al. 1983
H.rubra Brown 1991
H.laevigata Brown and Murray 1992
H.tuberculata Mgaya et al. 1995
H.rufescens Gaffney et al. 1996
H.midae Sweijd 1999
acorrugata del Rio Portilla 2000
H.cracherodii Hamm and Burton 2000
Hfidgens Zaiiiga et al. 2000
Hfidgens Gutierrez Gonzalez 2000
H.roei Hancock 2000
H.rufescens Burton and Tegner 2000
H.rufescens Chavez 2000 mtDNA
H.rubra Barrett 1989
H.diversicolor Jiang et al. 1995
H.midae Sweijd 1999
H.cracherodii Hamm and Burton 2000
H.rubra Conod etal. In Press microsatellite
H.rufescens Kirby et al. 1998
H.asinina Selvamani et al. 2000
H.rubra Huang et al. 2000
H.rubra Conod et al. In Press
H.rubra Evans etal. This study
H.midae Evans et al. In Press RAPD
H.rubra Huang etal. 2000 minisatellite
ftrubra Huang etal. 2000
1.4.2 Uses in enforcement
In recent years, the effect of abalone poaching on stock densities and the economic impact on legal fishers has been highlighted by the work of Hauck (1997) and Sweijd (1999) in an examination of the South African abalone fishery. The work in that country has shown that high levels of poaching are organised by sophisticated syndicates who procure, process (dry and canned abalone) and illicitly export the abalone to the Far East. In South Africa, Australia, New Zealand, Mexico, the USA and Canada, abalone poaching has been identified as a
Haliotis sorenseni (Bartsch 1940) is listed as commercially extinct (Tegner 1993; Tegner et al.
1996; Davis et al. 1998), resulting in the closure of the commercial fishery for that species.
Traditionally, valuable fisheries have been protected through the use of closed seasons or areas, size or gear restrictions and catch limitations. These methods of protection have also been employed in most abalone fisheries around the world, but as in every fishery, the
protection is only effective if it can be enforced. The problem faced by many abalone fisheries is the lucrative profits that can be made illegally from the species, leading to more organised efforts by poachers. Whilst there is no substitute for traditional enforcement methods, genetic markers may provide necessary evidence in cases where the identity of the product is in dispute. Genetic markers have previously been used to identify the substitution of endangered fish species for a more common variety (De Salle and Birstein 1996). Recent work has used similar methods to discriminate 11 Southern Hemisphere species of abalone (see Chapter 8), and it is likely that development of genetic identification techniques will proceed rapidly in the coming years, with particular emphasis on commercially valuable marine species.
1.4.3 Uses in aquaculture
The use of genetics, and particularly molecular genetics, in recent years to increase quality and yield in such industries as livestock and plant production, has become standard practice. Genome mapping and the identification of quantitative trait loci (QTLs) using DNA markers is widespread (beef: Moody et al. 1997; crops: Mohan et al. 1997). The application of selective breeding technology to the improvement of aquaculture species has not been so rapid. Reasons for the slower adoption of genetic improvement programs in aquaculture include a lack of maturity of industries and a misunderstanding of the potential economic benefits of initiating breeding programs. This late start has resulted in a limited number of molecular genetic markers available for cultured species, marine invertebrates such as abalone in particular. Because biological traits for all living organisms are under the influence of genes, the same genetic technologies that have been used to improve livestock can be used to improve aquaculture species. The few aquaculture improvement programs conducted to date have yielded impressive results (Bondari 1983; Gjerde 1986; Dunham 1987) and demonstrate that there is enormous potential to dramatically improve productivity of aquaculture systems through selective breeding.
There are five species of abalone presently under culture in Australia: the greenlip
(H. laevigata), donkeys ear (H. asinina Linnaeus 1758), Roes (H. roei Gray 1826), staircase
breeding programs and usually involve multiple individuals of both sexes with little regard for which parents are successful. The application of DNA markers to pedigree analysis within such spawnings would ensure that the number of contributing adults is known and any likelihood of inbreeding in hatchery stocks is highlighted.
The development of molecular DNA markers in abalone species facilitates the use of marker assisted selection in aquaculture. Markers can ensure that broodstock collected from wild populations or produced in family lines are more likely to produce gametes and larvae with improved survival, faster growth and other desirable characteristics than those chosen purely on the basis of gonad size. The use of genetic markers to assist in producing improvements in quality and yield is generally accepted by the consuming public as the animals are not
genetically modified, but simply genetically selected. Molecular DNA markers can also be used to assess the success or impact of stock enhancement programs such as those currently underway in New South Wales, Australia (Fletcher 1999), and Cape Town, South Africa (Sweijd 1999).
Research to improve the diet and grow-out systems of cultured abalone has been underway for several years (eg Uki et al. 1986; Oakes 1988). Growth in abalone is reported to be closely related to genetic factors (Hara 1990; Mgaya and Mercer 1995). If environmental
improvements can be achieved in conjunction with improved broodstock selection, facilitated by the use of molecular markers, then growth rates could be increased by as much as 10 to 20% per generation (Oysters, 21% - Bondari 1983; Atlantic salmon, 14.4% - Gjerde 1986; Channel Catfish, 20% - Dunham 1987). Associated with increased growth rates is often an increase in feed conversion efficiency, so it costs less per animal to farm, in turn leading to greater productivity and profitability for the industry.
1.5 Summary of contents
This thesis enhances the utility of molecular genetic markers in abalone research, with
particular emphasis on their benefits to the Australian fishery and aquaculture industries. The development of a new class of molecular marker in temperate abalone species, and their use in examinations of abalone fisheries in Australia and South Africa are presented. The
enhancement of abalone aquaculture and species identification using molecular genetic techniques is also investigated.
Chapter 2 details the development of a suite of new microsatellite markers in the Tasmanian blacklip abalone, Haliotis rubra. This chapter is published as Evans et al. (2000).
In chapter 3, the conservation of 22 microsatellite primer pairs in another 12 abalone species from around the world is investigated. The chapter includes a discussion of the way in which marker conservation has been reported in the past, and provides insight into the utility of these markers in other commercially important abalone species. This chapter is published as Evans
et al. (In Press).
Chapter 4 is an examination of genetic variation at eight microsatellite loci in the blacklip abalone, H. rubra from ten sites in Tasmania and mainland Australia. Evidence for limited differentiation between Tasmanian and mainland Australian stocks is presented, and compared to previous allozyme and microsatellite examinations. Implications of the data are discussed in the context of fishery management.
Chapter 5 identifies the presence of null alleles at two microsatellite loci. Evidence is presented of point mutations in the primer site(s) of two individuals, and preferential amplification in another individual at one locus. Inefficient amplification is discussed as a causative agent for null alleles at another locus.
Chapter 6 examines the transfer of microsatellite markers designed for H. rubra to an investigation of genetic variation in the South African abalone, H. midae around the South African coast. Evidence of a genetic discontinuity at three microsatellite loci in stocks of H. midae is presented and results discussed in consideration with previous mitochondrial DNA and allozyme data (Sweijd 1999). This chapter has been submitted to Marine Biology for publication.
"family lines". The maintenance of genetic diversity in hatchery breeding and the development of genetic breeding programs is discussed.
Chapter 8 details the development of a protocol for the identification of 11 species of abalone common to the Southern-Hemisphere. The chapter details the problems of abalone poaching in many countries and provides a new technique in the fight against illegal harvesting and
processing.
Chapter 2 Characterisation of microsatellite loci in the Australian Blacklip abalone
(Haliotis rubra, Leach)
2.1 Prelude
This chapter describes the process of the development and characterisation of microsatellite loci in Haliotis rubra. The manuscript presented below, appears as published in Molecular Ecology 9, 2000, and presents details of the first 9 loci that I developed for H. rubra. In total I
developed PCR primers for 22 microsatellite loci, all of which are presented in Chapter 3, and published as Evans et al. (In Press).
2.2 Published manuscript
Evans B, White RWG and Elliott NG 2000. Characterization of microsatellite loci in the Australian blacklip abalone (Haliotis rubra Leach). Mol Ecol 9: 1183-1184
Abalone are gastropod molluscs of the genus Haliotis, a commercially valuable foodsource. Wild stocks are harvested throughout the world in temperate and tropical marine systems by recreational and commercial fishers. The high demand for abalone and the decline in many of the world's natural stocks has led to increasing aquaculture of this genus, and a concurrent increase in the need for genetic information. Haliotis rubra forms the basis of the world's largest wild abalone fishery. In South-Eastern Australia it is the subject of an expanding aquaculture industry. Polymorphic microsatellite DNA markers in H. rubra are being developed principally for population structure analysis and for pedigree analysis, as well as future genetic mapping projects. Their development will be beneficial to both wild fishery managers and aquaculturists. I report here the isolation and characterisation of 9 microsatellite loci in H. rubra.
A partial genomic DNA library was constructed from DNA extracted from gill tissue of a single individual, using a modified CTAB method (Grewe et al. 1993). DNA was digested with Sau3A enzyme and the 500-700 bp fraction was ligated into the dephosphorylated BamHI site of the vector pGEMTm-3Zf(+) (Promega) (Reilly et al. 1999). Ligated plasmids were transformed into XL-1 Blue Supercompetent cells (Stratagene). Cells were plated onto selective media and replicated onto uncharged nylon membrane filters (Boehringer
Mannheim).
determined with ABI Prism Dye Terminator Cycle Sequencing (Perkin Elmer) using double-stranded plasmid DNA, prepared by the alkaline lysis method (Sambrook et al. 1989). Sequencing products were analysed on an ABI377 DNA autosequencer. PCR primers were designed using the OLIGO °computer software (Rychlick 1996), with one primer from each pair labelled with a fluorescent dye. Primers are summarised in Table 2-1.
PCR reactions were performed in a volume of 25 gI., consisting of 67 mM TrisHC1, pH 8.8; 16.6 mM (NI-14)2SO4; 0.45% Triton X-100; 0.2 mg.mL -1 gelatin; 2.5 mM MgCl2; 10 pmoles of each primer; 2001AM dNTPs; 0.5 U Taq Fl polymerase (Fisher Biotech); and — 20 ng genomic DNA template. Amplification was in a Perkin Elmer 9600 thermocycler with one cycle of 94° C for 1 min, 52 - 58.5° C for 15 s and 72° C for 1 min, followed by 30 cycles of 94° C for
15 s, 50 - 56.5° C for 15 s and 72° C for 1 min. These cycles were followed by a final extension step of 72° C for 10 min. Amplification products were initially visualised on 2% TBE agarose gels. Then they were diluted relative to amplification strength, mixed with formamide, loading dye and Genescan Tamra 500 size standard (ABI), denatured at 95° C for 2 minutes, and loaded onto a 4% denaturing polyacrylamide gel. Samples were run on an ABI377 DNA autosequencer and genotypes determined with Genotyper ® software. Observed and expected heterozygosity from at least 14 individuals are shown in Table 2-1.
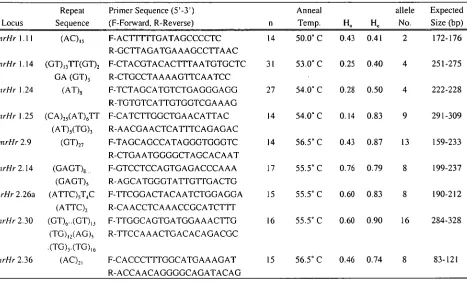
Table 2-1 Blacklip abalone (Haliotis rubra) microsatellite primer sequences, repeat descriptions, annealing temperatures and expected allele sizes. Observed (Ho) and expected (He) heterozygosity are shown for each locus,
based on at least 14 individuals (n). The clone sequences from which the primers were designed have GenBank accession numbers AF194951 to AF194954 and AFI94956 to AF194960.
Locus
Repeat Sequence
Primer Sequence (5'-3')
(F-Forward, R-Reverse) n
Anneal
Temp. Ho Ho
allele No.
Expected Size (bp) CmrHr 1.11 (AC) ,5 F-AC 111[1 GATAGCCCCTC 14 50.0° C 0.43 0.41 2 172-176
R-GCTTAGATGAAAGCCTTAAC
CmrHr 1.14 (GT) 13TT(GT)2 F-CTACGTACACTTTAATGTGCTC 31 53.0° C 0.25 0.40 4 251-275 CmrHr 1.24
GA (GT), (AT),
R-CTGCCTAAAAGTTCAATCC F-TCTAGCATGTCTGAGGGAGG R-TGTGTCATTGTGGTCGAAAG
27 54.0° C 0.28 0.50 4 222-228 CmrHr 1.25 (CA)25(AT) 6TT F-CATCTTGGCTGAACATTAC 14 54.0° C 0.14 0.83 9 291-309
(AT)5(TG) 3 R-AACGAACTCATTTCAGAGAC
CmrHr 2.9 (GT)27 F-TAGCAGCCATAGGGTGGGTC 14 56.5° C 0.43 0.87 13 159-233 R-CTGAATGGGGCTAGCACAAT
CmrHr 2.14 (GAGT)8 F-GTCCTCCAGTGAGACCCAAA 17 55.5° C 0.76 0.79 8 199-237
CmrHr 2.26a
(GAGT), (ATTC) 5T4C
R-AGCATGGGTATTGTTGACTG
F-TTCGGACTACAATCTGGAGGA 15 55.5° C 0.60 0.83 8 190-212 CmrHr 2.30
(ATTC), (GT)6..(GT)13
R-CAACCTCAAACCGCATCTTT
F-TTGGCAGTGATGGAAACTTG 16 55.5° C 0.60 0.90 16 284-328
CmrHr 2.36
(TG), ,(AG), (AC)21
R-TTCCAAACTGACACAGACGC
Chapter 3 Evaluation of microsatellite primer conservation in abalone.
Published as: Evans B, Conod, N and Elliott NG (In Press). Evaluation of microsatellite conservation in abalone. J Shellfish Res
3.1 Introduction
Members of the genus Haliotis, commonly called abalone, are distributed in coastal waters of all continents. Many of the 56 recognised species (Geiger 2000) are harvested commercially or recreationally, and they are a highly valuable marine resource. Abalone populations, like those of most highly prized marine resources, have come under increased legal and illegal
harvesting pressures in recent years as demand for the product continues to rise, and methods for their capture and distribution are refined. Along with the expanding effort within abalone fisheries worldwide, and in some cases the decline of those fisheries, there has been extensive development in the culture of many abalone species (Oakes and Ponte 1996; McBride 1998; Cook 1998). An important technological advancement that will benefit both the culture and wild harvest industries is the development and application of molecular genetic markers.
Molecular genetic markers are widely used in many seafood industries for both wild and aquaculture needs; for example, in salmonids (O'Reilly et al. 1998) and oysters (McGoldrick and Hedgecock 1996). They can be used for applications as diverse as tracking the biological history of populations (Chambers and MacAvoy 2000), or as specific as determining the parentage of individuals in culture (O'Reilly et al. 1998). One such marker that has been applied in other genera (Dallimer 1999; Wu et al. 1999; Nesje et al. 2000) but has only recently become popular in abalone research is microsatellite DNA. Microsatellite markers consist of a nucleotide sequence of between 2 and 6 base pairs repeated in series at a set point on a chromosome (locus). The number of times that sequence is repeated at a single locus varies within (heterozygous individuals) and between individuals (intra-specific variation), and where that same locus is conserved across species, the number of repeats may vary widely (inter-specific variation) (Wright and Bentzen 1994).
Microsatellite markers have been developed from partial genomic libraries of five Haliotis
species: H. asinina (Selvamani et al. 2000); H. discus discus (Sekino et al. 1999);
White and Powell (1997) tested 11 microsatellite markers developed for the hardwood,
Swietenia humilus for conservation within 11 members of the Meliaceae family, representing 7 genera. They detailed 4 species-specific, 1 genus-specific and 3 family-wide markers. This trend of good marker conservation within plant families is supported by other studies such as that by Thomas and Scott (1993) who found that primer sequence conservation existed among grapevine species, and more recently by Rosetto et al. (2000) who showed similar sequence conservation among members of the Myrtaceae family.
Conservation of 11 microsatellite loci developed for the Walleye, Stizostedion vitreum in four species representing two genera of the Percidae family was examined by Wirth et al. (1999) . Three of the markers were conserved in all species tested, two were found to be specific to
Stizostedion genus, four produced amplification from both genera, but not all species within them, and the remaining two markers amplified only one other Stizostedion species. Primer sequences have also shown some conservation across 10 species of 4 genera of lemur, endemic to Madagascar (Jekielek and Strobek 1999).
Huang and Hanna (1998) considered the cross-species amplification of their 3 H. rubra
microsatellite loci in species from USA (2 species), South Africa (2 species), South Korea (6 species) and Australia (5 species). Of the 10 species tested from outside of Australia, only two of the South Korean species produced any amplification product. Within Australian species the markers were more conserved, with at least two of the three loci producing an
amplification product in all Australian species tested, except for Haliotis laevigata, the greenlip abalone, which failed to amplify a product at any of the 3 loci. As H. rubra and
H. laevigata are known to produce hybrids in the wild (Brown, 1995) this latter result is unexpected, and required further examination as the hybrid is being developed as an aquaculture product for which molecular markers are required.
In this paper I describe the cross-species amplification of 21 microsatellite loci (22 primer pairs) developed for use in the Australian blacklip abalone, Haliotis rubra (Leach 1814). Twelve species from Australia (5 species), New Zealand (3 species), South Africa (2 species) and North America (2 species) were tested. These 12 species come from 2 discrete
phylogenetic clusters within the genus based on sperm lysin DNA sequences (Lee and
3.2 Materials and methods
3.2.1 Microsatellite amplification.
The twelve abalone species tested in this study were chosen to provide both close and distant evolutionary relationships to Haliotis rubra. Four species (H. conicopora Peron 1816,
H. laevigata, H. roei, H. scalaris) share a temperate Australian habitat with H. rubra, while
H. asinina is a tropical species from Australian waters. Haliotis australis (Gmelin 1791),
H. iris (Gmelin 1791) and H. virginea (Gmelin 1791) are temperate species from neighbouring New Zealand. The two most prevalent South African species H. midae and H. spadicea
(Donovan 1808) and two species of commercial importance in North America H. corrugata
(Wood 1828) and H. fulgens are examples of distant temperate species.
Twenty-two microsatellite primer pairs were developed for Haliotis rubra (Table 3-1) using methods described in Chapter 2, published as Evans et al. (2000). Their potential for cross-species amplification was tested under standard PCR conditions with DNA extracted from gill or muscle tissue from at least two individuals of the 12 test species using a modified CTAB protocol (Grewe et al. 1993). Such low sample sizes are a problem for determination of diversity indices or population structure, but are sufficient for the detection of the locus in another species.
PCR reactions were performed in a volume of 25 pt consisting of 67 mM TrisHC1, pH 8.8; 16.6 mM (NH4)2SO4; 0.45% Triton X-100; 0.2 mg.mL-I gelatin; 2.5 mM MgC12; 10 pmoles of each primer; 2001AM dNTPs; 0.5 U Tag Fl polymerase (Fisher Biotech); and — 20 ng genomic DNA template. Amplification was in a Perkin Elmer 9600 thermocycler with one cycle of 94° C for 1 min, 50° C for 15 s and 72° C for I min, followed by 30 cycles of 94° C for 15 s, 50° C for 15 s and 72° C for 1 min. These cycles were followed by a final extension step of 72° C for 10 min. Amplification products were separated on 2% TBE agarose gels, and visualised under UV illumination after ethidium bromide staining. Markers were scored as present when a single band of between 75 and 450 bp was detected. Any amplification
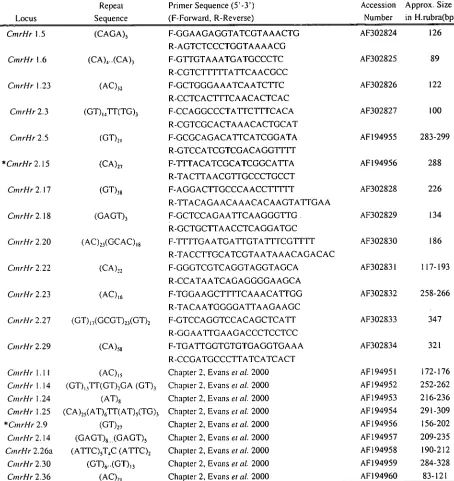
Table 3-1 Characterization of 22 microsatellite primer pairs tested for cross-species amplification in this study. Previously published primers appear last, and a citation is given instead of full sequence. The two primer pairs preceeded by the "* " both amplify the same locus, with CmrHr 2.9 being internal to CmrHr 2.15.
Locus
Repeat Sequence
Primer Sequence (5'-3') (F-Forward, R-Reverse)
Accession Number
Approx. Size in H.rubra(bp)
CmrHr 1.5 (CAGA), F-GGAAGAGGTATCGTAAACTG
R-AGTCTCCCTGGTAAAACG
AF302824 126
CmrHr 1.6 (CA),..(CA), F-GTTGTAAATGATGCCCTC R-CGTCTFITIATTCAACGCC
AF302825 89
CmrHr 1.23 (AC)„ F-GCTGGGAAATCAATCTTC AF302826 122
R-CCTCACTTTCAACACTCAC
CM rHr 2.3 (GT),,TT(TG), F-CCAGGCCCTATTCTTTCACA R-CGTCGCACTAAACACTGCAT
AF302827 100
OnrHr 2.5 (GT),, F-GCGCAGACATTCATCGGATA
R-GTCCATCGTCGACAGGTTTT
AF194955 283-299
*CmrHr 2.15 (CA)27 F-TTTACATCGCATCGGCATTA AF194956 288
R-TACTTAACGTTGCCCTGCCT
CmrHr 2.17 (GT),„ F-AGGACTTGCCCAACCTTTTT AF302828 226
R-TTACAGAACAAACACAAGTATTGAA
CmrHr 2.18 (GAGT), F-GCTCCAGAATTCAAGGGTTG . R-GCTGCTTAACCTCAGGATGC
AF302829 134
CntrHr 2.20 (AC)„(GCAC),, F-TTTTGAATGATTGTA'TTTCGTTTT R-TACCTTGCATCGTAATAAACAGACAC
AF302830 186
CII7 rHr 2.22 (CA) 22 F-GGGTCGTCAGGTAGGTAGCA AF302831 117-193
R-CCATAATCAGAGGGGAAGCA
CmrHr 2.23 (AC)te. F-TGGAAGCFITICAAACATTGG AF302832 258-266
R-TACAATGGGGATTAAGAAGC
OnrHr 2.27 (GT) 17 (GCGT) 23 (GT)2 F-GTCCAGGTCCACAGCTCA'TT AF302833 347 R-GGAATTGAAGACCCTCCTCC
CmrHr 2.29 (CA),, F-TGATTGGTGTGTGAGGTGAAA
R-CCGATGCCCTTATCATCACT
AF302834 321
CntrHr 1.11 (AC),, Chapter 2, Evans et al. 2000 AF 194951 172-176
OnrHr 1.14 (GT)131T(GT),GA (GT), Chapter 2, Evans etal. 2000 AF194952 252-262 CntrHr 1.24 (AT), Chapter 2, Evans etal. 2000 AF194953 216-236
CmrHr 1.25 (CA)25 (AT)6TT(AT) 5(TG) 3 Chapter 2, Evans et al. 2000 AF 194954 291-309
*CtnrHr 2.9 (GT)27 Chapter 2, Evans etal. 2000 AF194956 156-202
OnrHr 2.14 (GAGT),.. (GAGT), Chapter 2, Evans etal. 2000 AF194957 209-235
CmrHr 2.26a (ATTC),T,C (ATTC), Chapter 2, Evans etal. 2000 AF194958 190-212
CntrHr 2.30 (GT)6-(GT)13 Chapter 2, Evans etal. 2000 AF194959 284-328
CmrHr 2.36 (AC) 21 Chapter 2, Evans etal. 2000 AF194960 83-121
3.2.2 H. midae optimisation.
10 ng.i_d_."' and 2 ng.i.tL-1. Amplification products for all 10 markers were not improved by increasing the annealing temperature from 50 to 55° C, but were improved by increasing the DNA template concentration to 10 ng.1.1L-1 in all samples.
The markers were amplified in 8 individuals of H. midae from Cape Hangklip on the south-west coast of South Africa. Products were diluted relative to amplification strength and mixed with formamide, loading dye and Genescan Tamra500 size standard (PE-Applied Biosystems), denatured at 95° C for 2 min and 1.2 p.L loaded onto a 4% denaturing polyacrylamide gel. Samples were run on an ABI377 DNA autosequencer and genotypes determined using Genotyper® software. Allele variation was scored between the 8 individuals.
3.2.2 H. laevigata and H. fulgens optimisation.
All loci that produced an amplification product in one of these two species under standard amplification conditions were subjected to further testing for optimisation. This included a range of annealing temperatures from 48° C to 58° C, "Touchdown-PCR" to improve primer specificity, where the annealing temperature at the beginning of the cycling program was high and then lowered by either 0.5 or 1.0° C each cycle until the lowest selected annealing
temperature was reached. In addition, DNA template concentrations tested ranged from 1 ng.i..1L-1 to 30 ng.IAL-1, and MgC1 2 concentrations tested ranged from 1 mM to 5 mM. All loci were tested on at least 20 H. laevigata or 8 H. fulgens individuals.
3.3 Results
3.3.1 Microsatellite amplification
Nineteen of the twenty-two primer pairs tested successfully amplified a product in at least one species other than H. rubra (Table 3-2). Not suprisingly, the species that appears to have retained the most loci, at 15, is H. conicopora, a species that has been touted as perhaps a sub-species of H. rubra (Geiger 2000). The three other temperate Australian species (H. laevigata, H. scalaris, H. roei) produced an amplification product from twelve of the 22 primer pairs.
Haliotis asinina, the only tropical species included in the study showed sequence conservation in only 5 of the markers tested. The 3 species from New Zealand showed conservation of 5, 5 and 9 markers for H. iris, H. australis and H. virginea respectively. As expected there was little cross-species amplification seen in the North American species H. rufescens and
to particular climatic regimes such as temperate and tropical species. Some primer pairs produced an amplification product that was dramatically different in size to that expected. Where that product was greater than 450 or less than 75 base pairs the marker was denoted by an "a" for altered product size. Although these altered products may contain the same
microsatellite as other amplification products, they can be of little use if they can't be scored reliably. Further sequencing and the design of new PCR primers may prove useful however.
Table 3-2 Cross-species amplification using primers designed for Haliotis rubra. Assays producing a PCR product of expected size are indicated by ÷, those producing multiple bands or no product as -, and those
producing bands of an altered size to that expected are represented by an "a"
CmrHr 1.5 1.6 1.11 1.14 1.23 1.24 1.25 2.3 2.5 2.9 2.14 2.15 2.17 2.18 2.20 2.22 2.23 2.26 2.27 1.29 2.30 2.36 Total
Australia Itrubra + + 4 4. + + + + + + + + + + + + + + + + + + 22
H.laevigata + + + a + a + + a + + + + 4. + 12
H.scalaris + + + 4. 4. + + a + + + + 4. 12
H.conicopora + + + + + .4 .4 4. 4. 4 + a + + + + 15
H.roei + + + + a + + + + a + a + + + 12
H.asinina + a + a + a + + 5
New Zealand H.iris a + + a a + + + 5
H.australis + a + + a + + 5
H.virginea a + + + + + + + + + 9
South Africa H.midae a + + a a + + + + + + + + 10
11.spadicea + + + a + + + + + + 9
North America H.fulgens + a a + a + 3
H.corrugata + a a + + 3
Total 4 5 3 4 5 6 1 12 5 5 6 6 3 1 13 2 7 1 13 6 10 4
Previously, researchers have simply reported agarose gel detection as the retention of a locus in a related species. In this paper I attempt to bridge the gap between identifying the presence of a marker in a related species, and the use of that marker for further research. I present here, three case studies, in which I have taken the markers identified from the preliminary screening tests and attempted to optimize them for routine research in Haliotis midae, H. laevigata, and
H. fulgens.
3.3.2 Haliotis midae-the South African abalone.
The 10 loci shown to produce an amplification product from H. midae in the preliminary screening were: CmrHr 1.23, CmrHr 1.24, CmrHr 2.9, CmrHr 2.15, CmrHr 2.20,
CmrHr 2.23, CmrHr 2.27, CmrHr 2.29, CmrHr 2.30, CmrHr 2.36 (Table 3-2).
[MgC1 2] of between 2.0 and 3.0 mM. The resultant amplification products however were also non-specific and these markers were not examined further.
Two of the markers were monomorphic in the 8 individuals examined and were not tested further in this study. These markers were, CmrHr 1.24 and CmrHr 2.27. It is unlikely that these markers are actually the same locus as that amplified in H. rubra, as they were
somewhat smaller than the product produced in that species, and did not show characteristic microsatellite amplification profiles.
The variation at each of the remaining 6 loci ranged from the minimum of 2 alleles at CmrHr
2.30 (226 - 242 bp), 3 alleles at CmrHr 2.23 (244 - 252 bp), 4 alleles at CmrHr 2.36 (101 - 119 bp), 6 alleles at CmrHr 2.15 (250 - 280 bp), 6 alleles at CmrHr 2.9 (173 -203 bp) and a
maximum of 8 alleles at CmrHr 2.29 (425 - 469 bp).
3.3.3 Haliotis laevigata- The greenlip abalone
Of the 12 markers identified as being conserved in H. laevigata (Table 3-2), only five proved to be reliable for further studies after evaluation in 20 greenlip individuals. The reasons for exclusion of the other 7 markers are listed in Table 3-3, but were due to either non-specific or unreliable amplification. Touchdown PCR cycles failed to clean up the peak profiles of locus
CmrHr 2.22. Two loci, CmrHr 1.6 and CmrHr 1.24 were monomorphic at 81 and 228 bp
respectively in the 20 individuals examined, while the remaining three loci were variable with 7, 6 and 7 alleles detected for CmrHr 2.14, CmrHr 2.23 and CmrHr 2.30 respectively.
Table 3-3 Microsatellite markers initially identified as conserved in H. laevigata, and reasons for their exclusion
from further research. Sample size for testing was n=20.
Locus
accession numbers
Repeat Sequence
Reasons for exclusion
CmrHr 1.6 AF302828 (CA)4..(CA)3 Monomorphic in H. laevigala CmrHr 1.14 A F194952 (GT)13T1'(GT)2GA(GT)3 Non-specific CmrHr 1.24 AFI94953 (AT) Monomorphic in H. laevigata
CmrHr 2.3 AF302827 (GT)14TT(TG)3 Non-specific CmrHr 2.14 AFI 95957 (GAGT)8..(GAGT)5 Suitable for research
CmrHr 2.17 AF302828 (GT)38 Non-Specific
CmrHr 2.20 AF302830 (AC)23(GCAC)15 Unreliable amplification CmrHr 2.22 AF302831 (CA)22 Unscoreable-very messy peaks CmrHr 2.23 AF302832 (AC)16 Suitable for research CmrHr 2.27 AF302833 (GT)15 Unreliable amplification CmrHr 2.29 AF302834 (AC) 55 Unreliable amplification
Haliotis fulgens-The blue abalone from Mexico
The preliminary screening process identified 3 markers that produced an amplification product. These markers were CmrHr 2.3, CmrHr 2.20 and CmrHr 2.27 (Table 3-2).
PCR amplification products were however, always non-specific when visualized on agarose gels after all optimisation conditions. Each product consisted of multiple bands within a small size range, such that allele identification was unreliable.
3.4 Discussion
The development of microsatellite markers is known to be both expensive and time consuming (Wright and Bentzen 1994). Many researchers that have produced microsatellite markers for their species have therefore examined the applicability of those markers to similar questions in related species.
The use of agarose gel detection of PCR products has been utilized for the estimation of microsatellite loci conservation across species by researchers of other taxa (White and Powell
1997; Isagi et al. 1999). Wirth et al. (1999) and Rossetto et al. (2000), however examined these products further by denaturing polyacrylamide gel electrophoresis (PAGE) methods which reveal allele sizes and genotypes. Others have sequenced the markers in the new species to ensure that the locus being amplified does indeed match that expected (Ezenwa et al. 1998).
Whilst the screening of microsatellite markers in related species by sequencing techniques is obviously the most thorough method to determine marker conservation, it is also very
expensive and time consuming. In instances where large numbers of microsatellite markers are being screened across many related species for which markers are not immediately required, this process may be considered to be excessive. Likewise, the optimization of primer pairs for genotyping through either radioactive labels or fluorescence primed, automated detection techniques is also time consuming and expensive. For this reason I took the simplest approach to determining marker conservation within abalone and have then followed this by detailing efforts to optimise the markers identified in the preliminary screening for use in other species.
The three markers suitable for further studies of H. laevigata were CmrHr 2.14, CmrHr 2.23 and CmrHr 2.30. Two of these three markers have been used to determine broodstock contributors in controlled spawnings of H. laevigata I H. rubra hybrids at a commercial culture facility (Chapter 7). Locus CmrHr2.23 was not useful in the hybrid study however, as although it was easy to score in H. laevigata, a third allele of equal intensity to the first two was detected in some H. rubra samples, and in many of the hybrid progeny.
It should also be noted that the optimal conditions for PCR amplification will vary
dramatically with different thermal cyclers. This was exemplified in the transfer of 6 H. rubra
microsatellite loci that produced clean PCR products in H. midae in my research in Hobart, but required extensive re-optimisation when I used them in a genetic variation study in Cape Town, South Africa (Chapter 6). The most obvious reason for this discrepancy was the large variation in ramp times between the respective PCR machines. For this reason any attempt to transfer molecular marker technology between laboratories, and particularly between species will require additional PCR optimisation at the new site. The substitution of specified reagents with those that are cheaper or more readily available may also affect amplification (Chapter 6).
One thing that is often overlooked when testing microsatellite primers is the design of the primer sites. The failure of a particular locus to amplify in another species may not mean that the microsatel lite repeat is not present in that species, but simply that one or both of the primer sites have not been conserved. As the majority of microsatellite primers are published as part of a larger sequence on the Genbank (NCBI) database, the option of primer re-design is available. In this study I have designed two pairs of primers for the CmrHr 2.9 clone, with the
CmrHr 2.9 primers being internal to those of CmrHr 2.15. What I have seen in this case is that the external primers (CmrHr 2.15) were conserved in the South African species, H. spadiceae,
while the internal primers (CmrHr 2.9) were not (Table 3-2). It could be argued therefore that the examination of published sequences, and if necessary the re-design of primer sites, could be a more affordable solution to marker development than the creation of a new microsatellite library.
This study shows that microsatellite loci isolated from Australian blacklip abalone, H. rubra,
can be amplified in some related Haliotis species, but that the likelihood of marker
the UK. What I have seen here, and in the previous study of abalone microsatellites (Huang and Hanna 1998) however, is a much lower rate of marker conservation between
Haliotis
species. This finding together with the very high levels of polymorphism encountered in most abalone species(H. midae -
Chapter 6;H. asinina -
Selvamaniet al.
2000;H. rubra -
Chapter 2, published as Evanset al.
2000), may point towards a more rapid mutation rate ofmicrosatellite repeats and flanking sequence in abalone than that seen in other organisms.
Chapter 4 Microsatellite DNA markers for analysis of population structure in the blacklip abalone, Haliotis rubra around south-east Australia.
This research will be published as part of a more comprehensive analysis of H. rubra population structure around southern Australia that I am undertaking in collaboration with Dr. Nick Elliott and Mr. Jason Bartlett at CSIRO
Marine Research in Hobart.
4.1 Introduction
The blacklip abalone, Haliotis rubra, is one of eight recognised species of abalone in southern Australian waters (Geiger 2000), and is distributed along the south-eastern and southern coastlines of mainland Australia and around the Tasmanian coastline. Haliotis rubra is a large (up to 230 mm), numerous and dioecious abalone with external fertilisation (Shepherd and Laws 1974). The species has planktonic larvae that exist in the water column for
approximately seven days (Sasaki and Shepherd 1995). Despite this larval duration, evidence presented by Prince etal. (1987, 1988) and McShane etal. (1988) suggest that larval dispersal is restricted and the most successful juveniles settle within metres of their parents.
Haliotis rubra supports a commercial fishery in Tasmanian waters worth almost $100 million (1999-2000 ABARE 2000). The fishery is currently managed by a combination of restricted entry, minimum legal size limits, bag limits for recreational fishers, and a Total Allowable Catch (TAC) that is divided into transferable catch units. The current TAC (2001) of 2,800 tonnes is approximately 26.8% of the world abalone harvest, and 50.1% of the Australian abalone harvest (FAO 2001, fishery statistics-capture production 1999). Ongoing research and monitoring by the Tasmanian Department of Primary Industries, Water and Energy, in
collaboration with industry partners, ensures that current management strategies are sufficient for the sustainability of the resource. The Tasmanian blacklip abalone fishery is currently managed as three fishing zones, the northern, eastern and western zones, each of which has a TAC imposed. The present fishery zones however, do not necessarily represent biologically significant divisions, but rather, separate geographic regions. A thorough examination of the genetic structure of Tasmanian blacklip abalone stocks would allow existing management practices to be modified, where required, to protect any genetically isolated stocks that may exist.
around the hatcheries. Such zoning was introduced to prevent the transfer of "alien
genotypes", although evidence to support these zones is limited (Personal Communication: Harry Gorfine, Marine and Freshwater Research Institute, Victoria; Boze Hancock, Fisheries Western Australia).
Existing knowledge of blacklip abalone population structure has been gleaned from a thorough examination of variation at allozyme loci (Brown 1991), and a more recent, but cursory
examination of variation at three microsatellite, two minisatellite and six RAPD DNA markers (Huang et al. 2000). An early study of genetic variation within the mtDNA of blacklip abalone around Tasmania (Barrett, 1989) was hampered by technical problems, but revealed no
differentiation within Tasmanian samples. The genetic information obtained, when combined with studies of larval dispersal in this species (Prince et al. 1987, 1988), have tended to suggest the presence of some geographic structuring in the blacklip abalone population throughout its range. In his allozyme study, that examined samples from the complete species range, Brown (1991) reports large values for gene flow between samples and a large
neighborhood size, but also significant differences in allele frequencies between nearby populations. Brown offers four alternative explanations for this apparent contradiction, and supports a hypothesis of predominantly local recruitment, with the high gene flow estimate being mainly governed by large local effective population sizes, rather than a high migration component. Also raised however is the possibility of predominantly local recruitment, with the high gene flow estimate (Nm) resulting from homogenizing selection of allele frequencies across all local populations. Huang et al. (2000) examine only ten individuals from each of ten sites in southern mainland Australia compared to the mean sample size of 90.3 at 17 locations examined by Brown (1991). Huang et al. (2000) report significant genetic subdivision at three types of molecular markers along the coastline of Victoria and New South Wales. They also report an excess of homozygotes at all three microsatellite loci across all populations and interpret this as a result of inbreeding, due to limited larval recruitment patterns and asynchronous spawning. It should be noted however that they reported no such excess at minisatellite loci, and the allozyme study of Brown (1991) revealed a significant homozygote excess at only 8 of 171 chi-squared tests performed, with only one locus showing this excess in more than one sample.
4.2 Materials and Methods
4.2.1 Sample collection
Samples of Haliotis rubra were collected from seven Tasmanian sites, two in New South Wales and one location in Victoria (Figure 4-1). Tasmanian samples were collected and processed by staff at the Tasmanian Aquaculture and Fisheries Institute, or collected by commercial divers and the shell and viscera were obtained from a commercial abalone processor at Margate, Tasmania. All Tasmanian abalone tissue was stored at —20° C prior to processing, which involved the dissection of gill tissue and subsequent storage at —80 ° C. The samples from New South Wales and Victoria were collected by staff from NSW Fisheries and the Marine and Freshwater Research Institute (MAFRI) respectively. Dissected gill and muscle tissue was preserved in 70% ethanol for transport to Tasmania. Shell length was
measured at the widest part of the shell for all individuals sampled, and sex was determined by an examination of gonad colour, although where this was inconclusive, the animal was
recorded as being immature.
4.2.2 DNA Extraction
Total genomic DNA was extracted using either a modified CTAB protocol as described by Grewe et al. (1993), or commercial Qiaquick DNA extraction kits (Qiagen). Extracted DNA was stored at —20° C.
4.2.3 Polymerase Chain Reaction
Genetic variation was examined at 8 microsatellite loci, CmrHr 1.14, Cmrtir 1.24, CmrHr
1.25, CmrHr 2.9, CmrHr 2.14, CmrHr 2.26, CmrHr 2.30 (Evans et al. 2000) and RubCA1
(Huang and Hanna 1998). PCR amplifications were performed in 96-well plates (Costar) in a total volume of 25 pL. Microsatellite loci were amplified in two separate multiplex reactions comprising 2.5 mM MgCl2, 0.2 mM each dNTP, 2.5 pL of 10X buffer (670 mM Tris-HCL pH 8.8, 166 mM (N144)2SO4, 4.5% Triton X-100, 2 mg.mL-I gelatin), 0.66 units Taq DNA
polymerase, 25 ng of template DNA and the reaction made up to 25 pL with sterile milli-Q water (all reagents from Fisher Biotech). The first multiplex reaction (multiplex 1) comprised 3 pmoles of each CmrHr 1.14 primer, 4 pmoles of each CmrHr 1.24 primer, 1 pmole of each
CmrHr 2.14 primer, 4 pmoles of each CmrHr 2.30 primer and 3 pmoles of each rubCA1
primer. The second multiplex reaction (multiplex 2) comprised 5 pmoles of each primer pair for the three loci, CmrHr 1.25, CmrHr 2.9 and CmrHr 2.26.
All PCRs were conducted in a Perkin-Elmer 9600 thermal cycler. Cycling conditions
annealing at 60-55° C for 30 s, dropping by 0.5° C per cycle; and extension at 72° C for 60 s. This was followed by a further 25 cycles of denaturation at 94° C for 30 s; annealing at 55° C for 30 s, and extension at 72° C for 60 s.
One microlitre from each amplification was diluted in 3 pL of sterile milli-Q water, and 0.7 [IL of this dilution was mixed with 2 [IL formamide, 0.5 j_iL loading dye and 0.5 iL Genescan Tamra-500 size standard (ABI), denatured for 2 min at 95° C, and loaded onto a 4.8% denaturing polyacrylamide gel. Samples were run on an ABI-377 DNA autosequencer and genotypes determined using Genotyper® software.
4.2.4 Statistical Analysis
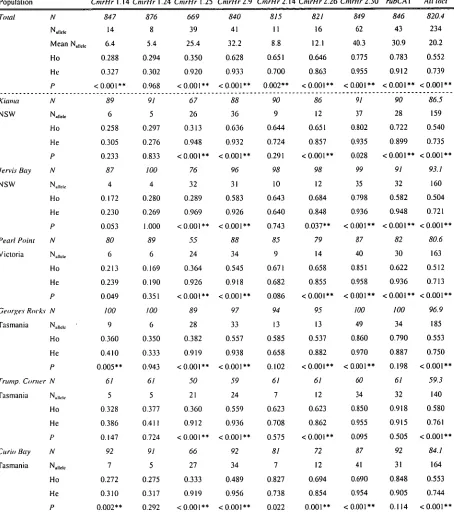
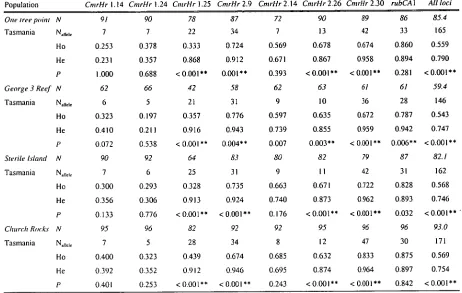
Genetic diversity for each locus per sample site was estimated by the number of alleles per locus and by the observed (H o) and Hardy-Weinberg expected (He) heterozygosity. Ho, He , and tests for deviations from Hardy-Weinberg Equilibrium (HWE) within samples were estimated using GENEPOP Vers. 3.2 (Raymond and Roussett, 1995). An index of heterozygote
deficiency or excess (D), where D = [Ho-Fle] / He (Selander 1970) was also calculated from the heterozygosity estimates. Significance of departure from equilibrium levels was tested by a Markov chain procedure, with significance levels determined after 400 batches of 4000 iterations each.
Linkage disequilibrium was assessed using exact tests in GENEPOP Vers. 3.2 (Raymond and Roussett 1995). Significance of departure from equilibrium levels was tested by a Markov chain procedure, as described above.
ARLEQUIN Vers. 2.000 (Schneider et al. 2000) was used for an analysis of variance of allele frequencies within and among populations (AMOVA), a method based on Excoffier et al.
p A Trumpeter Corner
Curio Bay One Tree Point George Third Reef Sterile Island
A Pearl Point
Kiama Jervis Bay A.
New South
Wales
U
Church Rocks A
A Georges Rocks
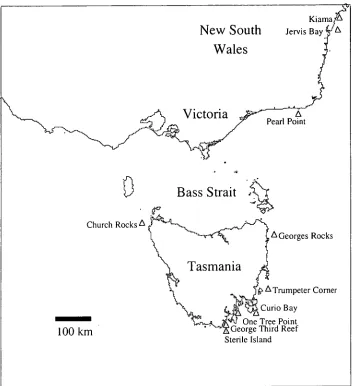
[image:38.560.84.437.87.473.2]100 km
Figure 4-1 Sample sites for the collection of blacklip abalone, Haliotis rubra around south-east Australia.
Complete length and sex data was available for abalone from three Tasmanian samples (George Third Reef, One Tree Point, and Sterile Island). These samples were grouped and then divided into male, female and immature groups. Male and female groups were then compared using the AMOVA method of ARLEQUIN 2000 to provide an FsT value. The same three samples were also divided into small 134 mm), medium (135 - 144 mm) and large
145 mm) size classes, based on shell length measured at the widest point, and another AMOVA between groups performed.
Levels of genetic differentiation among populations were also calculated using RsT (as Rho).