Increases in consumption and harms among young people in
the context of alcohol policy liberalisation
A thesis presented in partial fulfilment of the requirements for the degree of Doctor of Philosophy in Public Health at Massey University, Albany,
New Zealand.
Abstract
Objective: To assess drinking patterns and alcohol-related harms among young people in the context of substantial liberalising alcohol policy change in New Zealand. Five studies were developed to address this objective which assessed: (i) trends in drinking patterns, alcohol-related problems and harms during the time of the liberalising policy change and (ii) specific policy changes relevant to young people in New Zealand: the lowering of the minimum purchase age, the introduction of ready to drinks and alcohol outlet density (alcohol outlets had proliferated due to the relaxation of the liquor licensing system).
Methods: General population alcohol surveys and routinely collected harms datasets
were utilised. Survey measures were: typical occasion quantity, drinking frequency, heavier drinking, self-reported drunkenness, alcohol-related problems and individual demographic measures. Harms measures included: prosecutions for disorder offending, prosecutions for driving with excess breath alcohol, alcohol-involved crashes (all and fatal) and individual demographic measures. Analysis techniques utilised in Studies One through Five were as follows: quantile regression, general linear models, broken stick Poisson regression, logistic regression (and analysis of variance) and multi-level modelling. When possible the wider New Zealand population was considered in relation to young people. Young people were defined as those up to 24 years of age (inclusive).
density were also associated with increased quantities consumed or increased harms among teenagers.
Forward
This thesis is based on five individual, but related, published research studies undertaken during my PhD candidature. Two manuscripts are published in Addiction, one is in press at Journal of Studies on Alcohol and Drugs and two are published in Drug and Alcohol Review. These manuscripts are drawn together to form a PhD thesis fulfilling Massey University requirements.
A sixth study was undertaken as part of this thesis however, in the end, it did not fit cohesively into the theme. This study is included in Appendix 1 (published in Addiction).
I gratefully acknowledge the above journals for allowing these publications to be included in this thesis.
I am first author on all studies and the work I present is my own. My primary supervisor helped me to structure my arguments and statisticians undertook the SAS analysis; therefore Professor Sally Casswell and various statisticians are co-authors on the manuscripts. In one study a Geographical Information Systems analyst was also included as a co-author. Statements of the candidate’s contribution to each publication are in Appendix Five.
Acknowledgements
Table of Contents
Abstract ... ii
Forward ...iv
Acknowledgements ... v
Table of Contents ... vi
List of Tables ... viii
List of Figures ... viii
Introduction ... 9
The legislative framework for alcohol sales in New Zealand ... 11
What was known of the effects of policy change in New Zealand 1990-2004? ... 21
How alcohol policies affect young people (theoretical framing) ... 26
Focus of this research ... 28
Thesis structure ... 32
Link ... 34
Study One: Increases in typical quantities consumed and alcohol-related problems during a decade of liberalising alcohol policy ... 35
Introduction ... 37
Method ... 41
Measures ... 43
Analysis ... 44
Results ... 46
Discussion ... 50
Conclusion ... 53
Link ... 54
Study Two: Increases in quantities consumed in drinking occasions in New Zealand 1995–2004 ... 55
Introduction ... 57
Methods ... 58
Analysis ... 61
Results ... 61
Discussion ... 65
Conclusion ... 67
Link ... 69
Study Three: Trends in alcohol-related harms and offences in a liberalized alcohol environment ... 70
Methods ... 74
Analysis ... 77
Results ... 78
Discussion ... 84
Conclusion ... 87
Link ... 88
Study Four: Ready to drinks are associated with heavier drinking patterns among young females ... 89
Abstract ... 89
Introduction ... 91
Methods ... 93
Results ... 96
Discussion ... 100
Conclusion ... 102
Link ... 103
Study Five: Density of alcohol outlets and teenage drinking: living in an alcogenic environment is associated with higher consumption in a metropolitan setting .. 104
Abstract ... 104
Introduction ... 106
Methodology ... 108
Measures ... 112
Results ... 114
Discussion ... 118
Conclusion ... 120
Conclusions and Recommendations ...121
Conclusion ... 136
References ... 138
Appendix 1 ... 154
Appendix 2 ... 167
Appendix 3 ... 170
Appendix 4 ... 178
List of Tables
Table 1.1: Model specifications ... 47
Table 2.1: Drinking measures by age and gender and significance testing over time ... 62
Table 3.1: National resident population estimates from Statistics New Zealand ... 76
Table 3.2: Model coefficients ... 79
Table 4.1: Estimates for model 1: consumer vs non-consumer of beverages ... 98
Table 4.2: Estimates for model 2: amount of beverage consumed ... 98
Table 5.1: Descriptive statistics for measures used in analysis ... 115
Table 5.2: Model estimates ... 117
List of Figures Figure 1.1: Typical occasion quantity ... 48
Figure 1 2: Threshold problems ... 49
Figure 1.3: Non-threshold problems ... 50
Figure 3.1: Trends in rates of prosecutions for disorder offences ... 80
Figure 3.2: Trends in rates of prosecutions for excess breath alcohol ... 81
Figure 3.3: Trends in rates of all and fatal crashes ... 83
Figure 4.1: Percentage of drinkers consuming RTD’s by age and gender ... 96
Introduction
Market liberalisation and alcohol industry lobbying fuelled the systematic erosion of effective alcohol policy controls in New Zealand. The year 1990 signalled the start of a decade in which liberalising policy change transformed the alcohol environment and from which alcohol emerged as more visible and available than ever before. Increases in the physical availability of alcohol occurred via proliferating alcohol outlets, extended trading hours, changes to the beverage distribution system and days of sale. Increases in the promotion of alcohol occurred due to the deregulation of alcohol advertising in the broadcast media and later the introduction of more sophisticated marketing techniques, including the introduction of ready to drinks (alcopops). The minimum legal purchase age was also lowered from 20 to 18 years.
A direct way of studying alcohol policy interventions, such as those above, is to study alcohol measures when there is a policy change (Room, 2004). In New Zealand, several research studies were implemented investigating alcohol measures during the time of liberalising alcohol policy changes and it was within the framing of these studies that the majority of this thesis was written.
consumption among young people has been linked to a wider choice of drinks, drinking establishments, longer trading hours and sophisticated and targeted alcohol marketing (Measham & Brain, 2005). These are many of the same influences that young people in New Zealand have been exposed to, although here with the addition of the lowering of the minimum purchase age.
Young people may also be more vulnerable to the effects of liberalising alcohol policy changes. Measham and Brain argue that as traditional norms and values disappear so do those that may limit heavier drinking. As young people have lost traditional sources of identity including the nuclear family, identities are formed in the market and this is particularly so in relation to consumption (Measham & Brain, 2005).
There are several concerns from a public health perspective. Adolescence is a time of substantial neuromaturation that is disrupted by alcohol. Binge drinking can damage the forebrain, particularly the prefrontal cortex, which drives impulse inhibition, paying attention, making decisions and goal setting (Monti, Miranda, Nixon, Sher, Swartzwelder, Tapert et al., 2005). Binge drinking is also related to impairment of working memory processes in young adults aged 18-25 years (Crego, Holguin, Parada, Mota, Corral, & Cadaveira, 2009). Furthermore, in New Zealand, the burden of alcohol-related mortality and morbidity is disproportionately experienced by younger people aged 15-29 years (Connor, Broad, Rehm, Vander Hoorn, & Jackson, 2005).
The legislative framework for alcohol sales in New Zealand
The New Zealand policy environment in the 1980s and 1990s was characterised by considerable neo-liberal economic reforms (Evans, Grimes, Wilkinson, & Teece, 1996). The reforms promoted market liberalisation and free trade, limited government and a deregulated labour market (Evans et al., 1996; Kelsey, 1995). While many countries have engaged in deregulatory reforms, ‘the New Zealand experiment’ (Kelsey, 1995) has been described as the most noticeable example of policy liberalisations in the economically developed world (Evans et al., 1996). Many Governmental Acts were liberalised as part of these reforms including the main legislative document controlling the sale and supply of alcohol; the Sale of Liquor Act 1962.
Sale of Liquor Act 1989 (implemented 1st April 1990)
The new Sale of Liquor Act in 1989 was “to establish a reasonable system of control over the sale and supply of liquor to the public with the aim of contributing to the reduction in liquor abuse, so far as that can be achieved by legislative means” (Sale of Liquor Act, 1989). A “reasonable system of control” reflected the underlying philosophy of market liberalisation while “contributing to the reduction in liquor abuse” reflected the social goal of the Act (Hill & Stewart, 1996). The 1989 Act was not to restrict the sale and supply of liquor, as in the past, but to promote safe and legal drinking (Ministry of Justice, 1996).
evidence that a new liquor outlet was “necessary or desirable” to meet the needs of the public (Hill, 2004a). The new licensing system removed this requirement under the philosophy that liquor licences would be ‘easy to get but easy to lose’ (Hill, 2004a).
Under the new licensing system liquor licences were easy to get as there were few means under which they could be refused. A new liquor licence application could only be refused on the grounds of the ‘suitability’ of the applicant determined by a police check. If a history of criminal record, drug convictions, drink driving or recent loss of liquor licence in another location was uncovered this would deem an applicant unsuitable (Hill, 2004a, 2004b).
Liquor licences were also meant to be easy to lose however as time progressed it became clear that they were not. Licence cancellations were difficult to obtain and prosecutions uncommon (Hill, 2004a; Hill & Stewart, 1996). The wider impacts of liquor outlets on the community or public health evidence could not be considered in decisions to grant, review or cancel licences as each licence had to be considered on its own merits against narrow criteria in the legislation (Hill, 2004b). Criteria for loss of licence included evidence of infringements of the Sale of Liquor Act laws, selling to minors or poor management. Poor management could lead to loss of licence more easily than any infringements of the Act as it reflected on the suitability of the licensee (Hill, 2004a).
alcohol outlets were left to the Resource Management Act 1991 which, in practice led to a significant gap in jurisdiction (Hill, 2004a).
With the control of locations of liquor licences now under the Resource Management Act effectively a licence application could not be refused on the basis of location. The Resource Management Act was used by local governments (city councils) to zone land for residential, business or other purposes (as part of Local District Plans). However the broad zonings used in Local District Plans did not address the suitability of locations for alcohol outlets (Hill, 2004a). This meant there was a considerable gap between planning and licensing. Once resource consent for a liquor outlet had been granted under the Resource Management Act it was not possible, under the 1989 Sale of Liquor Act, for the licence to be refused on the basis of location (or for communities to effectively object to an application on the basis of location). If a new applicant was judged suitable to hold a licence and had resource consent they were granted a licence (Hill, 2004a). As such liquor outlets were able to open in undesirable locations such as near schools.
and the UK the Liquor Licensing Authority had little discretion or flexibility in its decision-making (Hill, 2004b).
The licence criteria and conditions in the 1989 Act did include new host responsibility requirements. Food had to be available in on-licensed premises, as well as non-alcoholic beverages. More focus was placed on host responsibility around food and intoxication (Hill, 2004a). However prohibitions in the Act against the serving of intoxicated patrons were not clear-cut, inhibiting enforcement (Hill & Stewart, 1996).
The availability of alcohol was also increased under the 1989 Sale of Liquor Act by the liberalisation of trading hours. On and off-licensed premise hours were made a condition of each individual licence and applicants could apply for very late closing times or licences to operate 24 hours a day. Hours could be determined by the type and location of an outlet (based only on land use), licensee, clientele and style of operation (New Zealand Law Commission, 2010). However hours were mainly based on what the applicant asked for unless a local government policy on acceptable hours of trading was in operation which had occurred in some areas (Hill pers com 2011. Hill, 2004b). Hours were however a discretionary condition, meaning that the national body, the Liquor Licensing Authority, could cut back the closing times of premises associated with late night problems such as intoxication (Hill & Stewart, 1996).
Following the 1989 Act, alcohol outlets traded considerably later than before. On-premise outlets, with residential neighbours, operated until 11pm on weeknights and midnight or 1pm on weekends. Bars and nightclubs in cities traded to 3am or 5am (Hill, 1998). Off-licensed premises did not trade after 10 or 11pm. Prior to 1989, on-licensed premises would trade between 9am and 10pm or 11pm with off-licensed premises hours normally restricted to between 8am and 7pm (New Zealand Law Commission, 2010).
Further increases to the availability of alcohol were introduced under the 1989 Act. Wine, of around 11% alcohol content, was permitted for sale in supermarkets and grocery outlets. Grocery outlets that met a minimum size requirement, typically larger than small corner shops, were permitted to sell wine (Sale of Liquor Act, 1989). This aspect of the Act was to encourage a more Mediterranean style of drinking pattern by positioning wine alongside food.
Alcohol taxation 1989
Very low levels, under 3%, were not excised and the rate was higher for absolute alcohol by volume above 24.0 percent (i.e. spirits). The excise duty was increased automatically in line with changes in the consumer price index although the spirits excise rate was not linked to inflation until 2002/03 (Easton, 2002).
Alcohol advertising deregulation 1992
Substantial deregulation of alcohol advertising occurred in 1992. Prior to 1992, during the 1980’s, all broadcasting was controlled by the state and no alcohol ads were permitted. From 1981 off-licensed premises were allowed to advertise the availability of alcohol on television and radio without mention of prices or alcohol brand names. In 1987 sponsorship and corporate alcohol advertising were permitted on television and radio. Brand names could only be mentioned if the brand name was part of, or identical to, the name of the advertiser (New Zealand Drug Foundation, 2006).
In the context of the economic reforms, in part due to the free market philosophy and privatisations and with considerable pressure on the media and advertising industries to increase revenue, brand advertising of alcohol was permitted in the broadcast media in 1992. Advertising on television was permitted from 9pm to 6am. Brand advertising of alcohol was also permitted on the radio (New Zealand Drug Foundation, 2006).
Random compulsory breath testing 1993
There was one policy area in which restrictions had consistently been increased: the law against drink-driving. On the 1st of April 1993 Compulsory Random Breath Testing was introduced under the Land Transport Act. Police now set up check points at which all drivers were to be breath tested. At the same time the legal limit for drivers under 20 years was reduced: 0.03mg/ml compared to 0.08mg/ml for those over 20 years. A substantial enforcement and advertising effort occurred from late 1995 (Guria et al., 2003).
Introduction of ready to drinks 1995
A relaxation of customs policy in the early 1990s contributed to the introduction of spirit-based ready to drinks known internationally as alcopops. Previously there were two licences to import spirits in New Zealand and these were held by the two major breweries. The relaxation meant that cheap spirits could be parallel imported and were subsequently used to make spirit-based ready to drinks. Initially, these beverages were brightly coloured and with an alcohol content of around 5%. From around 1995 the availability and range of ready to drinks expanded rapidly to include many brands, types and flavours. In 2000s stronger bourbon and colas aimed more at males were introduced, some with around 8% alcohol content (Huckle et al 2008b).
Amendments to the 1989 Sale of Liquor Act
Several arguments were put forward in support of lowering the purchase age. A perception existed that the exemptions in legislation before 1999 created difficulties in enforcing the law. Prior to 1999 18-19 year olds could drink in on-licensed premises if
an parent guardian or adult spouse or relative was present or if the alcohol was
accompanied by a meal or entertainment (Ministry of Justice, 1996). An election was near and the votes of those aged 18-19 years were wanted. The hospitality industry argued there was already a de-facto age of 18 years. The 1999 amendments were intended to simplify the law and improve its enforceability, thereby creating “a hard 18, No ID, no sale culture” (Alcohol Health Watch 2004).
It was in the above context, that the purchase age was lowered to 18 years. Photo age ID was introduced as proof of age at licensed premises (if requested). The three recognised evidence of age documents, as now defined in the Act, were a passport, a photo driver licence, or a Hospitality Association of New Zealand 18+ card with a photo (Lash, 2005). However no extra resources to monitor or enforce these amendments were provided (Hill, 2000).
were doubled for licensees convicted of selling alcohol to minors (Hill, 2000), although licence suspension or cancellation was the preferred enforcement route (Hill pers com 2011).
The 1999 amendments further increased the availability of alcohol with the introduction of Sunday trading for all licensed premises. Previously Sunday trading was not permitted in premises for which the primary business was selling alcohol or drinking. It was however permitted for restaurants while serving meals. Nightclubs could also open on Sundays on condition that food or entertainment was provided, indicating that drinking was not the primary business (Hill, 2000). The 1999 Act removed this restriction under the philosophy that “partial prohibition on Sundays was unfair to pubs, inconvenient to shoppers and considered silly by tourists” (Hill, 2000, p.7).
Also substantially increasing the availability of alcohol was the introduction of beer for sale in supermarkets and grocery outlets in 1999. This was a compromise to a proposal that all alcohol retailers should be permitted to sell all beverages, including spirits and ready to drinks. (Hill, 2000).
Liquor bans 2002
At the local government level liquor bans were introduced in 2002. Although the Local Government Act was amended in 2001 to allow local government to implement liquor bans for longer than 24 hours which had not been possible under the 1974 Act. Due to an error in the 2001 amendment it was not until 2002 that the new liquor bans were implemented. By 2004 some 30 local governments had year round liquor bans (alcohol free zones) often at beaches, parks and city centres. A further 15 had seasonal bans at beaches or for events such as New Year’s Eve. By 2004 liquor bans were in operation on the weekend in at least four large cities (Webb, Marriot-Lloyd, & Grenfell, 2004).
Light spirits tax change 2003
Light spirits were cheap and popular among young people. These beverages were sold in 1125 litre bottles with strength of 23% alcohol content. The New Zealand tax scale had only a few broad categories and light spirits content slipped under the tax band of 14-23% intended for products such as fortified wines (SHORE, 2006a). This meant that light spirits were taxed at a low rate relative to alcohol content. From 2003 the highest tax rate i.e. the spirits tax rate was applied to beverages with an absolute alcohol by volume above 14.0 percent, thereby covering light spirits (Easton, 2002).
Conclusion
What was known of the effects of policy change in New Zealand 1990-2004?
Effects of the Sale of Liquor Act 1989
As a result of the relaxation of the licensing system liquor outlets proliferated in New Zealand during the 1990s. Between 1990 and 1995 an increase of 4,600 liquor licences occurred (Hill & Stewart, 1996). By 2002 this figure had further increased by 3,200 licences, making a total increase of over 7,800 liquor licences between 1990 and 2002. Between 1990 and 2006 the number of liquor licences increased from 18 per 10,000 New Zealanders to 35 per 10,000 people including on, off and club licences (i.e. sports clubs). (Data obtained from the Liquor Licensing Authority 2006). The introduction of wine into supermarkets and grocery outlets contributed to this increase in licences, however, bottle shops also proliferated as did a range of on-premise drinking opportunities.
The proliferation of bars and nightclubs with longer trading hours facilitated a burgeoning youth focussed night time economy that promoted consumer excess (McEwan, Campbell, & Swain, 2010). By 1995, around a third of 16-17 year olds and three quarters of 18-19 year olds had consumed alcohol at bars in the previous 12 months. Around one fifth of 16-17 year olds and two thirds of 18-19 year olds had consumed alcohol in nightclubs (Habgood, Casswell, Pledger, & Bhatta, 2001). Between 1990 and 1994 the average typical occasion quantity consumed at nightclubs by 14-19 year olds was around 3 drinks (a drink here is defined a 15ml pure alcohol). By 1997 this amount had increased to almost 6 drinks per typical occasion.
associated with premises open later or premises open last. When outlets closed at different times migrating drinkers, often intoxicated, would be attracted to the latest open outlet to continue drinking (Hill & Stewart, 1996). Also in city centres, with longer trading hours or 24 hour trading, drunk drivers were caught on the road at 7 am and 8 am when people were travelling to work and school (Hill & Stewart, 1996).
The introduction of wine for sale into supermarkets and grocery outlets was associated with a 17% increase in estimates of wine available for consumption (Wagenaar & Langley, 1995; Zhang & Casswell, 1999). The real price of wine declined following its introduction into grocery outlets which was reported to have, in part, contributed to the increase in wine consumption. A decrease in spirits consumption was also found suggesting some beverage substitution (Zhang & Casswell, 1999). Women, in particular, felt more comfortable purchasing wine from the supermarket and were able to avoid the stigma associated with visiting a specialised alcohol outlet (Wyllie, Holibar, Jakob-Hoff, & Casswell, 1993).
Effects of Alcohol Advertising Deregulation 1992
Alcohol advertising substantially increased following the introduction of the brand advertising in the broadcast media in 1992. Expenditure on alcohol advertising in the broadcast media increased from around $8 million dollars in 1991 to around $27 million by 1993 (inflation adjusted dollars) (Huckle & Huakau, 2007). Shortly after the introduction of brand advertising young people were exposed to a fourfold increase in televised alcohol advertising (Wyllie, Waa, & Zhang, 1996).
televised brand alcohol advertisements among the same respondents at age 18 years and, then again, at 21 years. Results showed that those who exhibited positive liking of alcohol advertising and brand allegiance at age 18 drank larger volumes of beer at age 21. This result was found independently of volumes consumed at age 18 years. It was also found that liking and allegiance influenced volume but that this relationship was not reciprocal (Casswell & Zhang, 1998).
Effects of Random Compulsory Breath Testing 1993
Random compulsory breath testing was initially effective in reducing alcohol-involved traffic crashes. A reduction in the proportion of alcohol-involved traffic crashes including fatal crashes was reported for the New Zealand population between 1995 to 1999 (Guria et al., 2003). It was apparent however that the effectiveness of this policy change had plateaued following the 1999 Sale of Liquor Act amendments that had increased the availability of alcohol and lowered the minimum purchase age.
Effects of the introduction of ready to drinks 1995
Effects of the Sale of Liquor Act amendments 1999
Research that was undertaken in New Zealand in relation to the 1999 Act amendments had focused on the lowering of the purchase age, from 20 to 18 years. An increase in presentations for intoxication at an emergency department was reported among 18-19 year olds (Everitt & Jones, 2002). An increase in alcohol-involved crashes was found for 15-17 year olds nationally (Guria et al., 2003). Pseudo-patron purchase surveys found that it was very easy for 18 year olds to purchase alcohol without age ID in Auckland, New Zealand’s largest region, following the lowering of the purchase age (Huckle, Conway, Casswell, & Pledger, 2005a).
Effects of the 2003 light spirits tax change
The tax increase on light spirits in 2003 dramatically decreased the popularity of this beverage type (SHORE, 2006a). However, prior to the tax increase, light spirits were consumed considerably less, at the total population level, than ready to drinks or any other beverages in New Zealand (Data supplied by Statistics New Zealand).
Trends in alcohol consumption
months between 1995 and 2000; for females increases were found for those 14-15, 16-17 and 30-39 years.
Unpublished survey data from Auckland, New Zealand’s largest region, between 1990 and 1999 found an increase in typical occasion quantity in the last 12 months among the sample aged 14-65 years, with 14-19 year olds increasing at a higher rate. There was no increase in frequency of drinking in the last 12 months over the time of the surveys although a drop occurred between 1990 and 1992 (Casswell & Bhatta, 2001).
With respect to total population consumption (alcohol available for consumption) – according to Statistics New Zealand long term data series, a decline occurred between 1990 and 1997 despite the proliferation of liquor outlets, longer trading hours, the introduction of wine for sale in grocery outlets, the introduction of alcohol brand advertising in the broadcast media and the introduction of ready to drinks. It was likely that total population consumption was underestimated during the 1990’s due to a failure to account for the increasing alcohol content in wine along with the increasing market share of wine (informed by Chikritzhs, Allsop, Moodie, & Hall, 2011, Statistics New Zealand data during the 1990s, and Alston, Fuller, Lapsley, Soleas, & Tumber, 2011). It was also possible that total population consumption was not reflecting behaviour in population subgroupsa.
Conclusion
There was some evidence to suggest that several policy changes were associated with changes in behaviour at the population level in New Zealand, including the introduction
a Total population consumption increased after 1997. Further discussion of total population
of wine into grocery outlets and the introduction of Random Compulsory Breath Testing. However prior to this thesis commencing there had been very few published empirical studies examining consumption or related harms related to policy changes among young people. Those that existed had focussed on effects of alcohol marketing deregulation (Casswell & Zhang, 1998) and the lowering of the minimum purchase age (Everitt & Jones, 2002; Guria et al., 2003). These studies had focussed on a specific policy change and no published data were available documenting trends over time in consumption or harms for young people. There were also several other areas where no research existed even though data showed, for example, that there had been an increase in the number of alcohol outlets and an increase in the consumption of ready to drinks, both of which, were likely relevant to young people.
How alcohol policies affect young people (theoretical framing)
Alcohol control policies influence the physical availability of alcohol, alcohol advertising and other marketing approaches, such as the introduction of new products, the enforcement of alcohol laws and the price of alcohol (Babor, Caetano, Casswell, Edwards, Giesbrecht, Graham et al., 2003). Alcohol control policies that liberalise the alcohol environment can increase levels of consumption and harms (Babor et al., 2010).
Differential effects of policy
Liberalising alcohol policy is likely to have more effect on individuals and sub groups of the population constrained by the old policy (Room et al., 2002). People whose consumption is lower than their desires, because of the restriction, will be more affected by liberalising policy change. For example, “a price reduction would affect those people most who, before the reduction, would have drunk more alcohol if only it weren’t for the money”. Those who are satisfied with their level of consumption will be less affected by liberalising policy change (Room et al., 2002, p.33).
The social and cultural context of a policy may contribute to differential policy effects. Policy effects may vary because of, for example, the level of social acceptance of drinking among a population group when a policy is introduced (Room et al 2002).
However it is also feasible that a policy implemented at a wider population level but particularly effective with a particular population group may be related to a differential effect. For example the images and communication technologies used in alcohol advertising have significant appeal to young people (Babor et al., 2010). The advent of new marketing strategies, including the development of new products such as ready to drinks have been specifically aimed at a new generation of young alcohol consumers and designed to meet the needs of particular groups of young people (Brain, Parker, & Carnwath, 2000; Casswell, 2004).
(Stockwell & Gruenewald, 2004) i.e. exposed to the effects of others drinking and those who expose themselves to heavier drinking (Pers com. Gruenewald 2011).
It could also be possible that when many liberalising policy changes are introduced, as has been the case in New Zealand, that differential impacts may occur among the groups for whom the most liberalising policy changes were relevant.
Focus of this research
Alcohol use and related problems among young people are predicted by environmental and individual factors (Birckmayer, Holder, Yacoubian, & Friend, 2004). Such factors were utilised in the conceptualisation of this research and are described below:
Physical availability: defined as “the availability of alcohol in one’s physical environment mediated by the likelihood that one will come into contact with these sources of drink”
(Stockwell & Gruenewald, 2004, p.217). The physical availability of alcohol includes the regulations surrounding the sale of alcohol; including days of sale and trading hours, restrictions on locations and numbers of alcohol outlets, legal availability or age limits on buying, selling and consuming alcohol. Beverage distribution systems are included as are the range, types and strengths of beverages sold (Babor et al., 2010; Measham & Brain, 2005; Pacific Institute for Research and Evaluation (PIRE), no date; Stockwell & Gruenewald, 2004). Increases in the physical availability of alcohol leads to greater ease or convenience in obtaining alcohol. It may also stimulate demand. Supply influences demand just as demand influences supply (Edwards & Holder, 2000).
sources, for example friends, parents and others (Pacific Institute for Research and Evaluation (PIRE), no date).
Alcohol Promotion: aims to increase the demand for alcohol through the advertising and promotion of alcohol. The purpose is to increase the attractiveness of drinking, recruit new users and retain current users (Pacific Institute for Research and Evaluation (PIRE), no date).
Related to the promotion of alcohol are new marketing approaches. More recently this has included the development of new products including ready to drinks. These beverages are aimed at a new generation of young alcohol consumers and compete in the market as they are pleasant tasting and already pre-mixed (more convenient compared to spirits) and often have higher alcohol content than beer (Brain et al., 2000; Casswell, 2004).
Individual factors: such as age and gender can affect the distributions of drinking patterns (quantity per occasion and frequency) (Babor et al., 2003).
Objective
The overarching objective and the specific aims of the studies carried out for this thesis were developed to address the lack of policy relevant research among young people in New Zealand.
The specific aims of the studies were:
1) To assess trends in drinking patterns and alcohol-related problems among age and gender groups in the context of a liberalised alcohol policy environment 1990- 2000.
2) To examine trends in drinking patterns over three national general population samples in New Zealand from 1995 to 2004.
3) To assess alcohol-related harms and offences from 1990 to 2003, a period of alcohol policy liberalisation, that included the lowering of the purchase age from 20 to 18 years in 1999.
4) To report patterns of use of ready to drinks and to assess if ready to drink consumers have heavier drinking patterns.
5) To examine the relationship between physical, socio-economic and social environments and alcohol consumption and drunkenness among a general
Data sources utilised in the studies
Several sources of data were utilised in this research and are described below:
Study One utilised the Auckland Annual Alcohol Surveys 1990 -2000. These surveys were developed and implemented by researchers at the Alcohol and Public Health Research Unit (APHRU), University of Auckland. The surveys were funded by the Health Research Council of New Zealand (HRC) and the Alcohol Advisory Council of New Zealand (ALAC). These data were provided to the candidate for secondary analysis.
Study Two utilised the National New Zealand Alcohol Surveys 1995 & 2000 and the 2004 Health Behaviours Survey (Alcohol Use). The 1995 & 2000 surveys were developed and implemented by researchers at the Alcohol and Public Health Research Unit (APHRU), University of Auckland. They were funded by the HRC and ALAC. The 2004 survey was implemented by researchers at the Centre for Social & Health Outcomes Research and Evaluation (SHORE), Massey University. This survey was funded by Public Health Intelligence (PHI). For the 2004 survey the candidate worked on the design of the questionnaire with Professor Casswell, data preparation and documentation. These data were provided to the candidate for secondary analysis.
Studies Three and Five utilised data, obtained by the candidate, from the New Zealand Transport Agency, New Zealand Police, Ministry of Justice (Study Three) and the Liquor Licensing Authority (Study Five).
Study Five utilised data from the Alcogenic Environments Study 2005. This study was developed and implemented by researchers at SHORE, Massey University (funded by HRC). The candidate undertook questionnaire design with Professor Casswell and collected the data for the project. A telephone survey was undertaken and the candidate worked on sampling, running the survey software and data quality assurance. Two pseudo-patron purchase surveys were conducted for on and off-licensed outlets and the candidate managed the data collection for these surveys. The candidate also contributed to the design of the alcohol outlet density measure used in this research (Study Five). It was the candidate’s idea to include survey measures to capture respondent reports of access to alcohol and then to use these measures to calculate alcohol outlet density.
Thesis structure
This thesis is comprised of five published studies that work together to form a thesis contributing to understanding about alcohol-related behaviour among young people in the context of liberalising policy changes. Each study addresses one of the specific aims outlined previously and studies are presented as separate chapters in the same order as the aims (One through Five).
The structure means that relevant literature is included in the introduction to each chapter, providing the context for the arguments that follow. Only studies published at that time are included in the literature reviews. Some paragraphs are similar throughout the thesis due to the format of the thesis (5 related papers). The links serve to connect the chapters.
Link
Study One: Increases in typical quantities consumed and
alcohol-related problems during a decade of liberalising alcohol policy
Huckle, T., Pledger, M & Casswell, S. Increases in typical quantities consumed and alcohol-related problems during a decade of liberalising alcohol policy, Journal of Studies on
Alcohol and Drugs (2011).b
Objective: To assess trends in drinking patterns and alcohol-related problems among age and gender groups in the context of a liberalised alcohol policy environment.
Method: Eleven comparable general population alcohol surveys were conducted in Auckland, New Zealand between 1990 and 2000; a time in which a substantial number of liberalising alcohol policy changes occurred. Measurements included: typical occasion quantity and frequency of drinking in the last 12 months. Self-reported alcohol-related problems in the last 12 months were divided into two groups based on risk curve analysis: threshold problems (experienced only once a high level of consumption is reached such as ‘had hands shake in the morning’) and non-threshold problems (those exhibiting a dose-response relationship). Age groups were 14-19, 20-24, 25-39 and 40-65 years.
Results: Significant increases in typical occasion quantity were found for males and females aged 14-19 years and for females 20-24 and 40-65 years. The increase was most marked among those 14-19 years. Only females aged 25-39 years increased how often they drank. The prevalence of threshold problems significantly increased among male
drinkers aged 14-19 and 40-65 years. The proportion of 14-19 year old males experiencing threshold problems was observed to be higher in each year compared to males 40-65 years and the 14-19 year olds experienced a greater year on year increase. Increases in non-threshold alcohol-related problems occurred for the youngest and oldest males and for most female age groups (14-19, 25-39 and 40-65 years). The increase was most marked among females 14-19 years.
Introduction
Research suggests that liberalising alcohol policies, such as those experienced in New Zealand will generally increase alcohol consumption (Babor et al., 2010). The introduction of alcohol into grocery outlets has been shown to increase consumption both at the population level and among specific population groups (Valli, 1998; Wagenaar & Langley, 1995; Zhang & Casswell, 1999). The lowering of the minimum purchase age is associated with increases in consumption among young people (Wagenaar & Toomey, 2002) and longitudinal analysis has linked increased alcohol advertising, due to policy liberalisation, to increases in consumption among young people (Casswell & Zhang, 1998).
Liberal policy changes are also associated with increases in alcohol-related harms (Bloomfield, Rossow, & Norström, 2009; Chikritzhs & Stockwell, 2002, 2006; Chikritzhs & Stockwell, 2007; Herttua, Makela, & Martikainen, 2008, 2009; Smith, 1986) . Most studies have used routinely collected measures to assess specific policy changes such as price. There have been few studies using general population survey data to assess self-reported harms when liberal alcohol policy changes have occurred. Recent exceptions include Bloomfield et al. (2010) and Gustafsson (2010). Bloomfield et al. (2010) assessed self-reported problems in Denmark, South Sweden and Finland following the liberalising of travellers allowances and tax reductions and found that self-reported alcohol problems did not increase following the policy changes (Gustafsson found similar results).
of liberalising alcohol policy change has occurred. One example from Sweden used surveys of young people from 1971-1999. This research linked liberal alcohol periods characterised by increases in outlet numbers and the introduction of alcopops and cider into restaurants/retail stores to increasing consumption (Andersson, Hansagi, Thakker, & Hibell, 2002). A New Zealand study, comparing two national data points between 1995 and 2000, found that, in the context of several liberalising policy changes increases in quantities consumed occurred among most age groups (particularly young people) (Huckle, You, & Casswell, 2011).
Alcohol consumption and related harm are significant public health issues in New Zealand. In 2002, estimates using the global burden of disease (GBoDI) methodology estimated alcohol to contribute 5.7% of disability adjusted years of life lost (DALYs), close to the global average (Connor et al., 2005). Weekend heavy drinking is common place and this is similar to many other established market economies including the UK, some Nordic countries and Australia. In New Zealand drinkers intentionally drink to become intoxicated and this behaviour is widely viewed as socially acceptable (McEwan et al., 2010).
10,000 people by 2006 and a similar pattern occurred in Auckland (Data obtained from the Liquor Licensing Authority). Some of this increase was due to supermarkets and grocery outlets becoming alcohol outlets but there was also a substantial increase in on premise drinking opportunities, mainly in bars and nightclubs frequented by younger people.
In 1992 brand advertising of alcohol, mainly aimed at young people, was permitted in the broadcast media with very little in the way of regulation or restriction (Alcohol & Public Health Research Unit, 1998). Prior to 1992, alcohol advertising was very limited. Following this policy change there was a fourfold increase in televised alcohol advertising seen by young people (Wyllie et al., 1996) and alcohol advertising became widespread very quickly and became part of young people’s everyday social lives (Casswell, 2004).
A relaxation to customs policy led to the introduction of ready to drinks (RTD’s) in 1995 (more widely known as alcopops). These beverages were popular among young people, in particular young females (Huckle, Sweetsur, Moyes, & Casswell, 2008b). Approximately 2 million litres, by volume, were available for consumption in 1995 and in 2000 this amount had increased to around 24.5 million litres, the largest increase compared to any other beverage at that time (Statistics New Zealand, 2001). However the volume of ready to drinks consumed still remained considerably lower than beer and wine at the national level (Statistics New Zealand, 2004a).
increases in alcohol-related harms including traffic crashes and injuries among young people following the lowering of the minimum purchase age in New Zealand (Everitt & Jones, 2002; Guria et al., 2003; Huckle et al., 2006; Kypri, Voas, Langley, Stephenson, Begg, Tippets et al., 2006). However the effects of the introduction of beer for sale in grocery outlets and Sunday trading have not yet been evaluated.
Although most of the policy changes that occurred during the 1990’s were liberalising there were some restrictions introduced. The earliest of these, in 1989, was a policy linking alcohol taxation to inflation so as to maintain the real price (Zhang & Casswell, 1999); a policy that very few Western countries have in place (Babor et al., 2010). The real price of wine did decrease however during the 1990’s (Wagenaar & Langley, 1995; Zhang & Casswell, 1999).
The most restrictive policy change was the introduction of Compulsory Random Breath Testing (CBT) in 1993. At the same time the legal limit for drivers under 20 years was reduced, (Land Transport Safety Authority, 2004) and a substantial enforcement and advertising effort occurred from late 1995 (Guria et al., 2003; Lash, 2005). CBT decreased alcohol-involved traffic crashes by 10% between 1993 and 2000 (Land Transport Safety Authority, 2001).
It was hypothesised that: (i) greater increases in young people’s consumption and problems would occur (including among young women) as all policy changes were relevant to young people; and (ii) some increases in consumption and problems among older age groups but to a lesser extent as not all policy changes were directly relevant to the older age groups.
Method
Data Collection
The surveys document drinking behaviour in the Auckland region (an urban drinking environment). The surveys began in 1990 and the first policy changes, relating to licensing (beginning in April 1990), were implemented gradually as individual applications went through the licensing process and it was not until 1991 that supermarkets & grocery outlets had any substantial market share of wine sales (Wagenaar & Langley, 1995). The survey data in 1990 may therefore be viewed as a baseline.
Sampling Methods
Around one third of New Zealand’s population lives in Auckland (over a million people). It includes a slightly different population mix to the rest of New Zealand and immigration saw increases, in particular, among Asian peoples from 5.1% of the population in 1991 to 13.1% in 2001 (Auckland Regional Council, 2007) over the time of the surveys.
Within the Auckland region random digit dialling was used to select the household. This had the advantage of including households with unpublished phone numbers. A further random selection was then made to determine which individuals in the household would be interviewed. Respondents were independently and randomly selected by the computer based on the number of eligible individuals living in the household.
People without landline telephones were excluded from the sample. Landline telephone coverage in New Zealand was high – 93.5% to 96.0% between 1990 and 2001. Certain groups are under-represented amongst those with access to a landline telephone however this did not affect population level estimates (Wyllie, Black, Zhang, & Casswell, 1994). Cell phone usage was not widespread among the residential population over the time span of the surveys (Pers comm. Telecom).
Measures
Typical occasion quantity and frequency of drinking: Drinkers in the past 12 months were asked how often they drank and how much they would drink on a typical occasion at a number of mutually exclusive specified locations, plus any additional locations, they had had a drink. For further description see Casswell et al. (2002). This approach to collecting consumption data in general population interviews has been found to give a very good approximation to the alcohol available for consumption (Casswell et al., 2002). In the 2000 survey two new locations were added which accounted for a very small amount of increase in volume (Habgood et al., 2001).
Respondents reported the quantities of alcohol they consumed in their own terms and these were coded by interviewers using the wide range of containers commonly used to serve and sell alcoholic beverages in New Zealand. Numerous container coding options were available specific to different beverage types (Casswell et al., 2002). Beverage conversions were based on container sizes and standard alcohol content beverages as documented by Statistics New Zealand.
Alcohol-related problems were grouped as
1) Threshold problems, which were those that occurred only once a higher level of alcohol had been consumed: 20+ litres of pure alcohol per annum (as perWyllie et al., 2000) (a threshold effect). These were: ‘stayed intoxicated for several days’, ‘had hands shake a lot in the morning after drinking’ and ‘taken an alcoholic drink first thing in the morning’.
2) Non-threshold alcohol-related problems were those that showed a more linear relationship (dose-response) with volume of alcohol consumed. These were: ‘told to leave a place because of drinking’, ‘physical fight because of drinking’, ‘away from work because of drinking’, ‘involved in a serious argument after drinking’, ‘got drunk when there was an important reason to stay sober’, ‘awakened the next day unable to remember things done while drinking’, ‘felt ashamed of something done while drinking’, ‘felt the effect of alcohol after drinking the night before’ and ‘felt the effects of alcohol while at work/study/household duties’.
Ethnicity: Respondents could report more than one ethnicity. These were prioritised for analysis as per Census New Zealand (Statistics New Zealand, 2009b).
Analysis
drinkers. Often the way to accommodate this is to investigate the trend on the log scale but this has the consequence that the trend is non-linear on the original scale. Therefore quantile regression was used to investigate median typical occasion quantity and median yearly frequency of drinking.
For threshold problems and non-threshold problems, where the responses are binary, the typical method of analysis is to use logistic regression. However, this means that the trend isn’t linear on the probability scale but on the logistic scale. For this case, we analysed the data using least squares regression but used bootstrapping to derive the errors. Bootstrapping involves taking multiple samples from the observed data. With a large enough sample, the sample looks like the distribution it is sampled from.
For each response of interest two models were fitted. The first had time as the sole explanatory variable and the second model had time as the explanatory variable with ethnicity as a confounder. Models were run for males and females separately.
Results
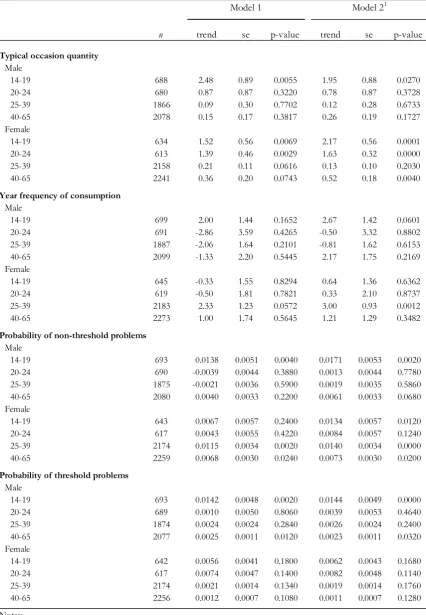
Table 1.1: Model specifications
n trend se p-value trend se p-value
Typical occasion quantity Male
14-19 688 2.48 0.89 0.0055 1.95 0.88 0.0270
20-24 680 0.87 0.87 0.3220 0.78 0.87 0.3728
25-39 1866 0.09 0.30 0.7702 0.12 0.28 0.6733
40-65 2078 0.15 0.17 0.3817 0.26 0.19 0.1727
Female
14-19 634 1.52 0.56 0.0069 2.17 0.56 0.0001
20-24 613 1.39 0.46 0.0029 1.63 0.32 0.0000
25-39 2158 0.21 0.11 0.0616 0.13 0.10 0.2030
40-65 2241 0.36 0.20 0.0743 0.52 0.18 0.0040
Year frequency of consumption Male
14-19 699 2.00 1.44 0.1652 2.67 1.42 0.0601
20-24 691 -2.86 3.59 0.4265 -0.50 3.32 0.8802
25-39 1887 -2.06 1.64 0.2101 -0.81 1.62 0.6153
40-65 2099 -1.33 2.20 0.5445 2.17 1.75 0.2169
Female
14-19 645 -0.33 1.55 0.8294 0.64 1.36 0.6362
20-24 619 -0.50 1.81 0.7821 0.33 2.10 0.8737
25-39 2183 2.33 1.23 0.0572 3.00 0.93 0.0012
40-65 2273 1.00 1.74 0.5645 1.21 1.29 0.3482
Probability of non-threshold problems Male
14-19 693 0.0138 0.0051 0.0040 0.0171 0.0053 0.0020 20-24 690 -0.0039 0.0044 0.3880 0.0013 0.0044 0.7780 25-39 1875 -0.0021 0.0036 0.5900 0.0019 0.0035 0.5860 40-65 2080 0.0040 0.0033 0.2200 0.0061 0.0033 0.0680 Female
14-19 643 0.0067 0.0057 0.2400 0.0134 0.0057 0.0120 20-24 617 0.0043 0.0055 0.4220 0.0084 0.0057 0.1240 25-39 2174 0.0115 0.0034 0.0020 0.0140 0.0034 0.0000 40-65 2259 0.0068 0.0030 0.0240 0.0073 0.0030 0.0200 Probability of threshold problems
Male
14-19 693 0.0142 0.0048 0.0020 0.0144 0.0049 0.0000 20-24 689 0.0010 0.0050 0.8060 0.0039 0.0053 0.4640 25-39 1874 0.0024 0.0024 0.2840 0.0026 0.0024 0.2400 40-65 2077 0.0025 0.0011 0.0120 0.0023 0.0011 0.0320 Female
14-19 642 0.0056 0.0041 0.1800 0.0062 0.0043 0.1680 20-24 617 0.0074 0.0047 0.1400 0.0082 0.0048 0.1140 25-39 2174 0.0021 0.0014 0.1340 0.0019 0.0014 0.1760 40-65 2256 0.0012 0.0007 0.1080 0.0011 0.0007 0.1280 Notes:
1: Adjusted for ethnicity
Drinking measures
[image:49.595.94.443.281.650.2]Significant increases in typical occasion quantity were found for males aged 14-19 and females aged 14-19, 20-24 and 40-65 years (Table 1.1). The increase was greatest among males and females 14-19 years (Figure 1.1). The only significant change in frequency of drinking was among females 25-39 years who increased (see Table 1.1). (Figure not provided as only one significant change occurred).
Figure 1.1: Typical occasion quantity
A – Licensing system relaxed & wine introduced into supermarkets and grocery outlets B – Alcohol advertising permitted in the broadcast media
C – Compulsory Breath Testing introduced and lower legal limits for drivers under 20 years D – Ready to drinks introduced
E – The minimum purchase age lowered from 20 to 18 years; Sunday trading and beer introduced into supermarkets and grocery outlets
Year T y pi c a l Oc c a s ion Quant it y , m l ab s o lu te al c ohol
1990 1992 1994 1996 1998 2000
02 0 4 0 6 0 8 0 14-19, Males 14-19, Females
a b c d e
Year T y pi c a l Oc c a s ion Quant it y , m l ab s o lu te al c ohol
1990 1992 1994 1996 1998 2000
02 0 4 0 6 0 8 0 20-24, Males 20-24, Females
a b c d e
Year
1990 1992 1994 1996 1998 2000
02 0 4 0 6 0 8 0 T y pi c a l O c c a s ion Quan ti ty , m l abs ol ut e al c o hol 25-39, Males 25-39, Females
a b c d e
Year
1990 1992 1994 1996 1998 2000
02 0 4 0 6 0 8 0 T y pi c a l O c c a s ion Quan ti ty , m l abs ol ut e al c o hol
a b c d e
Alcohol-related problems
Significant increases in threshold problems were found for males aged 14-19 and 40-65 years (Table 1.1). The proportions of 14-19 year old males experiencing these problems was observed to be higher in each year compared to the 40-65 year group (Figure 1.2) and the increase over time was more marked in the youngest age group (Table 1.1). No significant changes were found among females of any age (Table 1.1).
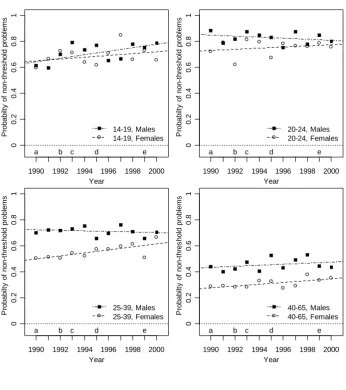
The only significant change among males with regard to non-threshold problems was among those 19 years, who significantly increased. However among females those 14-19, 25-39 and 40-65 experienced significant increases with the increase more marked among the 14-19 year age group (Table 1.1 & Figure 1.3).
Figure 1.2: Threshold problems
Year P ro bab ilt y of t h re s h ol d prob le m s
1990 1992 1994 1996 1998 2000
0 0 .1 0 .2 0 .3 0 .4
a b c d e
14-19, Males 14-19, Females Year P ro bab ilt y of t h re s h ol d prob le m s
1990 1992 1994 1996 1998 2000
0 0 .1 0 .2 0 .3 0 .4
a b c d e
20-24, Males 20-24, Females Year P rob abi lt y of t h re s h o ld pr o b le m s
1990 1992 1994 1996 1998 2000
0 0 .1 0 .2 0 .3 0 .4
a b c d e
25-39, Males 25-39, Females Year P rob abi lt y of t h re s h o ld pr o b le m s
1990 1992 1994 1996 1998 2000
0 0 .1 0 .2 0 .3 0 .4
a b c d e
Figure 1.3: Non-threshold problems
Discussion
A key finding was that the youngest age group, the 14-19 year olds, experienced marked increases in typical occasion quantity and alcohol-related problems including, for males, relatively serious problems (such as had hands shake in the morning or took a drink first thing in the morning). The public health significance of this result lies in the current evidence suggesting that heavier alcohol consumption can impair brain development in the teenage years and contribute to the experience of injury among young people resulting in years of life lost (Connor et al., 2005; Hart, 2007).
Year P roba bi lt y of non-th re s h ol d pr obl e m s
1990 1992 1994 1996 1998 2000
00 .2 0 .4 0 .6 0 .8 1
a b c d e
14-19, Males 14-19, Females Year P roba bi lt y of non-th re s h ol d pr obl e m s
1990 1992 1994 1996 1998 2000
00 .2 0 .4 0 .6 0 .8 1
a b c d e
20-24, Males 20-24, Females Year P robabi lt y of n on-th re s hol d pr obl e m s
1990 1992 1994 1996 1998 2000
0 0 .2 0 .4 0 .6 0 .8 1
a b c d e
25-39, Males 25-39, Females Year P robabi lt y of n on-th re s hol d pr obl e m s
1990 1992 1994 1996 1998 2000
0 0 .2 0 .4 0 .6 0 .8 1
a b c d e
Assessing the local context we find that young people were subject to many policy changes. Alcohol outlet density more than doubled in Auckland and outlets such as bars and nightclubs, with extended trading hours, proliferated. By 1995 around a third of 16-17 year olds and three quarters of 18-19 year olds had consumed alcohol at bars in the last 12 months (Habgood et al., 2001). In Auckland, higher outlet density (including on-licensed premises) has previously been associated with higher quantities of alcohol consumed among teenagers (Huckle, Huakau, Sweetsur, Huisman, & Casswell, 2008a).
Other policy changes were directly relevant to young people including the introduction of alcohol marketing in the broadcast media in 1992. A New Zealand longitudinal study has linked this new advertising to increased consumption among young people (Casswell & Zhang, 1998). RTD’s (alcopops) were introduced in 1995 and have been found to be associated with heavier drinking among teenagers in New Zealand (Huckle et al., 2008b). The MPA was also lowered in 1999 which meant that some school children could now buy alcohol. Previous New Zealand studies have found increases in harms among younger people following this policy change (Everitt & Jones, 2002; Guria et al., 2003; Huckle et al., 2006; Kypri et al., 2006).
countries such as Denmark and the UK (Hibell, Andersson, Ahlstrom, Balakireva, Bjarnason, Kokkevi et al., 2000). In Australia, where licensing liberalisations have occurred, the proportion of risky drinkers (among drinkers) has significantly increased from the mid-eighties to 2005 (White & Hayman 2006).
In this study we found increases in quantities consumed and problems among young females (14-19 and 20-24 years). Young females were subject to many of the same policy changes as young males and some policy changes were particularly relevant to women including the introduction of RTD’s (Huckle et al., 2008b). More young females are now delaying child bearing, working in non-traditional occupations and have more disposable income. Some studies have suggested that women’s changing roles in society may have led to gender convergence in drinking (Bloomfield, Gmel, Neve, & Mustonen, 2001; McPherson, Casswell, & Pledger, 2004; Wilsnack, Vogeltanz, Wilsnack, & Harris, 2000). While there is some evidence to support the notion of a gender gap decrease as a driver of drinking this idea has been challenged more recently by Measham and Ostergaard (2009). Measham and Ostergaard (2009) attributed young women’s increasing consumption from Denmark and the UK during the 1990’s to the expansion in the night time economy (including low cost of alcohol), economic regeneration, national deregulation of licensing and developments in the international alcohol industry.
For older males we expected some increases in consumption and problems but to a lesser extent than younger people. Apart from males aged 14-19 years no other age groups increased their quantity or frequency of consumption. The oldest male age group (40-65 years) did experience a significant increase in threshold problems, however this was not a large increase comparatively speaking.
While we have included important contextual information on the policy changes that have occurred in the alcohol environment over the time of the study, this study design cannot determine whether these changes were responsible for the increases in consumption. Data are self-reported. Alcohol surveys are known to underestimate consumption. However the surveys reported here have been found to provide good coverage (Casswell & Bhatta, 2001). Some survey years had lower response rates than others but none below 60% (and response rates did not diminish systematically over time).
Conclusion
Link
Study Two: Increases in quantities consumed in drinking occasions in
New Zealand 1995–2004
Huckle, T., You, R and Casswell, S. Increases in quantities consumed between 1995 and 2000 in New Zealand. Drug and Alcohol Review,30, 4: 366-371 (2011).
Introduction and Aims Significant changes have occurred in the alcohol environment in New Zealand recently and there has been debate about how trends in alcohol consumption may currently look. This paper reports trends in drinking over three general population samples in New Zealand.
Design and Methods Three nationally representative comparable surveys were analysed for trends in: prevalence of drinking, typical occasion quantity, annual frequency and heavier drinking (5+ drinks). Analyses assessed the mean difference of the measures at each year point. Adjustments for multiple comparisons were made. Analysis was undertaken for age and separately for gender
Introduction
Alcohol consumption and related harm are significant public health issues. Recent estimates of alcohol’s contribution to the Global Burden of Disease (GBD) are of a 5.3% contribution to premature mortality and of 4.6% to disability adjusted years of life lost (DALYs). In New Zealand, 2002 estimates using the GBoDI methodology estimated alcohol to contribute 5.7% of DALYs, close to the global average (Connor et al., 2005).
Undertaking alcohol surveys among populations is necessary to document drinking patterns for a number of reasons: (i) the distributions of frequency of drinking and quantity per occasion can determine the levels and dispersion of acute and chronic harm within a population (Babor et al., 2003) (ii) knowledge of drinking patterns are necessary to inform policies and (iii) they are essential for estimating proportions of deaths and hospital episodes caused using the Aetiologic Fraction method (World Health Organization, 2000).
New Zealand is an established market economy in which alcohol use is widespread. Changes in the alcohol environment have occurred more recently and there has been debate about how trends in alcohol consumption may currently look. Changes have included the introduction of spirits based mixed drinks Ready to Drinks (RTD’s) or alcopops in 1995, the minimum purchase age was lowered from 20 to 18 years in December 1999, Sunday trading was permitted and the introduction of beer for sale in supermarkets and grocery outlets also occurred. In the restrictive direction a tax was introduced in 2003 to make a type of spirits more expensive (called light spirits 23% abv.).(Easton, 2005; Habgood et al., 2001).
To the best of our knowledge there have been no publications of trends in drinking patterns among the New Zealand population. The aim of this paper therefore is to report trends in key drinking measures for the general population over three nationally representative comparable household surveys in 1995, 2000 and 2004.
Methods
As some of the months of data collection in the third survey differed from the previous two effects of seasonality were checked. Two measures, typical occasion quantity and frequency, were analysed for each month in the 2004 survey and no significant effect caused by the month of interview was found (using a 12 month reference period for data collection may have helped to minimise effects of seasonality).
Contact and interviewing were undertaken using an in-house Computer Assisted Telephone Interviewing (CATI) system. Extensively trained interviewers coded respondents’ answers directly into the computer. A high level of quality control, essential for the collection of comparative data, was achieved using this CATI system (for further description see Casswell et al., 2002) (included in Appendix 3).
Telephone coverage in New Zealand was high in 1995 (96%), 2000 (97%) and 2004 (93%) compared to international figures however certain sectors of the population are under-represented among telephone surveys (Statistics New Zealand, 2004b; Wyllie et al., 1994).
Since the number of persons randomly selected per household was proportional to household size the survey was self-weighting with respect to household size. In 2000 and 2004 the oversamples of 12-19 year olds were weighted to match the corresponding population estimates obtained from Statistics New Zealand (Statistics New Zealand, 2002).
Response rates were: 76% in 1995, 73% in 2000 and 59% in 2004.
Measures
Measures were identical in each of the three surveys. Respondents who had consumed alcohol in the past 12 months reported at which of a number of mutually exclusive locations, plus any additional locations, they had had a drink. For each place respondents drank at they were asked how often they drank there and how much they would drink on a typical occasion at that location. Two new places were added to the survey interview schedule in 2000; these were Marae and Special events. Prevalence of alcohol use was collected in a separate question. Further information on the locations asked about in the survey or how the alcohol consumption measures were collected can be found in Casswell et al. (2002).
There were several measures derived from the interview questions; all measures used a 12 month reference period. Prevalence of drinking was those who had consumed alcohol in the last 12 months; typical occasion quantity was the weighted average of all the typical occasion quantities reported by a respondent at each location, taking into account how often the respondent drank at the location. Annual frequency was the sum of all frequencies at all of the locations.
Analysis
GLM (general linear model) and Student-t statistic was used to assess the (least squared) mean difference of the respondent variables at each year point. The Tukey-Kramer method was used for multiple comparison adjustments between years.Variables included for analysis were prevalence of drinking in the last 12 months, annual frequency, typical occasion quantity and heavier drinking (5+ drinks on a typical occasion). Analyses were conducted on the age groups 14-15, 16-17, 18-19, 20-24, 25-29, 30-39, 40-49, and 50-65 years. These age groups were chosen to reflect different developmental stages over the life course. Analysis was done for males and females separately to reflect the different drinking patterns between the genders.
To ensure that the introduction of two new locations to the survey interview in 2000 had not inflated the alcohol consumption estimates in 2000 & 2004 analyses were run including and excluding the new locations. This made no significant difference to results.
Typical occasion quantity and frequency responses were continuous and skewed so these variables were logarithmically transformed to reduce the influence of more extreme values. Significant differences are reported at the 5% level.
Results
T