Rochester Institute of Technology
RIT Scholar Works
Theses Thesis/Dissertation Collections
4-2016
Sustainable Management of Food Supply-Chain
Resources in New York State
Jacqueline H. Ebner
jhe5003@rit.edu
Follow this and additional works at:http://scholarworks.rit.edu/theses
This Dissertation is brought to you for free and open access by the Thesis/Dissertation Collections at RIT Scholar Works. It has been accepted for inclusion in Theses by an authorized administrator of RIT Scholar Works. For more information, please contactritscholarworks@rit.edu. Recommended Citation
SUSTAINABLE MANAGEMENT OF FOOD
SUPPLY-CHAIN RESOURCES IN NEW YORK STATE
By
Jacqueline H. Ebner
A Dissertation
Submitted in Partial Fulfillment of the Requirements for the Degree of
Doctor of Philosophy In
Sustainability
Department of Sustainability Golisano Institute for Sustainability
Rochester Institute of Technology
April 2016
Author: ________________________________________________________________ Sustainability Program
Certified by: _____________________________________________________________ Dr. Thomas A. Trabold Associate Professor and Department Head, Sustainability Program
Notice
Funding provided by the New York State Pollution Prevention Institute through a grant
from the New York State Department of Environmental Conservation.
Any opinions, results, findings and/or interpretations of data contained herein are the
responsibility of author(s) and do not necessarily represent the opinions, interpretations or
policy of the State.
© 2016
Sustainable Management of Food Supply
Chain Resources in New York State
by
Jacqueline H. Ebner
Submitted by Jacqueline H. Ebner in partial fulfillment of the requirements for the degree of Doctor of Philosophy in Sustainability and accepted on behalf of the Rochester Institute of Technology by the dissertation committee.
We, the undersigned members of the Faculty of the Rochester Institute of Technology, certify that we have advised and/or supervised the candidate on the work described in this dissertation. We further certify that we have reviewed the dissertation manuscript and approve it in partial fulfillment of the requirements of the degree of Doctor of Philosophy in Sustainability.
Approved by:
Dr. Jeffrey S. Lodge
(Outside Examiner and Chair) Date
Dr. Thomas A. Trabold
(Dissertation Advisor)
Dr. Anahita A. Williamson
Dr. Gabrielle Gaustad
Dr. Rodrigo A. Labatut
Acknowledgements
I would like to thank the many who have contributed to this effort. First, I would
like to thank my dissertation committee beginning with my advisor Dr. Thomas Trabold
for his steady and wise guidance throughout my research. I also thank Dr. Anahita
Williamson who was my primary advisor for two years for her encouragement and
support and for providing editorial comments as a member of my dissertation committee.
Finally, I thank my advisor Dr. Gabrielle Gaustad for her council and interest in my
research. I am also grateful to Dr. Rodrigo Labatut of Cornell University for his
willingness to share his knowledge and collaborate with me and from whom I have
learned a great deal. Also, I would like to acknowledge the extended GIS faculty
members Dr. Jeffrey Lodge and Dr. Brian Tomaszewski for their advice and willingness
to share their expertise. Finally, Dr. Fritz Ebner, my husband, who has on occasion been
my advisor, collaborator and proof-reader but most of all whose support and love has
made this all possible. I dedicate this work to him, my children and the friends and
family who have supported me. I also gratefully acknowledge the New York State
Pollution Prevention Institute (NYSP2I) which provided my Graduate Research
Abstract
A sustainable food supply chain (FSC) is at the nexus of several critical global
challenges including hunger, resource scarcity, climate change, poverty, energy security
and economic growth. However, managing FSC resources in a sustainable manner is
complex and data to support this goal is lacking. This dissertation addressed four
knowledge gaps by applying a variety of analytical and experimental tools to the New
York State FSC.
First, a cradle-to-grave analysis of the New York State FSC was conducted.
Resources leaving the FSC from primary production (post-harvest) through to
consumption were defined and characterized. Surveys and literature were used to
estimate FSC resources and factors were provided for several sectors and sub-sectors
including the Educational sector. Material flows through the utilization pathways in New
York State were analyzed. It was estimated that over 3.5 million t/yr of solid resources
were generated. Resource utilization pathways including donation were estimated to treat
approximately 6% of these resources. An additional 22 million m3/yr of low solid
resources primarily from the food processors was also estimated and analyzed.
In the next chapter, climate change impacts of utilization pathways emerging in
the State were analyzed. Two comprehensive lifecycle assessments (LCAs) were
conducted to assess climate change impacts. The first was based upon primary data
collected from the largest on-farm anaerobic digester in the State, which co-digests dairy
manure and industrial food wastes. The results showed a net negative climate change of
37.5 kg CO2e/t influent processed when compared to the reference case. Displacement
food waste disposal options and reduced impacts associated with storage of digestate vs.
undigested manure. Sensitivity analysis showed that using feedstock diverted from high
impact disposal pathways, control of digester emissions, and managing digestate storage
emissions were opportunities to improve climate change benefits. The second LCA was
based upon a small-scale, distributed waste-to-ethanol process. This analysis was based
upon data from an operating pilot plant facility, co-fermenting industrial and retail FSC
resources. The climate change impacts for the processing phase were estimated to be
comparable to those associated commercial ethanol production, however when
considering the avoidance waste disposal for FSC resources used as feedstock, the result
was a net negative impact of 338 kg CO2e/MJ fuel produced.
The following chapter evaluated the potential of several significant New York
State FSC resources as feedstock for biogas production. Twenty-four source-separated,
commercial substrates from the retail and food processing sector were characterized and
tested in bench-scale bio-methane potential (BMP) tests. Substrates were also combined
with dairy manure and other substrates to assess synergistic or antagonistic effects
associated with co-digestion. Key bio-methane kinetic parameters including bio-methane
potential, apparent hydrolysis rate constant and co-digestion indices were reported.
Substrates with high fat content demonstrated higher potential for bio-methane
generation. Substrates rich in readily hydrolysable carbohydrates and fats showed more
complete bio-degradation. Measured bio-methane potential was the product of both of
these factors. Bio-methane production of co-digested substrates was close to that of the
average). However, co-digestion generally resulted in an increase in apparent hydrolysis
rate relative to that predicted by the combination of individual substrates.
Finally, the impact of FSC resource characteristics on greenhouse gas (GHG) emissions related to utilization of those resources analyzed. An open source model (ORCAS) was developed to assess the climate change impacts of several NYS
Table
of
Contents
Acknowledgements...i
Abstract...ii
Abbreviations...xvi
Chapter1 Introduction...1
1.1. Background ... 1
1.2. Dissertation structure ... 4
Chapter2 AnalysisofNewYorkStateFSCresources...5
2.1. Introduction ... 5
2.1.1 Framework and definitions ... 5
2.1.2 History of FSC analysis ... 8
2.2. Methods ... 12
2.2.1 Generation of FSC resources ... 12
2.2.2 FSC resource utilization pathways: ... 27
2.3. Results ... 32
2.3.1 Summary ... 32
2.3.2 MSWFW analysis ... 56
2.3.3 Geographical Information System (GIS) Analysis ... 58
2.3.4 Limitations and future work... 60
2.3.5 Conclusions ... 61
3.1 Lifecycle greenhouse gas analysis of an anaerobic co‐digestion facility
processing dairy manure and industrial food waste ... 66
3.1.1 Introduction ... 66
3.1.2 Methods ... 69
3.1.3 Results and discussion ... 86
3.1.4 Conclusions ... 95
3.2. Life cycle greenhouse gas (GHG) emissions of a novel process for converting food waste to ethanol and co‐products ... 97
3.2.1 Introduction ... 97
3.2.2 Methods ... 100
3.2.3 Results and Discussion ... 110
3.2.4 Conclusions ... 123
3.3. Conclusions ... 123
Chapter4 Evaluationofanaerobicdigestionofcommercialfoodwaste andco‐digestionwithmanure:characterizingbiochemicalparametersand synergisticeffects....125
4.1. Introduction ... 125
4.2. Methods ... 128
4.2.1 Substrate description ... 128
4.2.2 Substrate characterization ... 132
4.2.3 Biochemical methane potential assay ... 133
4.3. Results and Discussion ... 137
4.3.1 Substrate characterization ... 137
4.3.2 BMP test results: ... 138
Chapter5 :Climatechangeimpactsoffoodsupplychainresources
baseduponfeedstockcharacteristics:ApplicationoftheORCASmodeltoNew
YorkState………...151
5.1. Introduction ... 151
5.2. Methods: ... 153
5.2.1 Model development ... 153
5.2.2 Food Supply Chain (FSC) Resources ... 153
5.2.3 Lifecycle framework ... 157
5.2.4 Treatment pathways ... 158
5.3. Results ... 181
5.3.1 Net impact of diversion: ... 184
5.3.2 Simplified regression estimation ... 185
5.3.3 Uncertainty and variability ... 187
5.3.4 Conclusions ... 195
Chapter6 Conclusionsandrecommendationsforfuturework...197
Appendices...204
AppendixA...205
AppendixB...217
AppendixC...240
AppendixD...241
List of Tables
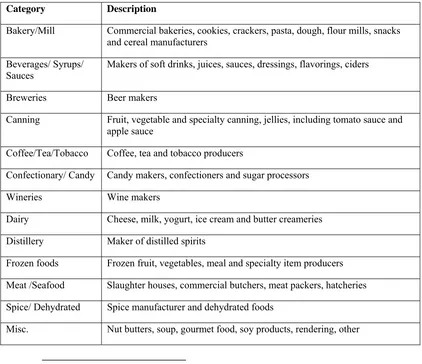
Table 2-1: Food manufacturers and processor categories and descriptions………..14
Table 2-2: Literature review of Supermarket FSC resource generation factors…………18
Table 2-3: Literature review of FSC resource generation in K-12 schools………...20
Table 2-4:FSC resource generation factors for FSC sector and sub-sectors….………...26
Table 2-5: Summary of estimated post-harvest FSC resource generation……….33
Table 2-6: Summary of post harvest FSC resource utilization………..36
Table 2-7: Primary production level FSC resource estimation and comparison to reported
“harvested and not sold”………40
Table 2-8: Number of establishments in the retail sector, estimated FSC resources
generated from total stores and from large generators (>100t/yr)….………45
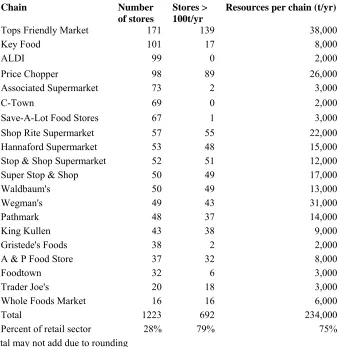
Table 2-9: Top 20 supermarket chains in NY, number of stores, number of large stores
and estimated resources per year for each chain………46
Table 2-10: Estimated utilization of FSC resources (t/yr) from the retail sector………...47
Table 2-11: Number of establishments in the Institutional sector, estimated FSC resources
generated from total institutions, large generators (>100t/yr) and percent of resources
generated by large generators (t/yr)……….. 50
Table 2-12: Number of establishments in the education sub-sector, estimated FSC
resources generated from total educational institutions, large generators (>100t/yr) and
percent of resources generated by large generators (t/yr)……… 50
Table 2-13: Estimated utilization of FSC resources (t/yr) from the Education
Table 2-14: Number of establishments in the health and medical sub-sector, estimated
FSC resources generated from total Health and Medical institutions, large generators
(>100t/yr) and percent of resources generated by large generators (t/yr)………..52
Table 2-15: Estimated utilization of FSC resources (t/yr) from the Health and Medical
sub-sector………...52
Table 2-16: Number of establishments in the correctional sub-sector, estimated FSC
resources generated from total correctional institutions, large generators (>100t/yr) and
percent of resources generated by large generators (t/yr)………. 53
Table 2-17: Estimated utilization of FSC resources (t/yr) from the Correctional
sub-sector………. 53
Table 2-18: Number of establishments in the entertainment sub-sector, estimated FSC
resources generated from total educational institutions, large generators (>100t/yr) and
percent of resources generated by large generators (t/yr)………..54
Table 2-19: Estimated utilization of FSC entertainment, hospitality and restaurant (t/yr)
from the Correctional sub-sector………...55
Table 2-20: Household sector estimated utilization (t/yr)……….56
Table 2-21: MSW FW generated in the retail and consumption stages. Number of
establishments and estimated FSC resources generated………57
Table 3-1: Key system parameters January 2013-December 2013………...73
Table 3-2: Food waste influent composition and alternative disposal pathways
reported………..……77
Table 3-3: Reported dairy processing waste characteristics review………...79
Table 3-5: Summary of food waste delivery logs Jan 2012-Jan 2013………..82
Table 3-6: Published studies of digestate storage methane emissions………….……….84
Table 3-7: Summary of climate change impacts for a unit of waste (kg CO2e/t waste), annually (t CO2e/yr) and normalized by mass of influent processed (kg CO2e/t influent) for the reference and AcoD cases. ………..…….88
Table 3-8: Landfill emissions per t source feedstock………..……….90
Table 3-9: Life cycle data sources and emission factor sources………..106
Table 3-10: Deliveries of food waste feedstock to the pilot. Calculation of t-km travelled ……….107
Table 3-11: Phase 1 pilot process Energy Analysis Summary………...108
Table 3-12: Small Scale Biorefinery Data………...109
Table 3-13: Summary of process inputs, outputs and yields resulting from pilot plant audit and mass balance……….111
Table 3-14: Life Cycle GWPclimate change results (g CO2e/L EtOH) and comparison to corn ethanol and gasoline (gCO2e/MJ)………..………….113
Table 3-15: Contributional analysis of life cycle GWPclimate change impacts (gCO2e/L EtOH)……….………..114
Table 4-1: Description and sources of substrates evaluated………130
Table 4-2: Substrate characterization………...138
Table 4-3: Apparent hydrolysis rate coefficients and standard errors……….145
Table 5-1: Descriptions of Food Supply Chain (FSC) resources………154
Table 5-2: Published characteristics of FSC resources and associated references……..156
Table 5-4: Parameters used to calculate Bu and Cinitial………...164
Table 5-5: Key Parameters used in the landfill treatment pathway………….…..……..164
Table 5-6: Fertilizer requirements relative to N demand for corn in NYS………..169
Table 5-7: Key parameters for the anaerobic digestion treatment pathway, uncertainty range and source………..170
Table 5-8: Key parameters used in compost treatment pathway, uncertainty range and references……….176
Table 5-9: Parameters used in modified TDN calculation……….……..179
Table 5-10: Calculated modified TDN compared to TDN for several FSC resources and sources……….….180
Table 5-11: Key parameters used in the Animal Feed utilization pathway……….181
Table 5-12: Climate change impact (kgCO2e/t) for FSC resources and treatment pathways. Maximum net impact of diversion (kgCO2e/t) and maximum net impact diversion pathway (from- to)………...185
List of Figures
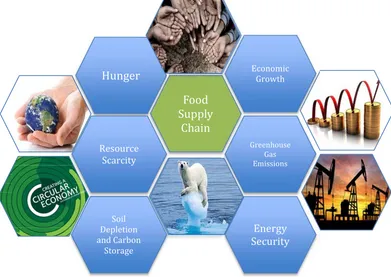
Figure 1-1: The sustainable food supply chain intersects several global challenges including hunger, resource scarcity, climate change, poverty, energy security and
economic growth………2
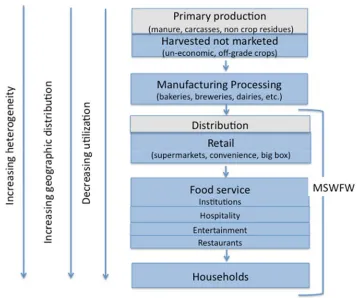
Figure 2-1: Food production occurs along the Food Supply Chain (FSC). FSC resources exit the food supply chain to a utilization pathway (shown in orange). Utilization
pathways recycle resources within the Technosphere or return them to the Ecosphere. Resources are recycled into the Technosphere via the food, bio-economy or another supply chain. Resources recycled to the Ecosphere are again available to the FSC or Bio-Economy supply chains. (Modified from Fusions Definitional Framework (Ostergren et al., 2014))………...7
Figure 2-2: Regression of institution level food waste vs. annual student enrollment for colleges and universities………22
Figure 2-3: Trends observed (indicated by arrows) in resources generated in NYS FSC. Blue rectangles indicate segments included in this analysis. Grey rectangles indicate stages not included in this analysis. Municipal solid waste food waste (MSWFW) includes solid waste generated from the Distribution and Retail, Food Service and
Household sectors………..34
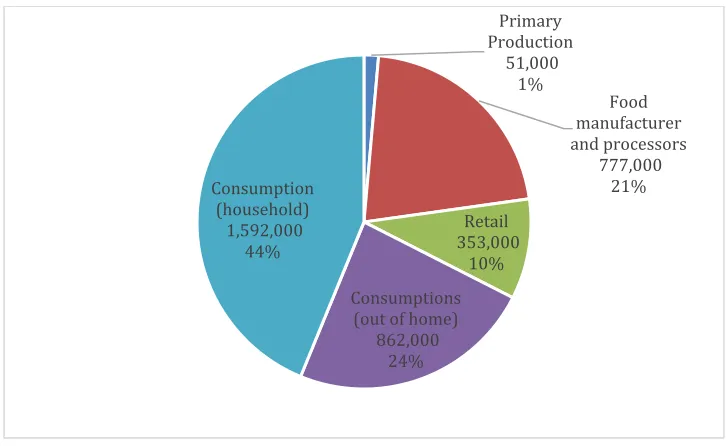
Figure 2-4: Post harvest resources (t/yr) and contribution by stage of FSC (%)……...…35
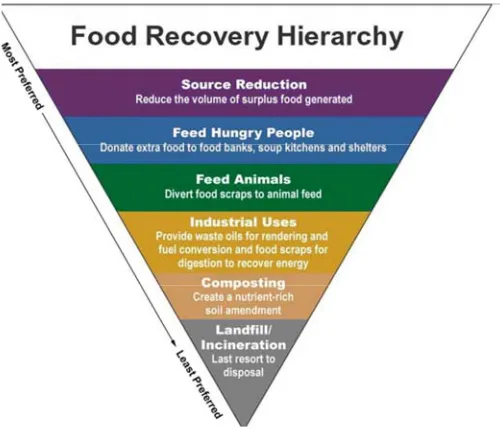
Figure 2-5: The EPA’s Food Recovery Hierarchy prioritizes actions organizations can take to prevent and divert wasted food……….……….41
Figure 2-6: Manufacturer and food processor sector categories, number of establishments (bars) and revenue ($M) (red line)……….42
Figure 2-7 Distribution of FSC resources generated by the retail sector (t/yr) and
contribution to total sector resource generation……….44
Figure 2-8: Estimated FSC resources (t/yr) and composition(%) of the consumption stage………...48
Figure 2-9: Institutional sectors, estimated FSC resources generated (t/yr) and share of total institutional sector resources generated (%)………..49
Figure 2-11: Sankey diagram of MSWFW FSC resources. The left side shows sources of FSC resourcs and the right side shows final treatment of those resources………....57
Figure 2-12: Commercial sector consisting of retail and food service sectors, broken down by type of generator (sub-sector) amount of FSC resources generated (t) and
percent of commercial sector resources (t)………...………….58
Figure 2-13: General Methodology used to develop geographical information
system………....59
Figure 3-1: System boundaries and process flow for the reference and AcoD cases. Boxes represent individual process steps. Dashed boxes indicate a system expansion to include indirect emissions avoided due to displaced processes. Reference case emissions can also be considered an expansion to include avoided processes. Percentages shown in the reference case indicate mass composition of industrial food waste for each pathway. The symbol * indicates a pathway not included in the base scenario analyzed but used in the sensitivity analysis……….71
Figure 3-2: Contribution of greenhouse gases to climate change impacts annually (t CO2e/yr) and based upon mass of influent processed (kg CO2e/t influent) for phases of
the reference and AcoD cases. Top black bars represent net emissions for each case….89
Figure 3-3: Sensitivity analyses Comparison of AcoD, Reference case GHG emissions and net benefit in response to variation and uncertainty in parameters………....92
Figure 3-4: Ethanol production process and system boundaries. Bolded solid lines indicate the bio-refinery system boundary. Dashed bolded border indicates system expansion to net production process. Dashed arrows and processes indicate production processes for displaced co-products and services. Unit processes in gray are modeled based on the literature. Processes without a background are derived from pilot or
commercial data………101
Figure 3-5 Comparison of net biorefinery process life cycle global warming potential impact results (g CO2e/L EtOH). This includes the process itself and does not include avoided waste disposal of feedstock or ethanol distribution. This study is compared to MSW to ethanol studies and corn ethanol.……….……….117
Figure 3-6: Methane production rate (m3 CH4/year). Comparison of methane production (solid lines) and LFG captured (dashed line) for MSW and food scraps over 100 years. Calculated using LandGEM v3.02, based on 1 t of waste. For Food Scraps: k = 0.14, Lo = 301; MSW: k = 0.04, Lo = 100. Phased-in methane collection: Years 1–2: 0%, Year 3: 50%, Year 4: 70%, Years 5–100: 75% (U.S. EPA, 2005;De la Cruz and Barlaz,
Figure 3-7: Sensitivity of results to avoided waste disposal treatment (g CO2e/L EtOH). Four scenarios are compared to the base case and to corn ethanol. The base case
represents the case reported in this study, where all waste feedstock is diverted from the landfill. The four scenarios consist of either landfill or composting of solids and either wastewater treatment or land application of liquid feedstock and are shown in the inserted table. Error bars indicate the range of results due to technology and environmental
conditions. )……..………..……….……… 120
Figure 4-1: Standard bio-methane yield (Bo) for the substrates tested (mL CH4/g VS) shown in red with axis below graph. Methane yield per unit mass (Lo) (m3 CH4/tFW) shown in blue with axis above graph. Substrates were tested in triplicate (n=3) unless otherwise noted. Error bars represent one standard deviation (σ)………..140
Figure 4-2: Comparison of observed bio-methane potential (Bo) to theoretical
bio-methane yield (Bu). Error bars indicate standard deviation of the experimental data and
estimated error of the theoretical calculation of 3% based upon method error estimation. (The ratio of Bo/Bu is the extent of degradation (fd) and is shown as a percentage in Table
C-1 in Appendix C………..144
Figure 4-3: Co-digestion performance index (CPI) of co-digestion substrates. CPI>1 indicates synergistic effect, CP<1 indicates antagonistic effect. Indicates co-digestion with manure indicates food waste co-digestion blends. Error bars indicate standard deviation. ……….…147
Figure 4-4: Co-digestion rate index (CRI) of co-digestion substrates (upper portion of the figure). Hydrolysis rate coefficients of co-digestion substrates (kh) compared to weighted
average of individual substrate hydrolysis rates (kh) (lower portion of figure). Indicates
substrates co-digestion with manure; indicates food waste co-digestion blends. (Standard error associated with estimating hydrolysis rate coefficients could not be used to estimate statistical significance.) ………...148
Figure 5-1: Landfill pathway system diagram.………160
Figure 5-2: System diagram for AD treatment pathway. Dashed lines indicate a system expansion to include displaced processes………165
Figure 5-3: Carbon and Nitrogen balance for the AD process. Dashed lines indicate a system expansion to included mineral fertilizer displacement..………..………167
Figure 5-4: Compost treatment pathway system diagram………...171
Figure 5-5: Mass balance for C and N in composting. Dashed arrows represent potential system expansions to accommodate difference in N losses relative to mineral fertilizer (agricultural) and/or displacement of mineral fertilizer production and upstream
Figure 5-6: Functions, alternative products and displacements for compost ………….173
Figure 5-7: Animal feed treatment pathway system diagram. ………...177
Figure 5-8: Net climate change impact (kgCO2e/t resource). For AD= AD treatment pathway (with baseline fertilizer displacement scenario); AF= Animal feed pathway; CM=compost treatment pathway (with blended displacement scenario); LF= Landfill treatment pathway………....183
Figure 5-9: Range of GHG impacts for the four treatment pathways. Red bar represents nominal, error bars represent the range based upon resources characteristics…………184
Figure 5-10: Net GWP impacts (kgCo2e/t) for each resource and each treatment pathway. Error bars indicate uncertainty ranges obtained by Monte Carlo analysis………..189
Figure 5-11: Compost end use scenarios. CM=no displacement due to end use; CMb=the
baseline blended scenario (21% peat displacement, 18% fertilizer displacement); CMf=compost used in horticulture to displace mineral fertilizer; CMLA=Compost
applied to land to displace mineral fertilizer and provide long term carbon storage; CMp=Compost used in horticulture to displace peat. Error bars indicate uncertainty
ranges resulting from Monte Carlo Analysis. ……….191
Abbreviations
ABV Alcohol by volume (%)
AD Anaerobic digestion
AcoD Anaerobic co-digestion
Bo Bio-methane potential
Bu Theoretical bio-methane potential
BMP Bio-methane potential assay
BOD Biochemical oxygen demand (mg/kg)
BUD Beneficial use determination
C Carbon
CL Crude Lipids (%)
CP Crude Protein (%)
CF Capacity factor
CS Carbon storage
COD Chemical oxygen demand (mg/L)
CO2 Carbon dioxide
CO2e Carbon dioxide equivalents
CH4 Methane
DAF Dissolved air floatation waste
DDGS Dried distillers grains and solubles
EtOH Ethanol
FOIL Freedom of information act
FFS Feed fuel slurry
GHG Greenhouse gasses
GIS Geographic information system
GTW Grease trap waste
HRT Hydraulic retention time
IFW Industrial food waste
K Potassium
kg Kilogram
kWh Kilowatt hour
LFG Landfill gas
m3 Cubic meters
MCF Methane conversion factor
N Nitrogen
NAICS North American Industry Classification System
N2 Nitrogen gas
NO Nitric Oxide
N2O Nitrous oxide
NH3 Ammonia
NYSDEC New York Department of Environmental Conservation
NYS New York State
OLR Organic loading rate (kg VS/ m3-d)
ORL Organic resource locator
ORCAS Organic resource climate impact assessment simulator
P Phosphorous
t Tons (metric tons)
TKN Total Kjeldahl Nitrogen (mg/kg)
TPEY Tons per employee year (short tons)
TS Total solids (%)
TSS Total suspended solids (mg/kg)
SSF Simultaneous saccharification and fermentation
USDA United States Department of Agricultural
VS Volatile solids
ww Wastewater
Chapter 1
Introduction
1.1. Background
A sustainable food supply chain (FSC) is at the nexus of several critical global
challenges (Fig 1-1). The World Resource Report identifies reducing food loss and waste
as one of the solutions to what they term the “great balancing act” of feeding more than 9
billion people by 2050 in a manner that advances social and economic development while
reducing pressure on ecosystems, climate and water resources (Lipinski et al., 2013).
Inefficiencies in the FSC, resulting in losses and waste, reduce food availability and also
consume energy, water and other resources. Precise estimates of resources leaving the
FSC are illusive, however the Food and Agriculture Organization of the United Nations
(FAO) estimates that 32 percent of all food produced in the world is lost or wasted
(Lipinski et al., 2013). Food loss and waste is estimated at 133 billion pounds annually in
the U.S. (Buzby et al., 2014) and both reduces the food supply and consumes energy,
water and other resources. This quantity is based only on edible food mass leading to
human consumption and thus does not include by-products or inedible scrap, or food
grown for feed or bioenergy, which taken as a whole represents a tremendous source of
renewable resources.
Recycling or up-cycling FSC resources can provide nutrients, chemicals, fuels or
other high value products. When converted to bio-fuels, FSC resources contribute to
energy independence and reduce the climate change impacts associated with fossil fuel
included various waste-to-energy (WtE) fuels in the list of qualifying renewables
presented in their Renewable Portfolio Standards (RPS) (U.S. EPA, 2015). Disposal of
FSC resources also often comes with significant economic and environmental costs.
According to the U.S. EPA, the nation spends about $1 billion a year to dispose of food
waste (U.S. EPA/USDA, 2015). Environmental impacts, such as the release of
greenhouse gases (GHG) resulting from treatment of FSC resources and concerns over
land use have resulted in increasing regulation of landfill disposal in parts of Europe and
the U.S. Recycling of food supply waste can return valuable nutrients to the ailing soils.
Thus management of the FSC resources is clearly one of the great sustainability frontiers
[image:25.612.128.519.353.630.2]addressing critical social, economic and environmental goals.
Figure 1-1: The sustainable food supply chain intersects several global challenges
including hunger, resource scarcity, climate change, poverty, energy security and
economic growth.
Food Supply
Chain Hunger
Resource Scarcity
Greenhouse Gas Emissions
Energy Security
Economic Growth
Soil Depletion and Carbon
However, despite its importance, management of FSC resources is difficult and
has historically received little concerted attention resulting in significant knowledge gaps.
The objective of this work is to address some of these gaps through application of a
variety of analytical and experimental tools applied to New York FSC resources.
Food systems are at the core of the New York State economy. Approximately
one-fourth of the State’s land is devoted to agriculture (OSC, 2015). The food processing
industry is estimated to generate over $19 Billion dollars in annual revenues and to
employ over 54,000 (US Census Bureau, 2007). Simultaneous alternative treatments to
landfilling of organic wastes are being actively pursued as a way to mitigate climate
change impacts associated with methane production and to reduce land use conflicts
(Massachusetts, 2013). While alternative utilization pathways are available, several
compelling questions should be answered in order to informed policy to guide this
transition. This work specifically seeks to address the following questions:
1. What FSC resources are generated in New York State and how are they currently
utilized?
2. What are the net greenhouse gas emissions reductions achievable with anaerobic
co-digestion (AcoD) and waste-to-ethanol systems?
3. How can available commercial food waste resources be combined to maximize
bio-methane production in AcoD systems?
4. How do the specific resource characteristics influence our choice of “best”
1.2. Dissertation structure
This work consists of four major research segments each comprising a chapter of
this dissertation as follows:
Chapter 2: Analysis of New York State FSC resources: Includes a framework for
data collection and analysis of available data
Chapter 3: Climate change impacts of emerging food supply chain utilization
pathways: Consists of lifecycle greenhouse gas (GHG) analyses based on primary data
from two NYS facilities
Chapter 4: Evaluation of anaerobic digestion of commercial food waste as:
characterizing biochemical parameters and synergistic effects: Experimental work to
provide a data set related to anaerobic digestion of one of the State’s fastest growing
utilization pathways.
Chapter 5: Comparison of climate change impacts for treatment of specific FSC
resources: Combines the experimental data (Chapter 4) to extends the site based lifecycle
assessments (Chapter 3) to generalized models for assessing FSC resource specific
Chapter 2
Analysis of New York State FSC resources
Management of FSC resources has gained increasing attention globally,
mentioned in 2 of the 17 goals of the UN’s 2030 Agenda for Sustainable Development
(UN News Centre, 2015). Also, in the U.S. the USDA has recently announced of the
first-ever national food waste reduction goal, calling for a 50-percent reduction by 2030
(Tagtow et al., 2015). However, after decades of sporadic effort, data on FSC resources
is scant and tailored to varying objectives (Parfitt et al., 2010). This chapter expands this
body of knowledge by conducting an analysis of the FSC of New York State. The
Introduction provides the framework for analysis, including key terms and definitions
followed by a history of food waste analysis in the literature. The Methods section
discusses the data collection process and the development of FSC resource generation
factors. Three main analyses are described: quantification of FSC resources, geographic
analysis of FSC resources and utilization pathways, and material flow analysis of FSC
resources. Study limitations, gaps and future work are discussed in the Results.
2.1. Introduction
2.1.1 Framework and definitions
Because management of the FSC intersects many different goals (e.g., hunger
elimination, climate change mitigation, economic development, etc.) studies to evaluate
the FSC have had varied approaches and objectives. Therefore a foundational step is to
Technosphere is the “man-made” environment, that which is modified by humans,
for use in human activities. Supply chains are subsystems of the technosphere that
convert natural resources from the ecosphere into products that are used to deliver
services to humans (DeWulf et al., 2016)
Food supply chain (FSC) is defined as the system of interacting processes that
produce food for human consumption. This is sometimes termed the “farm to fork”. In
this analysis, the system is constrained to begin post-harvest (at the farm gate) and to
continue through the steps of processing, distribution/retail and consumption. (Fig 2-1)
Food loss represents the edible amount of post-harvest food that is available for
human consumption but not consumed for any reason. It includes cooking loss and
natural shrinkage (e.g. moisture loss); loss from mold, pests, or inadequate climate
control and food waste (Gustavsson et al., 2011; Kirkendall, 2015)
Food waste is a subset of food loss and occurs when an edible item goes
unconsumed, as in food discarded by retailers due to color or appearance and plate waste
by consumers. Thus food waste occurs only at the retail and consumption stages
(Gustavsson et al., 2011; Kirkendall, 2015)
Food supply chain (FSC) resources are secondary resources which consist of
whole and/or parts of food which enter the FSC and do not pass through the entire food
chain, following the approach proposed by Östergren et al. (2014) and Soethoudt and
Timmermans (2013). Note that food waste and food loss are measured only for products
that are intended for human consumption, and thus exclude parts or products which are
non-edible, while the definition of FSC resources does not.
Utilization pathways receive FSC resources as inputs (either free of charge, as a source of
revenue, or at a cost) and manage the resource until it is either returned to the ecosphere
(soil, water or air) or the technosphere (the FSC or another supply chain or consumer
market).
[image:30.612.108.540.216.478.2]
Figure 2-1: Food production occurs along the Food Supply Chain (FSC). FSC resources
exit the food supply chain to a utilization pathway (shown in orange). Utilization
pathways recycle resources within the Technosphere or return them to the Ecosphere.
Resources are recycled into the Technosphere via the food, bio-economy or another
supply chain. Resources recycled to the Ecosphere are again available to the FSC or
Bio-Economy supply chains. (Modified from Fusions Definitional Framework (Ostergren et
FSC resources are generated at every level of the FSC. They can take the form of
organic matter in high strength wastewater, by-products of production processes, scrap or
non-edible portions and discarded food.
2.1.2 History of FSC analysis
In 1945 when the Food and Agriculture Organization of the United Nations
(FAO) was established, reduction of food loss was part of its mandate (Parfitt et al.,
2010). At the VIIth special session of the United Nations in 1975, then U.S. Secretary of
State Henry Kissinger, realizing the link between FSC management and global hunger,
strongly recommended a resolution to cut post-harvest food loss 50% by 1985.
(Hongladarom, 2015). The resolution was adopted in 1975 and a 1976 report concluded
that lack of information, along with lack of infrastructure and investment, were barriers to
reducing food loss in the supply chain1. While some early progress was made relating to
one or two cereal crops in developing countries, little more was reported on progress
toward this original goal. Within the past decade the call has once again gone out to half
food losses and wastage, this time by 2050 (Lundqvist et al., 2008; Tagtow et al., 2015).
While the problems of poor data quality, complexity in FSCs and different definitions
remain barriers, actions over the past several years signal growing momentum to tackle
the problem.
1 Food and Agriculture Organization (FAO) of the UN, “Launch of the G20 Technical Platform
on the Measurement and Reduction of Food Loss and Waste”, May, 2015,
http://www.fao.org/about/meetings/council/cl153/side-events/technical-platform/en/
At the 2015 United Nations Climate Change Conference, (COP 21 Paris), the
Food and Agricultural Organization (FAO) and the International Food Policy Research
Institute announced the G20 Technical Platform on the Measurement and Reduction of
Food Loss and Waste (FAO, 2015). Although the U.S. lags behind the European Union,
United Kingdom and Denmark, efforts in the U.S. are gaining momentum. National
progress has developed out of efforts to track food supply and national diet and
nutritional patterns. In the mid 1990’s the USDA’s ERS (Economic Resource Service)
expanded the Food Availability Data Series (FADS) to track per capita daily intake. The
loss adjusted food availability (LAFA) series was created by subtracting losses such as
spoilage and plate waste from commodity production, import and export data. Loss
estimation coefficients were taken from published reports or discussions with commodity
experts (most dated in the mid-1970s or earlier). From this effort a report was issued
highlighting the magnitude of losses of edible food at the retail, food service and
consumer levels and seeking solutions to reduce losses through recovery, recycling and
education (Kantor et al., 1997). In 2005 the ERS recognized the need to systematically
update and improve all loss assumptions for each commodity. The years that followed
have seen efforts to improve loss estimates for several commodities and at the primary,
retail and consumer levels. Today, while it is still acknowledged that data quality can be
commodities2. Although this data series cannot be used to estimate FSC resources from
individual generators, it can provide information on the overall composition of these FSC
resources and losses at each level of the FSC.
Efforts at the State level have followed a different path, largely motivated by
waste diversion or renewable energy goals. These efforts have typically included data and
geographic information to assist in development of organics diversion infrastructure.
Unlike the top-down approach at the Federal level, they usually apply a bottoms-up
methodology using waste generation factors rather than loss factors. The waste
generation factors are applied to some representative metric (e.g., numbers of employees,
number of students, etc.) to estimate establishment or sector level FSC resources
generated. The main focus of these studies has been on municipal solid waste (MSW)
and the commercial and residential sectors. However, in several studies, waste
generation factors were poorly documented and when traced back relate to studies
conducted in the 1980s or 1990s (CDEP, 2001; Ma, 2006; MDEP, 2002; NCDENR,
2012). The state of California has conducted several statewide municipal solid waste
(MSW) characterization studies wherein waste volumes were estimated based on waste
audits conducted at several types of establishments throughout the State and
characterization of the audited waste into categories including “food waste”3(Calrecycles,
1999; 2006; 2009; 2014). These studies estimate the quantity of waste generated and in
2 USDA, Loss Adjusted Availability data (LAFA), 2015c,
http://www.ers.usda.gov/data-products/food-availability-(per-capita)-data-system/.aspx#26705
3 The term food waste here does not refer to the definitions used globally or at the national level,
some reports the quantity disposed (via landfill, incineration or wastewater treatment) or
diverted (recycled). Beyond MSW, a Michigan study (Safferman et al., 2007) motivated
by water quality concerns estimated wastewater generated from fruit and vegetable
processing by applying typical data on wastewater volumes and strength (TSS and BOD)
to fruits and vegetables processed in the state. Ma (2006) used FSC resource generation
factors and also surveyed several food processors in New York State in order to estimate
statewide resources available for energy conversion. In 2007, Matteson and Jenkins
(2007) performed a similar and more comprehensive assessment to quantify resources
available for energy conversion in California.
The present research, while building on many of the efforts outlined above, differs
in its broad holistic approach. It is not commodity-based nor restricted to the edible FSC
like the national studies, but uses that data to provide information on composition at
various stages. It expands on the methodologies used in many of the state studies by
beginning work to quantify FSC resources for NYS. In doing so, a thorough review of
the literature was conducted along with some primary data collection to assess and select
FSC resource generation factors. In addition to characterizing FSC resources, data was
also collected on utilization pathways. This data was then analyzed quantitatively,
geographically and using a material flow analysis. The specific outcomes were as
follows:
1. Provide a framework for analyzing New York State FSC resources.
2. Quantify New York State FSC resources and provide FSC resource generation
factors.
4. Apply material flow analysis to identify trends, opportunities and challenges
related to emerging FSC utilization technologies in New York State.
5. Identify knowledge gaps to inform technology development described in the
remaining chapters of this dissertation and other work leading to the goal of a
sustainable food supply chain for New York State.
This work is intended to inform planners, developers, municipalities and
individual establishments in achieving social, environmental and economic goals for FSC
resource management. This chapter should be viewed as a starting point for NYS.
Available data and methodologies are thoroughly discussed to provide a foundation for
other studies. Data gaps and suggestions to fill these gaps are also discussed.
2.2. Methods
2.2.1 Generation of FSC resources
A bottoms-up approach was taken to assess resources at each step of the FSC.
Public and private databases, and data obtained through freedom of information law
(FOIL) requests were used to identify New York State FSC resource generators along
with significant characteristics. An initial focus was placed on larger generators.
FSC resource generation was estimated in some cases by applying a FSC
resources generation factor. Interviews, surveys or primary data were also applied to
2.2.1.1
Primary production
Only post-harvest losses were considered in this analysis. Therefore crop residues
and un-harvested crops were excluded.4 Similarly, livestock production generates vast
amounts of manure in the State, while this is not within the boundaries of this analysis
some information is provided as reference.5
Therefore, FSC resources at the primary production level mainly consist of
post-harvest perishable crop losses6.
Data from the USDA Agricultural Census for NY was used to identify the top
crops for the state7. Loss factors from the USDA’s LAFA database were then applied to
estimate the weight of crops harvested but not sold8.
2.2.1.2
Food manufacturing and processing
A query of the business database ReferenceUSA® (Infogroup, 2014) was used to
identify and locate food manufacturers and processors in the NYS food supply chain
4 Gunders et al. (2012) estimated that approximately 7% (but up to 50%) of crops planted are not
harvested in the US. Reasons include pests, disease, weather, labor shortages, consumer quality standards and economics.
5 The reader is directed to other work by the author for details on quantifying this resource (Chan
et al., 2013; Ebner et al., 2014).
6 Livestock morbidity losses from farm to retail were excluded at this time as they were assumed
to be small.
7 USDA National Agricultural Statistics Service (NASS), NYS Agricultural Overview 2014,
http://www.nass.usda.gov/Quick_Stats/Ag_Overview/stateOverview.php?state=NEW%20Y ORK
8 USDA, Loss Adjusted Availability data (LAFA), 2015c, http://www.ers.usda.gov/data‐
based upon North American Industry Classification System (NAICS) codes and criteria
for number of employees and sales:
NAICS 311-312 (all NAICS) 9 State of New York
5+ employees $1M+ in sales
The data was then reviewed and compared to industry databases or other sources
to remove duplicates and improve accuracy. Food Processors were grouped into broad
[image:37.612.102.524.314.678.2]categories based upon the type of FSC resources generated (Table 2-1).
Table 2 -1: Food manufacturers and processor categories and descriptions
Category Description
Bakery/Mill Commercial bakeries, cookies, crackers, pasta, dough, flour mills, snacks
and cereal manufacturers
Beverages/ Syrups/
Sauces Makers of soft drinks, juices, sauces, dressings, flavorings, ciders
Breweries Beer makers
Canning Fruit, vegetable and specialty canning, jellies, including tomato sauce and
apple sauce
Coffee/Tea/Tobacco Coffee, tea and tobacco producers
Confectionary/ Candy Candy makers, confectioners and sugar processors
Wineries Wine makers
Dairy Cheese, milk, yogurt, ice cream and butter creameries
Distillery Maker of distilled spirits
Frozen foods Frozen fruit, vegetables, meal and specialty item producers
Meat /Seafood Slaughter houses, commercial butchers, meat packers, hatcheries
Spice/ Dehydrated Spice manufacturer and dehydrated foods
Misc. Nut butters, soup, gourmet food, soy products, rendering, other
A variety of techniques have been employed in previous studies to estimate
resource generation at the processor level and have generally concluded that estimation is
tedious and challenging (Amon et al., 2012; Ma, 2006; Safferman et al., 2007).
Generalized formulae are difficult to apply to food processors for several reasons.
Differences in final products within a category (e.g., meat packer vs. meat curing house)
can generate different FSC resource profiles as will different manufacturing or waste
treatment processes. Also, technology advances and process improvements also make
FSC resource dynamic and estimates quickly obsolete. Moreover, limited data is publicly
available and many processors are reluctant to share data on FSC resources either out of
proprietary concerns or concerns over drawing unwanted attention from regulators.
This study therefore used two main techniques to obtain data on the food
manufacturing and processing sector: 1) survey of food processors, and 2) publicly available
data obtained through freedom of information act law (FOIL) requests or reports. This data
was used to presents a broad representation of FSC management at this level. The analysis is
viewed as a starting point for further analysis and discussion.
Survey of food processors: As part of his dissertation on a spatial decision
support system for organic waste in New York, Ma (2006) collected data from 33 food
processors in New York State. However, given the pace of change in the market and
technology of the food processing industry, it was determined that additional data should
be obtained as part of the current research program. A phone survey was prepared in
2013 and several food processors throughout the state were contacted however a very
poor response was initially achieved. A second survey was attempted with a focus on
case, the survey was administered online through email distribution, by phone and/or in
person. Respondents were asked to provide information on their company and the
volume and characteristics of FSC resources leaving their plant in the form of wastewater
or solid waste. In some cases, information on waste treatment on-site was also provided.
The survey form is provided in Appendix A.
Public record: In some communities, companies that utilize the publicly owned
wastewater treatment works (POTW) are required to pay a surcharge for discharges that
have high total suspended solids (TSS) and/or biological oxygen demand (BOD), or other
characteristics (e.g., high phosphorous or chlorine content). These are classified as “high
strength” wastewater discharges. A FOIL request was made to all of the counties in
NYS requesting this data. The response was limited because not all counties operate
their POTW, maintain records of high strength discharges or charge a surcharge. The
largest source of data was obtained from Monroe County, where RIT is located.
In addition the New York State Department of Conservation (NYS DEC) prepares
reports on a variety of other activities related to FSC resource utilization. This included
data on resources that are treated at a registered organics recycling facility and regulated
resources that are land applied or diverted to feed animals or to another beneficial use.
These reports are discussed in the in the waste utilization pathway section below.
2.2.1.3
Retail and distribution
The retail/distribution sector consists of markets, wholesalers and distribution
centers. In an effort to focus on larger generators the initial focus was on supermarkets,
convenience stores and big box stores with grocery sections. A marketing database
Primary NAICS keywords “supermarkets, convenience stores and grocery stores”
Also Walmart and Target stores with 445110 in all NAICS State of NY
5+ employees $1M+ in sales
Data from the California waste characterization studies was used to develop a
FSC resource generation factor based upon number of employees. This factor compared
well with data collected for 6 NY supermarket stores that tracked data on FSC resources
diverted utilization program for one year (2012-13). However this factor was higher than
one based upon studies from the 1990s possibly due to the expanded food preparation
operations at many modern supermarkets (Table 2-2).
While averages agreed significant variability between stores was observed. This
is presumed to be due to different store operations and thus when seeking a factor to
estimate store level FSC resources, considerations such as the amount of produce and
prepared foods on-site should be used to adjust the resource generation factor
accordingly.
The only data available for big box retail stores (ie. Wal-Mart and Target) was
from the California study (Calrecyles, 2006). No data specific to convenience stores
Table 2-2: Literature review of Supermarket FSC resource generation factors
Source Description kg/employee-yr
(Calrecyle, 2006) food stores 2,104
(Calrecyle, 2014) food and beverage stores 1,835
NY Grocery chain (2014)
store 1 4,355
store 2 697
store 3 2,236
store 4 660
store 5 1,427
store 6 2,591
average 1,994
(CDEP, 2001) Literature review
Kings County, 1995 (survey) 1,300
King County, 1995 (audit) 1,482
Newell et al., 1993 1,291
Jacob, 1993 (20,000 sf stores) 1,573
Jacob, 1993 (30,000 sf stores) 1,309
Jacob, 1993 (45,000 sf stores) 1,227
Newell and Snyder, 1996 1,327
Grocery Industry committee, 1991a 1,409
Grocery and Industry Committee, 1991a 1,245
Average 1,355
Used in this study 2000b
a Converted from lbs/$1000
b rounded to nearest significant figure to indicate implied precision of the estimate
2.2.1.4
Food service and consumption
Food service and consumption was broken into 3 broad sectors and then several
Institutions
There are a variety of institutions that generate FSC resources through food
service and housing operations. Three sub-sectors of institutions were analyzed:
education, health and medical and entertainment, lodging and restaurants.
Education: Kindergarten through grade 12 (K-12) schools were analyzed on a
district level basis. Student enrollment data for public and private K-12 schools was
collected from the NY State Education Department (NYSED) Information and Reporting
Service (IRS)10.
Studies that have estimated K-12 food supply chain resources (Griffin et al., Ma,
2006) have generally based their analyses on data from the late 1990s (Block, 2000,
Hollingsworth et al., 1995). A thorough review of available literature was conducted to
determine an appropriate FSC resource generation factor (Table 2-3). This included
several more recent studies as well as data publicly reported by the Vermont Central
school district compost program (Appendix A, Table A-1)11. The Vermont data was
considered the most recent, extensive and relevant dataset.
For simplicity a single K-12 factor was used in this study, however, it has
consistently been observed that greater resources are generated at the Elementary level
with decreasing rates at middle and high school levels (Appendix A, Table A-2).
10 NYS Education Department (NYSED) Information and Reporting Service (IRS), Public and
Charter School Enrollment 1993-94 to 2013-14, accessed March 10, 2014, http://www.p12.nysed.gov/irs/statistics/enroll-n-staff/home.html
11 It is acknowledged that is factor is actually a FSC resource diversion factor and not a true
Therefore, this factor should be adjusted appropriately if used to estimate resources for an
individual school. Furthermore, this analysis does not include liquid resources, however a
study in Florida estimated milk waste to be nearly half the weight of solid resources
generated at the Elementary level and thus may be an important resource to consider in
some cases (Appendix A Table A-2).
Table 2-3: Literature review of FSC resource generation in K-12 schools
kg/student‐yr Notes
Hollingsworth et al., 1992 23 6 Louisiana schools Hollingsworth et al., 1995 31 7 Louisiana schools Block, 2000 27 15 Kansas schools MPCA, 2010 10 6 Minnesota schools Wilke et al, 2014 9 3 Florida schools Vermont, 2015 15 27 Vermont schools Cascadia, 2014 11 51 CA educational facilitiesa Used in this study 15
a Includes all educational facilities based upon NAICS code, not just K-12
Information on NY State colleges and universities, including full year enrollment
was obtained from the NYS Department of Education (NSED) research and information
system (ORIS).12
The most commonly cited formula to estimate FSC resources for colleges and
universities level is based upon a review of literature from 1997-2001 (CDEP, 2001).
12 NYS Education Department (NYSED) Office and Reporting and Information Service (ORIS),
Similar to the K-12 studies it used meal audit data from studies in the literature to
arrive at a weight/meal estimate, which was multiplied by annual meals served at the
institution per enrolled student, which was based upon a limited sample of expert
estimates.
A thorough review was also conducted to determine an appropriate FSC resources
generation factors for colleges and universities. It included peer-reviewed studies in the
literature as well as publicly available data and reports from colleges and universities that
conducted waste audits or employ organic waste diversion programs. Meal audit data
from 11 institutions and campus level data from 13 institutions were analyzed and
reported in Ebner et al. (2014). A summary of the results is included in Appendix A
(Table A-3, Table A-4, Table A-5).
The results of this analysis showed that both the commonly used meal audit factor
and the meals per enrolled student estimate may need to be revised. Furthermore, data on
meals served at the institution per enrolled student is difficult to obtain. Therefore, a
factor based upon institution level data was recommended. This factor was arrived at via
Figure 2-2: Regression of institution level food waste vs. annual student
enrollment for colleges and universities
Reasons for poor fit of data points to the regression were attributed to: 1)
institutions with higher or lower staff/faculty to enrolled student ratios (i.e., very small or
very big schools); 2) schools with high rates of visitors to campus (i.e., big sports
programs or research institutes); or 3) schools with very high or low access to off-campus
food sources (ie., rural or urban). Thus adjustments in the FSC resource generation
factor should be made when estimating resources for specific institutions that fall within
these categories.
No data could be found to estimate FSC resources from community colleges,
however a factor based upon 4-year residential schools was assumed not to apply. Expert
interviews in the early Connecticut study suggested that community colleges serve
approximately 1/4th as many meals as residential institutions (CDEP, 2001). In the
y = 25kg/enrolled student
R² = 0.77
‐ 500 1,000 1,500 2,000 2,500
‐ 20,000 40,000 60,000 80,000 100,000
Annual
food
wa
st
e
(t/yr)
absence of more recent data this estimation is applied to 2-year schools and the other
factor used for 4-year schools.
Finally, low solids waste was not included at this time as it was shown to be a
small contribution to FSC resources based upon cafeteria audits (Appendix Table A-3).
Health and Medical: Data from the NY Department of health including bed
counts was obtained for nursing homes13 and hospitals14 in the State.
The FSC resource generation factor most commonly cited for hospitals and
nursing homes can be traced to the CDEP study (2001). Similar to the factor for the
college and university sub-sector, it used a waste per meal value based upon reviewed
studies dating from the mid-1990s. This was then extrapolated to the institution level by
multiplying by the number of meals served at the institution per bed, which was
estimated by surveying 7 Connecticut health care institutions. This was compared to
most recent data on this sector from the California audits which resulted in 1/5th the factor
(Appendix A, Table A-7) (Calrecycle, 2014). The California factor was applied in the
current research with improved data on hospital and nursing home FSC resource
generation factors identified as an area for future work.
Government facilities: Data on correctional facilities including inmate counts
for county jails and state and federal prisons was obtained through a FOIL request to the
NY Department of Corrections and Community Supervision (NYDOCCS).
13 NY State Department of Health (DOH), Adult Care Facility Annual Bed Census Data:,
http://www.health.ny.gov/facilities/adult_care/
14 NY State Department of Health (DOH), New York Hospitals by County,
Several sources cite FSC resource generated at approximately 1lb/inmate/day
(FDEP, 2004; U.S. EPA, 1998). Data reported through the composting program of the
NYDOCCS suggest that this estimate may be a high as their program averages about
0.65lbs/inmate/day (U.S. EPA, 1998). The estimate based upon NYDOCCS was used as
it was assumed that these programs have high compliance rates and therefore the amount
composted closely reflects the amount generated.
The State’s five military bases were not included as this time. Although they
house approximately 24,000 service persons there was insufficient information available
to confidently derive a FSC resource factor at this time. Data on other governmental
institutions was also excluded at this time.
Entertainment, hospitality and restaurants
Entertainment: consisted of amusement parks, golf courses, country clubs, ski
and bowling facilities, museums, historic sites, parks, zoos, theatres, concert venues,
racetracks and sporting arenas. These were identified through a marketing database
query (Infogroup, 2014) based upon the following criteria:
Primary NAICS 711219, 711212, 711310, 712, 713110,713910, 713920, 713950
State of NY 10+ employees $1M+ in sales
FSC resource generation estimation was based upon the only reported study of
this sector, which included audits of 53 California establishments (Calrecycle, 2014).
Hospitality: includes hotels, bed and breakfasts, Inns and other forms of lodging.
A marketing database query (Infogroup, 2014) was made based upon the following
Primary NAICS 721 State of NY
10+ employees $1M+ in sales
FSC resources generated by this sector were based upon California audit data (Appendix (Calrecyle, 2006; Calrecycle, 2014) (Appendix A, Table A-8).
Restaurants were identified through a marketing database query (Infogroup,
2014) based upon the following criteria:
Primary NAICS 722511 State of NY
5+ employees $1M+ in sales
A FSC resource estimation factor based upon number of employees was used
(Calrecycles, 2014).
Households
Most studies of household resources do not actually measure FSC resource
generated but rather FSC resource disposed by auditing trash or MSW for a given
population. Thus this estimate does not include resources that are backyard composted,
disposed via in-sink garbage disposals or fed to household pets.
Estimated FSC resources generate were based upon the Calrecycle studies which
averaged about 230kg/household/year (Calrecycle, 1999; Calrecycle, 2008). This was
slightly lower than estimates gathered from a private community compost service that has
collected data on weekly container pick-ups of approximately 200 households for 2 years
(Appendix A, Table A-9). They report that most households were 2-person, but some
difficult to extrapolate this to statewide households. This is an area that would also
benefit from further research. .
Table 2-4: FSC resource generation factors for FSC sector and sub-sectors
FSC sector and sub-sectors FSC resource Generation
Factora Units
Retail and Distribution
Supermarkets 2000 kg/employee‐yr
Convenience Stores 2000 kg/employee‐yr
Big box stores 250 Kg/employee‐yr
Food service and consumption
Institutions
Schools K-12 15 kg/student‐yr
Universities 25 kg/student‐yr
Community and grad schools 5 kg/student‐yr
Hospitals 140 kg/bed‐yr
Nursing Homes 140 kg/bed‐yr
Facilities 100 kg/inmate‐yr
Entertainment, hospitality and restaurants
Entertainment 850 kg/ employee‐yr
Hospitality 2100 kg/ employee‐yr
Restaurants 1500 kg/employee/yr
Households 220 kg/household/yr
aFactors are rounded to the nearest significant digit
Summary of FSC resource generation factors
The foods supply chain resource generation factors used in this study for the retail
2.2.2 FSC resource utilization pathways:
Several utilization pathways exist in the state. Data on resource utilization
pathways was collected through surveys and reporting available publicly or accessed
through a FOIL request as discussed below.
2.2.2.1
Donation
Resources can leave the FSC but still have the potential to be suitable for human
consumption. This can include manufactured product that does not conform to
specifications and excess supply that cannot be effectively marketed either due to
appearance, damage to packaging or proximity to expiration data.
Ten regional food banks serve NYS.15 A survey was sent to each of the food
banks to gather data on the sources and composition of the FSC resources received
(Appendix A). Additional data was gleaned from public sources when available. Only 3
of the 10 facilities were able to provide a detailed breakdown on the sources of FSC
resources received and the data provided varied year over year. This data was averaged
annually and scaled based upon the annual donations received to extrapolate it to the
State level (Appendix A, Table A-11). The data is intended to serve as a starting point,
with the suggestion that processes be put in place to improve future data collection.
While every effort is made by food banks to utilize the FSC collected some
resources are not redistributed due to biological decay, health risk or capacity of the
distribution channel and are diverted to other utilization pathways. Data on the amount
15Feeding America, Find a food bank,
of non-distributed resources and the utilization pathways used was also solicited in the
survey and was reported for 4 New York State food banks. On average 4% of resources
received were estimated to be non-distributed. The composition and utilization of these
resources varied across the food banks.
2.2.2.2
Diversion to feed animals and other beneficial uses
Feeding food scraps or food processing by-products to animals has been practiced
for centuries. It is a way of returning resources back to the FSC providing nutrients and
calories to animals and displacing alternative feeds. FSC resources can be directly fed
(sometimes referred to as wet feed) to animals with minimal processing this is sometimes
referred to as wet feed. FSC resources can also be processed on-site (usually including a
drying process) or at another facility into a constituent that is sent to a feed mill and
blended into commercial animal feed.
When FSC resources are used to substitute feed or another manufactured product
they are put to beneficial use. In particular generators of FSC resources that are used in
this way can be granted a beneficial use determination (BUD) from the NYSDEC. Once
a BUD is granted these FSC resources are no longer considered wastes and are no longer
under the jurisdiction of the Part 360 regulat