QUANTITATIVE ESTIMATION, ANALYTICAL
METHOD DEVELOPMENT AND VALIDATION FOR
DRUGS ACTING ON CENTRAL NERVOUS SYSTEM
A dissertation submitted to
THE TAMILNADU Dr.M.G.R MEDICAL UNIVERSITY
CHENNAI- 600 032In partial fulfillment of the requirements for the award of degree of
MASTER OF PHARMACY
IN
PHARMACEUTICAL ANALYSIS
SUBMITTED BY
VEHKATESH SURISETTY
(Reg. No. 261230963)Under the guidance of
Dr.P.Dheen Kumar,
M.Pharm., Ph.D.,DEPARTMENT OF PHARMACEUTICAL ANALYSIS
EDAYATHANGUDY.G.S PILLAY COLLEGE OF PHARMACY
QUANTITATIVE ESTIMATION, ANALYTICAL
METHOD DEVELOPMENT AND VALIDATION FOR
DRUGS ACTING ON CENTRAL NERVOUS SYSTEM
A dissertation submitted to
THE TAMILNADU Dr.M.G.R MEDICAL UNIVERSITY
CHENNAI- 600 032In partial fulfillment of the requirements for the award of degree of
MASTER OF PHARMACY
IN
PHARMACEUTICAL ANALYSIS
SUBMITTED BY
Reg. No. 261230963
DEPARTMENT OF PHARMACEUTICAL ANALYSIS
EDAYATHANGUDY.G.S PILLAY COLLEGE OF PHARMACY
NAGAPATTINAM-611002
ACKNOWLEDGEMENT
I would like to express profound gratitude to
Chevalier
Thiru.G.S.Pillay,
Chairman, E.G.S.Pillay College of Pharmacy, and
Thiru.
S.Paramesvaran, M.Com, FCCA,
Secretary, E.G.S.Pillay College of
Pharmacy.
I express my sincere and deep sense of gratitude to my guide
Dr.P.Dheen Kumar,M.Pharm.,Ph.D., Associate Professor, E.G.S.Pillay
College of Pharmacy, for his guidance, invaluable and extreme support,
encouragement, and co-operation throughout the course of my work.
I wish to express my great thanks
Prof.Dr.D.Babu Ananth,
M.Pharm., Ph.D.,
Principal, E.G.S.Pillay College of Pharmacy, for his support
during my project work.
I wish to express my great thanks to
Prof.Dr.M.Murugan,
M.Pharm., PhD,
Director cum Professor, Head, Department of
Pharmaceutics, E.G.S.Pillay College of Pharmacy, for his support during my
project work.
I wish to express my great thanks to
Prof.K.Shahul Hameed
Maraicar, M.Pharm., (PhD),
Director cum Professor , Department of
Pharmaceutics, E.G.S.Pillay College of Pharmacy, for his support during my
project work.
I would like to extend my thanks to all the
Teaching Staff
and
Non
Teaching Staff
, who are all, supported me for the successful completion of my
project work.
Last but not least, I express my deep sense of gratitude to my parents,
TABLE OF CONTENTS
Sr. No.
CHAPTER
Page No.
1
INTRODUCTION
1
2
REVIEW OF LITERATURE
28
3
OBJECTIVE
38
4
METHODOLOGY
40
5
RESULTS AND DISCUSSION
79
6
SUMMARY
88
7
CONCLUSION
93
INTRODUCTION
A drug1
may be defined as substance meant for diagnosis, cure, mitigation, prevention
and treatment of disease in human beings or animals, for altering any structure or function of
the body of human beings or animals2
. Pharmaceutical chemistry3-6
is a science that makes
use of general laws of chemistry to study drugs i.e. their preparation, chemical nature,
composition, structure, influence on an organism, the methods of quality control and the
conditions of their storage etc. The family of drugs may be broadly classified as
1. Pharmacodynamic agents 2. Chemotherapeutic agents
Pharmacodynamic agents7 refer to a group of drugs which stimulates or depress
various functions of the body so as to provide some relief to the body in case of body
abnormalities without curing the disease.
Chemotherapeutics agents are drugs, which are selectively more toxic to the invading
organisms without causing harmful effect to the host. E.g. Antimalarial, antibacterial,
antifungal agents
Every country has legislations8
on bulk drug and their pharmaceutical formulations
that sets standards and obligatory quality indices for them. These regulations are presented in
separate articles relating to individual drugs and are published in the form of book called
“Pharmacopoeia” [e.g. IP9
, BP10
and Martindale Extra Pharmacopoeia11
(MEP)]
Pharmaceutical Analysis12-15 plays a very significant role in quality16 control of
pharmaceuticals through a rigid check on raw materials used in manufacturing of
formulations and on finished products. It also plays an important role in building up the
quality products through in process quality control. Pharmaceutical analysis is the application
of principles of analytical chemistry to drug analysis. The analytical chemistry17-20
may be
analytical results have played critical roles from the understanding of basic science to a
variety of practical applications such as biomedical applications, environmental monitoring,
quality control of industrial manufacturing and forensic science.
The methods of estimation of drugs are divided into physical, chemical,
physicochemical and biological ones. Physico-chemical and physical methods are used the
most. Physical methods of analysis involve the study of the physical properties of a
substance. They include determination of solubility, transparency or degree of turbidity,
colour density, specific gravity (for liquids), moisture content, melting, freezing and boiling
points. Physicochemical methods21-23
are used to study the physical phenomenon that occurs
as result of chemical reactions. Among the physicochemical methods, the most important are
optical (refractometry, polarimetry including photocolourimetry and spectrophotometry
covering UV-visible and IR regions nephelometry or turbidimetry) and chromatographic
(column, paper, thin-layer24, gas liquid25-26, HPLC27-28) methods. The number of new drugs is
constantly growing. This requires new methods for controlling the quality.
Types of analytical chemistry29-30
Traditionally, analytical chemistry has been split into two main types, qualitative and
quantitative:
There are main two types of chemical analysis.
1. Qualitative (identification)
2. Quantitative (estimation)
1. Qualitative analysis is performed to establish composition of natural/synthetic substances.
These tests are performed to indicate whether the substance or compound is present in the
sample or not. Various qualitative tests are detection of evolved gas, formation of precipitates,
2. Quantitative analytical techniques are mainly used to quantify any compound or
substance in the sample. These techniques are based on
(a) The quantitative performance of suitable chemical reaction and either measuring the
amount of reagent added to complete the reaction or measuring the amount of reaction
product obtained
(b) The characteristics movement of a substance through a defined medium under controlled
conditions
(c) Electrical measurement
(d) Measurement of some spectroscopic properties of the compound.
Different techniques of Analysis
1. Methods based on chemical analysis 31-33
These methods are based on traditional method of analysis and may be divided as:
(i) Titrimetric (ii) Gravimetric (iii) Volumetry
i. Titrimetric Analysis34
In this technique the substance to be determined is allowed to react with an
appropriate reagent added as a standard solution and the volume of solution needed for
completion on reaction is determined. Following are the types of titrimetric analysis:
• Neutralization (acid-base) reactions.
• Complexometric titrations
• Precipitation titrations
• Oxidation- reduction titrations
• Non aqueous titrations ii. Gravimetric Analysis35
electrolysis of the substance is carried out and the material deposited on one of the electrodes
is weighed. This technique is called as electrogravimetry.
iii. Volumetry Analysis:
It is concerned with measuring the volume of gas evolved or absorbed in a chemical
reaction.
2. Electrical Methods of Analysis36-37: These involve the measurement of current voltage or
resistance in relation to the concentration of a certain species in a solution. These methods are
of following types:
a) Voltametry:
It is the measurement of current at a microelectrode at a specified voltage.
b) Coulometry:
It is the measurement of current and time needed to complete an electrochemical
reaction or to generate sufficient material to react completely with a specified reagent.
c) Conductometry:
It is the measurement of electrical conductivity of a solution. The ionic reactions in
which there is a sudden change in conductance after completion of reaction, can act as a basis
of conductometric titration method. d) Potentiometry:
It is the measurement of the potential of an electrode in equilibrium with an ion to be
determined.
3. Optical methods of analysis38-40
The optical methods are basically of two types:
i. Absorption methods
ii. Emission methods.
Absorption spectroscopy refers to spectroscopic techniques that measure the
absorption of radiation, as a function of frequency or wavelength, due to its interaction with a
sample. The sample absorbs energy, i.e., photons, from the radiating field. The intensity of
the absorption varies as a function of frequency and this variation is the absorption spectrum.
Absorption spectroscopy is performed across the electromagnetic spectrum. Absorption
spectroscopy is employed as an analytical chemistry tool to determine the presence of a
particular substance in a sample and in many cases, to quantify the amount of the substance
present.
Absorption methods are usually classified according to wavelength involved:
i. Visible spectrophotometry
ii. Ultraviolet spectrophotometry
iii. Infrared spectrophotometry
Visible spectrophotometry:
The method of analysis is based on measuring the absorption of monochromatic light
by colored compounds in the visible path of the spectrum (370-800 nm). If the analytes are
colorless, they are converted into colored compounds by reaction with a suitable
chromogenic reagent. In this case, the majority of colored compounds are complexes or
complex ligands. The later must be stable and have a constant composition and high color
intensity. The photometric methods of analysis are based on the Bouger-Lambert-Beer’s law,
which establishes that absorbance by a solution is directly proportional to the concentration
of the analyte. The fundamental principle of operation of spectrophotometer covering visible
region consists in that light of definite interval of wavelength passes through the radiant
The absorption of light by analytes is due to the presence of chromophores in their
molecules, which are specific portions of molecules can absorb radiant energy in the UV or
visible region. They include unsaturated functional groups. Every functional group in a
molecule of a substance is characterized by the absorption of light in a definite region of the
spectrum and this property is used for the identification and quantification of a substance in a
drug. In addition to chromophores, a molecule may contain one or more saturated functional
groups that themselves do not absorb in the UV/visible region being scanned, but can affect
the behaviour of the chromophores that are conjugated with these groups are called
auxochrome (e.g. SH, NO2, OH), which usually cause absorption by a chromophores at
higher wavelength and at a longer value of the absorptivity than found for the given
chromophores itself.
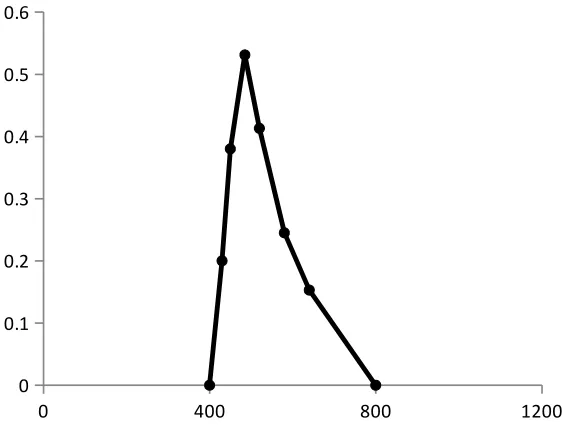
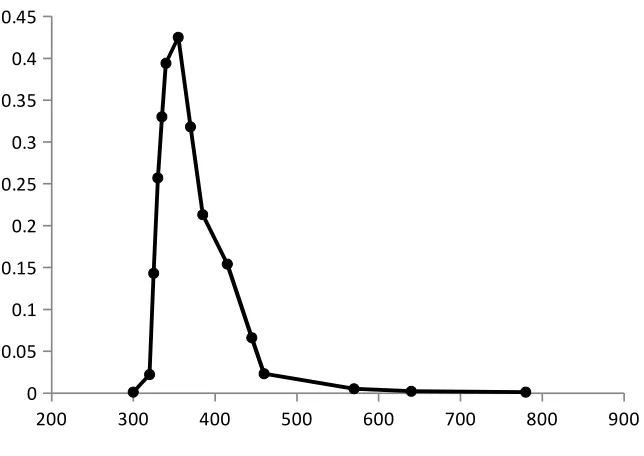
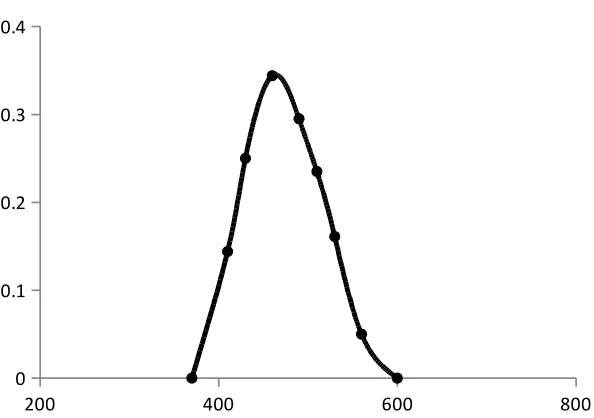
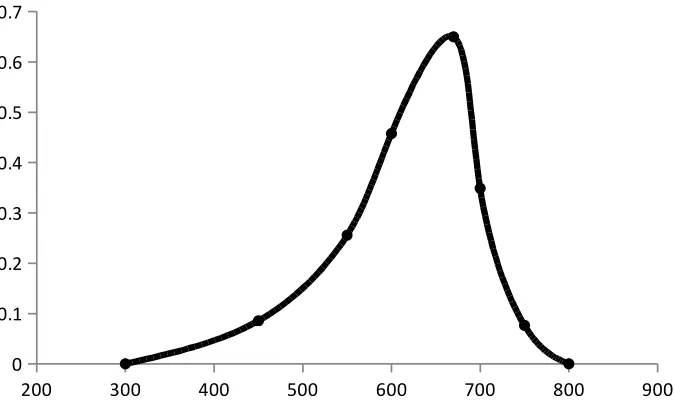
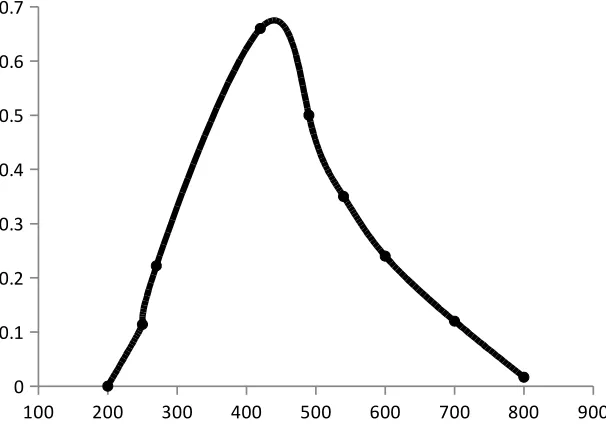
Absorption spectrum
The absorption spectrum is a graphical representation of the amount of light absorbed
by a substance at definite wavelengths. To plot absorption curve, the value of the wavelength
(λ) are laid off along the axis of abscissas and the values of the absorbance along the axis of
the ordinates. A characteristic of an absorption spectrum is a position of the peaks (maxima)
of light absorption, which is determined by the absorptivity at definite wavelengths.
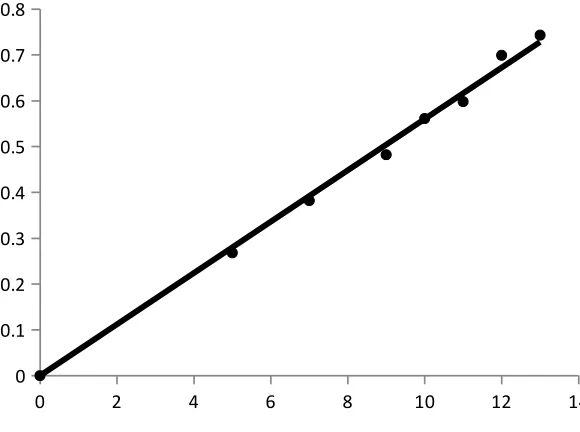
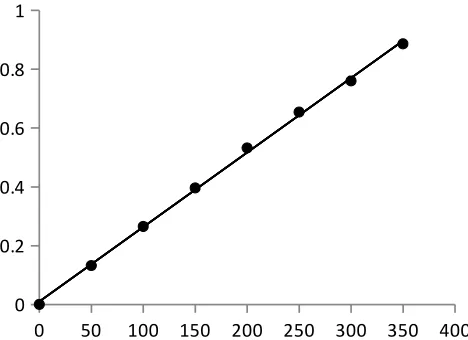
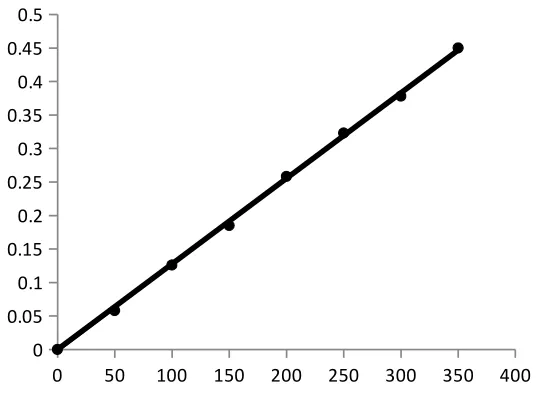
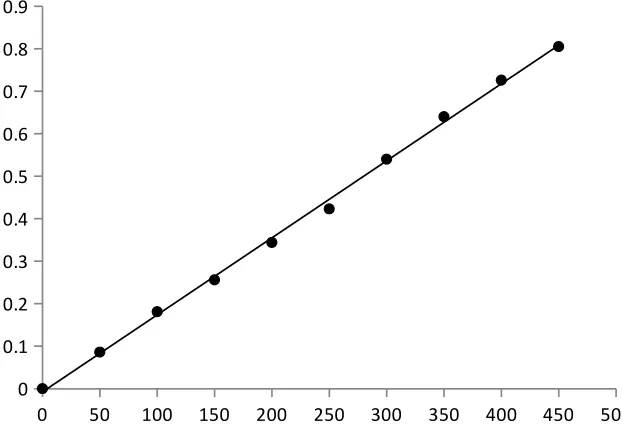
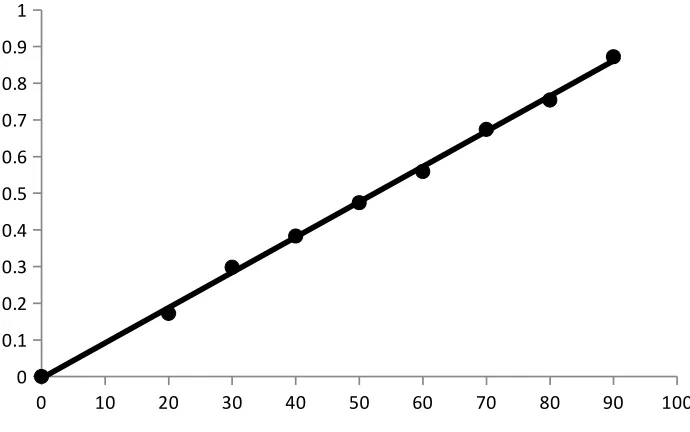
Beer’s law plot
A standard specimen of the analyte is taken and the solutions of it with known
concentrations are prepared. The absorbance of all the solutions are measured at a definite
wavelength (λmax) and the calibration curve is plotted by laying off the known concentrations
along the axis abscissas and the absorbances corresponding to them along the axis ordinates.
The calibration curve is used to determine the unknown concentration of the analyte in its
A feature of organic drugs is the presence of functional groups in their molecules i.e.,
reactive atoms or groups of atoms determined by chemical reactions. Functional groups
determine the way of analysing organic drugs because they are responsible for the properties
of substance and determine the identification reactions and the methods of quantitative
determination of drugs. Knowing the reactions for detecting functional groups, one can easily
and conscientiously analyze any organic drug with a complicated structure. There are several
drug molecules, which are poly functional in nature, i.e., simultaneously contain two or more
functional groups41-44.
ii. Emission Method
In emission method sample is subjected to heat or electrical treatment so that the atoms
are raised to excited states causing them to emit-energy; and the intensity of this emitted
energy is measured. The emission spectroscopy includes flame photometry and fluorimetry.
In emission spectroscopy the sample is subjected to flame, electric arc or spark plasma and
the light emitted is examined. Flame photometry involves the solution of the sample, injected
into a flame while in fluorimetry a suitable substance in solution is excited by irradiating with
visible or ultraviolet radiation.
Chromatography45-48
Introduction:
Chromatography (from Greek: chroma, colour and: grafein to write) is the collective term for a family of laboratory techniques for the separation of mixtures. It involves passing a
mixture dissolved in a "mobile phase" through a stationary phase, which separates the analyte
to be measured from other molecules in the mixture and allows it to be isolated.
Chromatography may be preparative or analytical. Preparative chromatography seeks
Analytical chromatography normally operates with smaller amounts of material and seeks to
measure the relative proportions of analytes in a mixture. The two are not mutually exclusive.
Types of Chromatography49-51
Chromatography can be divided into three subsections namely gas, gel and liquid
chromatography. Gas chromatography is used for the analysis of volatile samples, gel
chromatography for non-volatile samples with a molecular weight smaller than 2000.
Gas Chromatography (GC) 52-54
Gas chromatography is a chromatographic technique that can be used
to separate organic compounds that are volatile. A gas chromatography consists of a flowing
mobile phase, an injection port, a separation column containing the stationary phase, a
detector, and a data recording system. The organic compounds are separated due to
differences in their partitioning behaviour between the mobile gas phase and the stationary
phase in the column.
High-performance liquid chromatography (HPLC) 55-56
In the field of analytical chemistry high performance liquid chromatography (HPLC)
is considered by many to be most exciting and dynamic technique of past decade. The typical
HPLC separation is based on the selective distribution of analytes between a liquid mobile
injection port into the mobile phase stream that is delivered by a high-pressure pump. Next,
the components of this sample mixture are separated on the column, a process monitored with
a flow-through detector as the isolated components emerge from the column.
General Methodology for Analytical Method Development
Development of a method57-58
:
In developing a quantitative method for determining an unknown concentration of a
given substance by absorption spectrophotometry, the first step will be the selection of
analytical wavelength which can be chosen either from literature or experimentally by means
of a scanning spectrum in the UV-Visible region. In order to enhance the sensitivity of the
method and signal to noise ratio, the wavelength of maximum absorbance is chosen as
analytical wavelength.
After selection of the wavelength, the colour developing reagent and the absorbing
product must be stable for a considerable period of time. Always the preparation of standards
and unknown should be on a definite time schedule.
Optimization of analytical method59
:
The bases of the spectrophotometric methods, in the present investigation are
(a) Oxidative coupling
(b) Oxidation followed by complex formation
(c) Diazotization and coupling
(d) Complex formation.
In each type of reaction, the yield of the coloured species whose absorbance is
measured and thus the sensitivity of the method, rate of color formation and stability are
affected by the concentration of the reagent in the solution. The nature of the solvent, the
one variable at time (OVAT) strategy appears to be simple, efficient and effective to establish
the optimum conditions. The OVAT approach requires all variable but one to be held constant
while a univariate search is carried out on the variable of interest.
Calibration:
Calibration is one of the most important steps in drug analysis. A good precision and
accuracy can only be obtained when good calibration procedure is used. In
spectrophotometric methods the concentration of a sample cannot be measured directly, but is
determined using another physical measuring quantity, “Y” (absorbance of a solution). An
unambiguous empirical or theoretical relationship can be shown between this quantity and
concentration of the analyte.
For the majority of analytical techniques the analyst uses the calibration equation.
Y= a + bX
In calibration, univariate regression is applied, which means that all observations are
dependent upon a single variable “X”.
The method of least squares60
:
Least squares regression analysis is used to describe the relationship between signal
and concentration. All models describe the relationship between response (Y) and
concentration (X) can be represented by general function.
Y= f(X, a1, b1...bm)
Where a1, b1...bm are the parameters of the function
We adopt the convention that ‘X’ values relate to the controlled or independent
variable and the ‘Y’ values to the dependent variable. This means that ‘X’ value has no error.
On the condition that errors made in preparing the standards are significantly smaller than the
unknown parameter a1, b1...bm must be estimated in such a way that the model fits the
experimental data points as far as possible.
The true relationship between X and Y is considered to be given by a straight line. The
relationship between each observation pair (Xi, Yi) can be represented as
Yi=α + βXi + ei
The signal Yi is composed of a deterministic component predicted by linear model and a
random component ei.One must now find the estimates ‘a’ and ‘b’ of the true values and α
and β which are constants. This is done by calculating values ‘a’ and ‘b’ for which ∑ei2 is
minimal. The component ei represents the difference between the observed Yi values by the
model.The ei are called the residuals, ‘a’ and ‘b’ are the intercept and slope respectively. The
equation given for slope and intercept of the line are as follows.
n∑iXi Yi -∑iXi . ∑iYi Slope (b)=
n∑iXi2 – [∑iXi]2
∑iYi∑iXi2-∑iXi . ∑iXi Y i Intercept (a) =
n∑iXi2 – [∑iXi]2
Correlation coefficient (r)
The correlation coefficient r (x, y) is more useful to express the relationship of the chosen
scales. To obtain a correlation, the covariance is divided by the product of the standard
deviation of x and y.
r=
[
∑
i=1
n
(
XiX)(
YiY)
]
(
n1)
[
∑
i=1
n
(
XiX)
2
∑
i=1
n
(
YiY)
Where X , Y are the arithmetic means of X and Y respectively.
Selectivity of the method
The determination of an analyte may be disturbed by matrix and interference effect.
Some of the excipients, incipient and additives present in pharmaceutical formulations may
sometimes interfere in the assay of the drug and in such instances appropriate separation
procedure is to be adopted initially. The selectivity of the method ascertained by studying the
effect of a wide range of excipients and other additives usually present in the pharmaceutical
formulation on the determinations under optimum conditions.
In the initial interference studies, a fixed concentration of the drug is determined
several times by the optimum procedure in the presence of suitable (1 to 100 fold) molar
excess of foreign compounds under investigation and its effect on absorbance of solution is
noticed. The foreign compound is considered to be non-interfering if at these concentrations,
it constantly produces an error less than 3% in the absorbance produced in the pure sample
solution.
Linearity and sensitivity of the method
Knowledge of the sensitivity of the color is important and the following terms are
commonly employed for expressing the sensitivity. According to the Beer’s law
Intensity of incident radiation
A= log = ε.C.T Intensity of transmitted light
The absorbance (A) is proportional to the concentration (C) of absorbing species if
the constant ε is called the molar absorptivity. Beer’s law and εmax values are expressed as
μg/ml and mole-1
cm -1
respectively.
Sandell’s sensitivity61 refers to the number of μg of the drug determined, converted to
the colored product, which in a column solution of cross section 1cm2
shows an absorbance
0.001 (expressed as μg cm-2
)
Ringbom’s plot62
The relative concentration error depends inversely upon the product absorbance and
transmittance. The relative error increases at the extremes of the transmittance (T) scale. The
slope of plot ‘C’ versus T, i.e. Ringbom’s plot gives relative coefficient (i.e. plot of log C α
T). The main limitation of the ringbom’s plot is that it provides no information concerning
the concentration range of good precision unless it is combined with ∆T versus T relation.
The above expression is valid whether or not Beer’s law is valid.
Recovery experiments (standard addition method)
A known amount of the constituent being determined is added to the sample which is
analyzed for the total amount of constituent present. The difference between the analytical
results for samples with and without the added constituent gives the recovery of the amount
of added constituent. If recovery is satisfactory our confidence in the accuracy of the
procedure will be enhanced.
Usually, recovery studies are performed while proceeding for pharmaceutical
formulations; known amounts of an analyte are spiked at different levels into a sample
matrix, which was already analyzed. The concentration of the analyte in the original sample
may then be determined mathematically.
X= amount of standard drug
Y= amount of drug found by the proposed method
N= Number of observations
ANALYTICAL METHOD VALIDATION AS PER ICH GUIDELINES63-66
Method validation is the process to confirm that the analytical procedure employed
for a specific test is suitable for its intended use. Methods need to be validated or revalidated.
• Before their introduction into routine use.
• Whenever the conditions change for which the method has been validated,
e.g., instrument with different characteristics.
• Whenever the method is changed, and the change is outside the original
scope of the method.
Method validation is completed to ensure that an analytical methodology is accurate,
specific, reproducible and rugged over the specified range that an analyte will be analyzed.
Method validation provides an assurance of reliability during normal use, and is sometime
referred to as "the process of providing documented evidence that the method does what it is
intended to do." Regulated laboratories must perform method validation in order to be in
compliance with FDA regulations.
For method validation, these specifications are listed in USP Chapter <1225>, and can
be referred to as the "Eight Steps of Method Validation". These terms are referred to as
"analytical performance parameters", or sometimes as "analytical figures of merit."
In response to this situation, one of the first harmonization projects taken up by the
ICH was the development of a guideline on the "Validation of Analytical Methods:
Definitions and Terminology67
."
METHOD VALIDATION
The developed methods were validated by following steps
• Precision
• Specificity
• Limit of quantitation
• Limit of detection
• Linearity and range
• Ruggedness and
• Robustness
Accuracy:
It is defined as closeness of agreement between the actual (true) value and mean
analytical value obtained by applying a test method number of times. Accuracy of an
analytical method is determined by systematic error involved. The accuracy is acceptable if
the difference between the true value and mean measured value does not exceed the RSD
values obtained for repeatability of the method.
The parameter provides information about the recovery of the drug from sample and
effect of matrix, as recoveries are likely to be excessive as well as deficient.
To document accuracy, the ICH guideline on methodology recommends collecting
data from a minimum of nine determinations over a minimum of three concentration levels,
covering the specified range (for example, three concentrations, three replicates each).
Accuracy is calculating the percentage recovery by the assay of the known amount of
analyte in the sample or as the difference between the mean and the accepted true value,
together with confidence intervals.
For assay method, spiked samples are prepared in triplicate at three intervals over a
range of 50-100% of the target concentration. Potential impurities should be added to the
procedure (i.e. same levels of standards and same number of samples and standard
injections).
Precision:
The precision of an analytical method is the degree of agreement among individual
test results when the method is applied repeatedly to multiple sampling of homogenous
sample. Precision is the measure of the degree of repeatability of an analytical method under
normal operation and is normally expressed as the percent relative standard deviation for a
statistically significant number of samples. According to the ICH, precision should be
performed at three different levels: repeatability, intermediate precision,and reproducibility. The precision of an analytical method is determined by assaying a sufficient number
of aliquots of a homogenous sample to be able to calculate statistically valid estimates of
standard deviation or relative standard deviation. The ICH documents recommended that the
repeatability should be assessed using a minimum of nine determinations covering the
procedure (i.e. three concentration and three replicates of each concentrations using a
minimum of six determinations at 100% of the test concentrations)
In the case of instrument precision, six replicates of the standard solution are made for the test performance of the chromatographic instrument.
In the case of method precision, six replicates from the same batch are analyzed for the assay and dissolution parameters and observing the amount of scatter in the results. An
example of precision criteria of an assay method is that the instrument precision RSD should
not be more than 2.0%.
Repeatability is the results of the method operating over a short time interval under
the same conditions (inter-assay precision). It should be determined from a minimum of nine
repetitions each) or from a minimum of six determinations at 100% of the test or target
concentration.
Intermediate precisionis the results from within lab variations due to random events
such as different days, analysts, equipment, etc. In determining intermediate precision,
experimental design should be employed so that the effects (if any) of the individual variables
can be monitored.
Reproducibility refers to the results of collaborative studies between laboratories.
Documentation in support of precision studies should include the standard deviation, relative
standard deviation, coefficient of variation, and the confidence interval.
Specificity:
It is the ability of an analytical method to assess unequivocally the analyte of interest
in the presence of components that may be expected to be present, such as impurities,
degradation products and matrix components. In case of the assay, demonstration of
specificity requires that the procedure is unaffected by the presence of impurities or
excipients. In practice, this can be done by spiking the drug substances or product with
appropriate levels of impurities or excipients and demonstrating that the assay is unaffected
by the presence of these extraneous materials. If the degradation product impurity standards
are unavailable, specificity may be demonstrated by comparing the test results of samples
containing impurities or degradation products to a second well-characterized procedure.
These comparisons should include samples stored under relevant stress conditions (e.g. light,
heat humidity, acid/base hydrolysis, oxidation, etc.).
Limit of Detection:
The limit of detection (LOD) is defined as the lowest concentration of an analyte in a
sample that can be detected, not quantitated. It is a limit test that specifies whether or not an
ratio convention, but also lists two other options to determine LOD: visual non-instrumental
methods and a means of calculating the LOD. Visual non-instrumental methods may include
LOD’s determined by techniques such as thin layer chromatography (TLC) or titrations.
LOD’s may also be calculated based on the standard deviation of the response (SD) and the
slope of the calibration curve (S) at levels approximating the LOD according to the formula:
LOD = 3.3(SD/S). The standard deviation of the response can be determined based on the
standard deviation of the blank, on the residual standard deviation of the regression line, or
the standard deviation of y-intercepts of regression lines. The method used to determine LOD
should be documented and supported and an appropriate number of samples should be
analyzed at the limit to validate the level. Limit of Quantitation:
The Limit of Quantitation (LOQ) is defined as the lowest concentration of an analyte
in a sample that can be determined with acceptable precision and accuracy under the stated
operational conditions of the method. Like LOD, LOQ is expressed as a concentration, with
the precision and accuracy of the measurement also reported. Sometimes a signal-to-noise
ratio of ten-to-one is used to determine LOQ. This signal-to-noise ratio is a good rule of
thumb, but it should be remembered that the determination of LOQ is a compromise between
the concentration and the required precision and accuracy. That is, as the LOQ concentration
level decreases, the precision increases. If better precision is required, a higher concentration
must be reported for LOQ. This compromise is dictated by the analytical method and its
intended use. The ICH has recognized the ten-to-one signal-to-noise ratio as typical, and also,
like LOD, lists the same two additional options that can be used to determine LOQ, visual
non-instrumental methods and a means of calculating the LOQ. The calculation method is
again based on the standard deviation of the response (SD) and the slope of the calibration
curve (S) according to the formula: LOQ = 10(SD/S).
Linearity is the ability of the method to elicit test results that are directly proportional
to analyte concentration within a given range. Linearity is generally reported as the variance
of the slope of the regression line. Range is the interval between the upper and lower levels of
analyte (inclusive) that have been demonstrated to be determined with precision, accuracy
and linearity using the method as written. The range is normally expressed in the same units
as the test results obtained by the method ICH25 recommended that, for the establishment of
linearity, a minimum of five concentrations. It is also recommended that the following
minimum specified range should be considered. For assay of a drug substance or a finished
product 80-120% of the test concentration should be taken. For an impurity test, the
minimum range is from the reporting level of each impurity, to 120% of the specification.
(For toxic or more potent impurities, the range should be commensurate with the controlled
level.)
Acceptability of the linearity data is often judged by examining the correlation
co-efficient and y-intercept of the linear regression line for the response versus concentration
plot. The correlation coefficient of >0.999 is generally considered as evidence of acceptable
fit of the data to the regression line. The y-intercept should be less than a few percent of the
response obtained for the analyte at to target level.
Ruggedness:
Ruggedness, according to the USP, is the degree of reproducibility of the results
obtained under a variety of conditions, expressed as %RSD. The ruggedness of an analytical
method is the degree of reproducibility of test results obtained by the analysis of the same
samples under a variety of conditions such as different laboratories, different analysts,
different instruments, different lots of reagents, different elapsed assay times, different assay
temperatures, different days, etc.
Robustness is the capacity of a method to remain unaffected by small deliberate
variations in method parameters. The robustness of a method is evaluated by varying method
parameters such as percent organic, pH, ionic strength, temperature, etc., and determining the
effect (if any) on the results of the method. As documented in the ICH guidelines, robustness
should be considered early in the development of a method. In addition, if the results of a
method or other measurements are susceptible to variations in method parameters, these
parameters should be adequately controlled and a precautionary statement included in the
method documentation.
The robustness of the methods was determined by performing the assay of the
triplicate by deliberately alternating parameters and that the results are not influenced by
different changes in the above parameters
Change in column temperature ±50
C
Change in flow rate ±10%.
Change in organic phase ± 2%.
Change in pH ± 0.2.
The system suitability and the precision of the assay were evaluated for the respective
condition. The robustness of an analytical procedure is the measure of its capability to remain
unaffected by small, but deliberate, variation in method parameters and providers an
indication of its reliability during normal usage.
Chromogenic reagents used in the present investigation.
Functional groups present in organic drugs determine the way of analyzing them
because they are responsible for the properties of substances and determine the identification
detecting functional groups, one can easily analyze any organic drug with a complicated
structure. In the present investigation, few visible spectrophotometric methods have been
developed for Pregabalin and Zolpidem by developing colour in each case with, appropriate
reagent. The analytically useful functional groups in the drug have not been exploited
completely in developing the new visible spectrophotometric method and so, the drugs have
been selected in the present investigation.
Different type of reagents like Folin’s, Sanger’s, Brady’s, Para chloranilic acid,
Gibb’s, MBTH, BM reagent were used in the present investigation for developing visible
spectrophotometric methods.
1, 2- Napthoquinone-4-sulphonate (NQS reagent) 68-69
NQS reagent is also called as Folin’s reagent. This reagent reacts with the compounds
containing amine group. In the present study due to the presence of amine as chromophoric
group in the Pregabalin molecule, derivatization of the compound was attempted with this
reagent, as a result colored complex has been formed which was estimated
spectrophotometrically. This reagent was generally prepared in water.
1-Flouro-2, 4-dinitrobenzene70-71
1-Flouro-2, 4-dinitrobenzene is also called as Sanger’s reagent. Sanger’s reagent
reacts with the compounds containing amine group. The reaction of pregabalin with Sanger’s
reagent resulted in the formation of Zwitter-ion-like structure due to the presence of the
carboxylic acid group adjacent to amino group. Reagent was prepared in methanol for the
present study. Reagent was highly skin irritant and stable up to seven days if stored in the
refrigerator. Care must be taken while using it.
2, 4-Dinitrophenyl hydrazine72-73
care must be taken with its use. It is red to orange solid, usually supplied wet to reduce its
explosive hazard. It is a substituted hydrazine, and is often used for the
determination carbonyl groups associated with aldehydes and ketones. The reagent was
generally prepared in water.
Parachloranilic acid74-75
p-Chloranilic acid mainly involves in the charge transfer reactions. P-CA acts as a π
acceptor. The interaction of drug with π-acceptor (p-CA) at room temperature was found to
yield colored charge transfer complex. In polar solvents, complete electron transfer from drug
as an electron donor, to the acceptor moiety takes place resulting in the formation of intensely
colored radical anions. The reagent was prepared in methanol for the present investigation.
2, 6 Dichloroquinone chlorimide76-77
2, 6 Dichloroquinone chlorimide is also called as Gibb’s reagent. Gibb’s reagent
mainly reacts with phenols, primary amines, secondary amines, aliphatic amines. For the
present study the reagent was prepared in methanol.
3-Methyl 2-benzathiozolinone hydrazone78-80
MBTH is synthesized by Besthron. MBTH can react with carbonyl compounds and
compounds containing amine group. It also forms a strongly electrophillic diazonium salt
when acted upon by an oxidizing agent. Ferric chloride has been mostly used as the oxidizing
agent for the determination of amines. For the present study the reagent was prepared in
distilled water.
Bratton Marshal reagent is also called as N-(1-naphthyl) ethylene diamine
dihydrochloride. It was white to light tan or grey crystalline solid or off white powder. It was
prepared by dissolving in water. It was light sensitive and hygroscopic. It mainly reacts with
the compounds containing amine as the functional group.
Central nervous system (CNS) acting drugs are widely used to treat various diseases
like Parkinsonism, Schizophrenia, Mania, Epilepsy, Insomnia, Depression, Anxiety,
Meningitis etc. A number of novel drugs like Pregabalin, Zolpidem, Galantamine,
Levetiracetam, Premipexole were reaching the market as an attempt to treat CNS diseases
and disorders. In the present study we have been selected Pregabalin and Zolpidem for the
quantitative determination. The main purpose of selecting those drugs was according to the
literature survey very few chromatographic and spectrophotometric method were developed
and still there was lot of scope to develop many analytical methods for the determination of
those drugs.
DRUG PROFILE
PREGABALIN
IUPAC Name : [S-[+]-3-isobutyl GABA or (S)-3-(amino
methyl)-5-methylhexanoic acid.
Structural Formula :
Molecular Mass : 159.23 g/mol.
Description : Pregabalin is a white to off-white crystalline solid
Solubility : Freely soluble in water and methanol
Melting point : 127-1340
C
Category : Pregabalin is an anticonvulsant and used in treatment of diabetic
neuropathy.
Storage : Pregabalin should be kept in well closed container, protected from
light.
Indication : For management of neuropathic pain associated with diabetic
peripheral neuropathy and postherpeutic neuralgia.
Mechanism of Action: Pregabalin binds with high affinity to the α-2-delta site (an auxiliary
subunit of voltage-gated calcium channels) in central nervous
system tissues. Although the mechanism of action of pregabalin is
unknown, results with genetically modified mice and with
compounds structurally related to pregabalin (such as gabapentin)
suggest that binding to the alpha2-delta subunit may be involved in
pregabalin’s antinociceptive and antiseizure effects in animal
models. In vitro, pregabalin reduces the calcium-dependent release
of several neurotransmitters, possibly by modulation of calcium
channel function.
Drug Interactions : No pharmacokinetic interactions have been demonstrated in vivo.
But some potential pharmacological interactions with opioids
(pregabalin is synergistic with opioids in lower doses),
benzodiazepines, barbiturates, ethanol (alcohol), and other drugs
Dosing : The recommended starting pregabalin dose for treating nerve pain
due to diabetic neuropathy is 50 mg three times daily. The
recommended starting pregabalin dose for controlling partial
seizures in people with epilepsy is 75 mg twice daily or 50 mg three
times daily.
ZOLPIDEM
IUPAC Name : N, N, 6-Trimethyl-2-p-tolyl-imidazole (1,2-a)pyridine-3-acetamide
L-(+)-tartrate
Structural Formula :
Chemical formula : (C19H21N3O) 2·C4H6O6
Molecular Mass : 764.88 g/mol.
Description : Zolpidem is a white to off-white, hygroscopic, crystalline powder.
Solubility : Freely soluble in water and sparingly soluble in methanol.
Melting point : 1950
C
Category : Zolpidem is used as hypnotic.
Storage : Zolpidem should be kept in air tight container, protected from
Mechanism of Action : Due to its selective binding, Zolpidem has very weak anxiolytic,
myorelaxant and anticonvulsant properties but very strong hypnotic
properties. Zolpidem binds with high affinity and acts as a full
agonist at the α1 containing GABAA receptors, about 10-fold lower
affinity for those containing the α2 and α3 - GABAA receptor
subunits, and with no appreciable affinity for α5 subunit containing
receptors. ω1 type GABAA receptors are the α1 containing GABAA
receptors and ω2 GABAA receptors are the α2, α3, α4, α5 and α6
containing GABAA receptors. ω1 GABAA receptors are primarily
found in the brain whereas ω2 receptors are primarily found in the
spine. Thus zolpidem has a preferential binding for the GABAA
-benzodiazepine receptor complex in the brain but a low affinity for
the GABAA-benzodiazepine receptor complex in the spine. Like the
vast majority of benzodiazepine-like molecules, zolpidem has no
affinity for α4 and α6 subunit-containing receptors. Zolpidem
positively modulates GABAA receptors, probably by increasing the
GABAA receptor complexes apparent affinity for GABA, without
affecting desensitization or peak current. Zolpidem increases slow
wave sleep and caused no effect on stage 2 sleep in laboratory tests.
Drug Interactions : Notable drug-drug interactions with the pharmacokinetics of
zolpidem include the following drugs chlorpromazine, fluconazole,
imipramine, itraconazole, ketoconazole, rifampicin, ritonavir.
Interactions with carbamazepine and phenytoin can be expected
There does not appear to be any interaction between zolpidem and
cimetidine and rantidine.
Dosing : The usual dose of zolpidem in adults is 5–10 mg. For healthy
adults, 10 mg is commonly recommended.
REVIEW OF LITERATURE
PREGABALIN
Rajinder Singh Gujral83et al reported a method for the determination of pregabalin in bulk,
pharmaceutical formulations and human urine samples using a isocratic reversed phase
HPLC method. Separation was accomplished on a C18 5µm ODS hypersil column using a
methanol, acetonitrile and 0.02M di-potassium hydrogen ortho phosphate (3: 1: 16, V/V/V)
as mobile phase. The compound was eluted at a flow rate of 1 ml/min. For detection of the
pregabalin 210 nm wavelength was set. Linearity range of the method was 0.75-6.00 μg/ml.
Jadhav S84 et al
reported a enantio selective high performance liquid chromatographic
method, with precolumn derivitization with marfey’s chiral reagent, sodium
2,4-dinitro-5-fluorophenyl-L-alamine amide for resolution of the enantiomers of a new anti epileptic drug,
pregabalin, in the bulk drug. The separation was accomplished using a reversed phase ODS
phase. The linearity range of the method was 750 to 7,500 ng/l. Recovery of R enantiomer
from bulk drug samples of pregabalin ranged from 97.5 to 101.76%.
Armagan Ona85et al developed two spectrofluorimetric and spectrophotometric methods for
determination of pregabalin in bulk drug and capsule. Pregabalin react with
7-chloro-4-nitrobenzofurazon which is highly sensitive fluorogenic and chromogenic reagent used in
many investigations. The relation between the absorbance at 460 nm and the concentration is
rectilinear over the range 0.5–7.0 µg mL−1
. Measurement was also made
spectrofluorimetrically at 558 nm after excitation at 460 nm. The fluorescence intensity was
directly proportional to the concentration over the range 40–400 ng/ml. The mean recovery
for the commercial capsules was 99.93% and 99.96% for spectrophotometric and
spectrofluorimetric study, respectively.
Onal Armagan86 et al
reported three methods for the spectrophotometric determination of
pregabalin in pharmaceutical preparations. Two methods are based on the reaction of
pregabalin as n-electron donors with 2, 3-dichloro -5,6-dicyano-1,4-benzoquinone(DDQ) and
7,7,8,8 tetra cyanoquinodimethane (TCNQ) as π-acceptor to give highly colored complex
species which were quantitated spectrophotometrically. The third method is based on the
interaction of ninhydrin with primary amine present in the pregabalin. The reaction product
was measured spectrophotometrically at 495 nm, 841 nm, and 573 nm respectively. The
linearity ranges of the three methods were 2.0-3.0 g/ml, 1.5-10 g/ml, and 40.0-180.0 μg/ml.
respectively.
Vermeij TAC87et al
presented a HPLC method for the simultaneous determination of the γ
-amino-n-butyric acid (GABA) derivatives, pregabalin, gabapentin and vigabatrin in human
serum by HPLC. Serum is deproteinized with trichloroacetic acid and aliquots of the
supernatant are precolumn derivatized with o-phtaldialdehyde (OPA) and
achieved on an Alltima 3C18 column using isocratic elution. The method is linear up to at
least 63 mg/l for PGB, 40 mg/l for GBP and 62 mg/l for VGB.
Berry88 et aldeveloped a HPLC method for assay of the new antiepileptic drug pregabalin in
serum/plasma. Acetone precipitation of the drug was carried out and derivitized with picryl
sulfonic acid (PSA) before chromatography on C8 column. The linearity range of the method
was 2.8-8.2 mg/L at steady state.
Vermeij TAC89 et al
developed a method for the simultaneous determination of seven
antiepileptic drugs, including primidone, Phenobarbital, phenytoin, carbamazepine,
lamotrigine, hydroxycarbazepine and zonisamide in serum by HPLC-diode array detector
(DAD). Separation is achieved on an Alltima 3C18 analytical column using isocratic elution
with a mixture of acetonitrile, methanol and phosphate buffer at 45 °C as mobile phase.
Rajinder Singh Gujral90et al
developed a spectrophotometric method for determination of
pregabalin in bulk, formulations and in human urine samples. The method is based on the
reaction of drug with the mixture of potassium iodate and potassium iodide and the
absorbance was measured at 353 nm.
Hesam Salem91 studied the charge transfer reaction of pregabalin as n-electron donor with
various π-acceptors: 7,7,8,8-tetracyanoquinodimethane (TCNQ),
2,3-dichlore-5,6-dicyano-1,4-benzoquinone (DDQ), 2,5-dichloro-3,6-dihydroxy-1,4benzoquinone and
2,3,5,6-tetrchloro-1,4-benzoquinone. Different colored charge-transfer complexes were obtained
which are utilized in the development of spectrophotometric methods for the analysis of
pregabalin in pure form as well as formulations. The linearity range of the method was 8-400
µg/ml. The recovery percentages of the method ranged from 100.19±0.83 to100.50±0.53.
Uttam Mandal92 et al developed a bioanalytical method for determination of pregabalin in
by an LC-MS-MS method using gabapentin as internal standard. Separation was achieved on
a Gemini C18 50 mm · 2.0 mm (3 lm) column with an isocratic mobile phase consisting of
methanol–water (98:2, v/v) with 0.5% v/v formic acid. Protonated ions formed by a turbo
ionspray in positive mode were used to detect analyte and internal standard. The MS-MS
detection was by monitoring the fragmentation of 160 55.1 (m/z) for pregabalin and 172.2
67.1 (m/z) for gabapentin on a triple quadrupole mass spectrometer.
Vaidya V93 et al
developed a method to quantify pregabalin in human plasma using
metaxalone as the internal standard. Sample preparation involved simple protein precipitation
by using acetonitrile as solvent. Chromatography was performed isocratically on thermo
hypurity C18 5 μm analytical column. The assay of pregabalin was linear calibration curve
over the range 10.000–10000.000 ng/ml.
Rasha Abdel94 et al developed three spectrofluorimetric and spectrophotometric methods for
the determination of pregabalin. Pregabalin as a primary amine reacts with fluorescamine to
yield a fluorescent product, with 2,4-dinitrofluorobenzene and
2,3,5,6-tetrachloro-1,4-benzoquinone in aqueous alkaline buffered media to form colored products which could be
measured spectrophotometrically. The optimum conditions for each reaction were ascertained
and the methods were applied for the determination of pregabalin over the concentration
range of 20-280 ng/ml and 1 – 7 µg/ml for spectrofluorimetry and spectrophotometry
respectively with good correlation (≥0.999).
Kannapan N95 et al
developed a RP-HPLC method for determination of pregabalin and
methylcobalamine combined in capsule dosage form. Separation was achieved isocratically
using Waters allaiance 2695 seperation module, C18 column (250 х 4.6 mm, 5mcg/ml) at
temperature 40°C. Flow rate selected was 1ml/min using UV visible PDA detector at 210 nm.
Mobile phase was prepared using ammonium dihydrogen-o-phosphate (buffer 6.0),
The method was found to be linear in the range of 3200-4800 mcg/ml and 16-24 mcg/ml for
pregabalin and methylcobalamine.
Rajinder Singh Gujral96 et al developed a UV spectrophotometric method for the
determination of pregabalin in bulk, pharmaceutical formulations and in human urine
samples. The method was linear in the range of 0.5–5.0 µg/ml. The absorbance was measured
at 210 nm.
ZOLPIDEM
Hempel G97et al
reported a method for the determination of zolpidem and its main
metabo-lites in urine without extraction using capillary electrophoresis with UV laser-induced
fluo-rescence detection with a He-Cd laser. The separation is carried out within 10 min, and the
limit of detection is 2 ng/ml.
Bhatt J98et al
developed a method for quantification of zolpidem in human plasma using
liq-uid chromatography-electrospray ionization tandem mass spectrometry (LC-ESI MS/MS).
Es-citalopram was used as an internal standard. Zolpidem and internal standard in plasma
sample was extracted using solid-phase extraction cartridge. The samples were injected into a
C8 reversed-phase column and the mobile phase used was acetonitrile-ammonium acetate
(pH 4.6; 10 mm) (80:20, v/v) at a flow rate of 0.7 ml/min. Using MS/MS in the selected
reac-tion-monitoring (SRM) mode, zolpidem and Es-citalopram were detected without any
inter-ference from human plasma matrix. The proposed method was validated in the linear range
2.5-300 ng/ml.
Keller T99et al reported a method for analysing and determining the zolpidem concentration
in post-mortem specimens by GC-MS method. Quantitation of zolpidem was performed by
ethyl acetate extraction from alkalinized body fluids before GC/MS analysis. The analyses
Stanke F100 et al
developed a method for the simultaneous determination of zolpidem and
zopiclone in human plasma. After a liquid-liquid extraction, the extract is injected into a
capillary gas chromatograph with an OV-1 fused-silica column coupled to a
nitrogen-phosphorus detector. The detection limits are 1 and 2 ng/ml for zolpidem and zopiclone,
respectively.
Debruyne. D101et al
developed a gas chromatographic method using a short, high-resolution
capillary column connected to a specific thermionic detector and requiring a simple and short
extraction step without evaporation was developed for the rapid and precise determination of
zolpidem and zopiclone in serum. The linearity range was between 5 and 200 ng/ml. The
method was validated and then used to analyze zolpidem serum concentrations in nine rabbits
after oral administration of 0.5 mg/kg and zopiclone serum concentrations in six patients
treated orally with a 7.5-g dose.
Nirogi RVS102 et al
developed a HPLC method with fluorescence detection for quantitation
of zolpidem in human plasma. Following a single-step liquid–liquid extraction, the analyte
and internal standard (quinine) were separated using an isocratic mobile phase on a
reversed-phase C18 column. The linearity range of the method was 1.8–288 ng/ml.
Laviana L103 et al
reported a HPLC assay with diode-array detection for the in-process
control of zolpidem synthesis and for the analysis of the drug and its synthetic intermediates.
The separation was achieved by reversed-phase Kromasil C-18 (150 mm) column.
Acetonitrile and 0.02 M NH4OAc adjusted to pH 8.0 was used as mobile phase with flow rate
1.0 ml/min.
Ptacek P104et al
developed a method for the determination of zolpidem in human plasma by
HPLC. This method involves protein precipitation with methanol and reversed-phase
chromatography with fluorescence detection (excitation wavelength 244 nm, emission
used as the mobile phase in the ratio of 30:69:1 and the calibration curve is linear up to 400
ng/ml.
Qiao Wang105 et al
a single-solvent extraction step high-performance liquid chromatographic
method for quantitation of zolpidem in rat serum. The separation was achieved by 2.1 mm
I.D. reversed-phase OD-5-100 C18 column, 5 µm particle size with an isocratic mobile phase
consisting of methanol–acetonitrile– tetrabutyl ammonium phosphate (13:10:77, v/v/v).
Ultraviolet detector was operated at 240 nm. The recovery was greater than 87% with
analysis performed in 12 min.
El Zeany BA106et al
reported two methods for the determination of zolpidem hemitartrate in
presence of its degradation product. The first method was a TLC-UV densitometric one in
which the mobile phase methanol: water (20:80) was used for developing the TLC plates.
Linearity range was 0.5-4 microg/spot with mean recovery percentage (99.98+/-0.988) %.
The second method was an HPLC method. HPLC was performed on a bondapack C18
column. The mobile phase was composed of a mixture of acetonitrile-0.01 M KH2PO4
(40:60). The pH was adjusted to 3.5+/-0.1. Flow rate was 1.2 ml/min. The linearity range was
0.5-5 µg/ml with UV detection at 245 nm.
Ring PR107
, et al developed a HPLC method for the determination of zolpidem in human
plasma. Zolpidem and the trazodone (internal standard) were extracted from human plasma.
Separation was achieved on a C18 column (150 x 4.6 mm, 5microm) with a mobile phase
composed of acetonitrile: 50 mM potassium phosphate monobasic at pH 6.0 (4:6 v/v)
Detection was by fluorescence, with excitation at 254 nm and emission at 400 nm. The
linearity range 1-400 ng/ml for zolpidem in human plasma.
Rajiv Chomwal108 et al
developed four spectrophotometric methods for estimation of
respectively. The linearity ranges of four methods were 5-30 µg/ml, 5-30 µg/ml, 10-50 µg/ml
and 5-40 µg/ml respectively. Absorbance maxima measured at 407 nm, 417 nm, 412 nm and
415 nm respectively.
Patil KS109et al
reported a spectrophotometric method for estimation of Zolpidem tartrate in
bulk and pharmaceutical dosage forms. Zolpidem tartrate shows maximum absorbance at
238.5. Beer’s law was obeyed in the concentration range of 2-16 µg/ml. The limit of detection
and limit of quantification were found to be 0.038152 µg/ml and 0.114577 µg/ml
respectively.
REAGENTS
NQS REAGENT
Mahmoud AM110 et al developed a spectrophotometric and spectrofluorimetric method for
the determination of amantadine hydrochloride (AMD) in capsules and plasma. The methods
were based on the condensation of AMD with 1, 2-naphthoquinone-4-sulphonate (NQS) in an
alkaline medium to form an orange-colored product. The spectrophotometric method
involved the measurement of the colored product at 460 nm. The spectrofluorimetric method
involved the reduction of the product with potassium borohydride, and the subsequent
measurement of the formed fluorescent reduced AMD-NQS product at 382 nm after
excitation at 293 nm. Linearity ranges were 5–80 and 0.05–10 µg/ml for the
spectrophotometric and spectrofluorimetric methods, respectively.
Huai You Wang111 et al
developed a spectrophotometric method for determination of
dapsone. The dapsone reacts with sodium 1, 2-naphthoquinone-4-sulfonic in pH 6.98 buffer
solution to form a salmon pink compound, and its maximum absorption wavelength is at 525
nm. The linearity range was 0.40 to 10 µg/ml.
Abdel Razak O112 et al developed a method for spectrophotometric and polarographic
determination of enalapril and lisinopril using 2, 4-dinitrofluorobenzene. The reaction of
enalapril maleate and lisinopril with 2,4-dinitrofluorobenzene has been used to form colored
products and polarographically active derivatives. The different experimental conditions have
been optimized.
MBTH REAGENT AND PARACHLORANILIC ACID
Alfaraj NA113 et al
developed spectrophotometric methods for the determination of
mefenamic acid. The first method is based on the reaction of mefenamic acid as N-donor with
p-chloranilic acid as a π-acceptor. A red colour product shows peak at 520 nm and its absorbance is linear with concentration over the range 10-300 µg/mL. The second method is based on the formation of an oxidative coupling product by the reaction of mefenamic acid
with 3-methylbenzo-thiazolin-2-one hydrazone as a chromogenic reagent in presence of ferric
chloride solution. A green colour product shows peak at 602 nm and its absorbance is linear
with concentration over the range 1-6 µg/ml.
Manish majumder114et al
developed a visible spectrophotometric method for the estimation
of tinofovir in bulk and in pharmaceutical preparations. Tinofovir was subjected to acid
hydrolysis and this acid hydrolyzed drug was used for the estimation. This method is based
on the reaction with 3-methyl-2-benzothiazolinone hydrazone in the presence of ferric
chloride, to form a colored species with a λmax at 628.5 nm. Beer’s law is obeyed in the
concentration range of 5-40 µg/ml.
GIBB’S REAGENT
Chilukuri sastry SP115 et al reported two visible spectrophotometric methods for the assay of
3-methyl-2-the formed colored species was detected at 410 nm. Second method based on reaction of
cefadroxil with 2,6-dichloroquinone-4-chlorimideand the formed colored species was
detected at 620 nm. Beer’s law was obeyed in the concentration range of 1.0-6.0 and 1.0-6.0
µg/ml for first and second methods respectively.
BM REAGENT
Gurupadayya BM116et al developed a method for the quantitative estimation of pramipexole
dihydrochloride drug and its formulations (Tablets). This method was based on the
diazotization of primary amine group of pramipexole with sodium nitrate and hydrochloric
acid followed by coupling with N-(1-napthyl) ethylene diamine hydrochloride (BM reagent)
to form a colored chromogen with a characteristic absorption maximum at 616 nm. Beer’s
law is obeyed in concentrations ranging of 4-20 µg/ml.
2,4-DNP REAGENT
Padmarajaiah Nagaraja117 et al
developed a spectrophotometric method for the
determination of four phenolic drugs; salbutamol, ritodrine, amoxicillin and isoxsuprine. The
method is based on the oxidation of 2, 4- Dinitrophenylhydrazine and coupling of the
oxidized product with drugs to give intensely colored chromogen. Under the proposed
optimum condition, Beer’s law was obeyed in the concentration range of 2.5-17, 2-29, 4-33
OBJECTIVES
The primary objective of the proposed work was to
Develop new, simple, sensitive, accurate, and economical spectrophotometric
methods for the estimation of CNS acting drugs.
Develop new, sensitive, accurate and economical gas chromatography methods for
estimation of CNS acting drugs.
Validate the developed methods and apply them for estimation of commercially
available formulations.
Pregabalin and zolpidem are the drugs belonging to CNS category which are used
against epilepsy and insomnia respectively. Pregabalin is an anticonvulsant drug used for
neuropathic pain and as an adjunct therapy for partial seizures with or without secondary
generalization in adults. Zolpidem is a prescription medication used for the short-term
hypnotic that potentiates gamma-amino butyric acid (GABA), an inhibitory neurotransmitter
by binding to GABAA receptors at the same location as benzodiazepines.
Literature survey reveals that very few methods have been developed for pregabalin
and zolpidem. In the present investigation made attempts to develop some new
spectrophotometric methods and chromatographic methods for pregabalin and zolpidem,
which are highly sensitive, accurate, precise and economical. Since very few analytical
methods have been reported for the quantitative estimation of these drugs its necessary for the
investigation of new analytical methods for estimation of pregabalin and zolpidem in bulk
drugs and pharmaceutical formulations.
Validation of the methods was carried out in accordance with ICH guideline for the
assay of active ingredients. The method was validated for parameters like accuracy, linearity,
precision, specificity, system suitability.
The primary objective of validation in the analysis of a drug is to design and develop
methods preferably instrumental ones such as UV spectrophotometric / GC that are sensitive
MATERIALS AND METHODS
PART A:
UV-VISIBLE SPECTROPHOTOMETRIC METHODS FOR PREGABALIN
METHOD 1: Estimation of pregabalin by NQS reagent
METHOD 2: Estimation of pregabalin by Sanger’s reagent
METHOD 3: Estimation of pregabalin by MBTH reagent
METHOD 6: Estimation of pregabalin by 2, 4-DNP reagent
UV-VISIBLE SPECTROPHOTOMETRIC METHODS FOR ZOLPIDEM
METHOD 7: Estimation of zolpidem by MBTH reagent
METHOD 8: Estimation of zolpidem by 2, 4-DNP
METHOD 9: Estimation of zolpidem by p-CA reagent
PART B:
GAS CHROMATOGRAPHY METHOD
METHOD 10: Derivatization of pregabalin by Gas chromatography
METHOD 11: Derivatization of zolpidem by Gas chromatography