Suspended Solids In Stormwater Runoff From Various Urban Surfaces
Introduction
Stormwater runoff from urban areas has long been identified as being a significant cause of poor water quality in creeks and rivers. Pollutants washed off urban surfaces include sediments, litter, organic matter, nutrients, heavy metals, oils and pesticides.
This study focused on suspended solids, in particular Non-Coarse Particles (NCP) less than
500 μm in size. Particles that remain suspended in water reduces clarity and impacts on aquatic ecosystems. Nutrients, such as phosphorus, are bound to particles and are a major factor in algal blooms.
The study was undertaken as part of PhD research at the USQ Faculty of Engineering and Surveying. The purpose of the study was to measure the amount of NCP washed off various types of urban surfaces during storms. This work will assist in identifying the dominant sources of pollution in urban catchments and assist in
providing more effective stormwater management.
Overview
Measurements of the NCP load washed from five different urban surfaces during storms were made from December 2004 to June 2005. Impervious surfaces (a roof, carpark and a road) were monitored in addition to pervious surfaces (grassed and bare soil areas).
The road had the highest NCP load/m2 for small-to-moderate storms less than 20mm rainfall. This outcome is significant as many adverse
environmental impacts are caused by urban runoff from these more frequent events.
No runoff occurred from the pervious surfaces in the storms less than 15 to 20mm due to
infiltration, except for a single high intensity event. At higher rainfalls, the bare soil loads were significant.
How were the surfaces monitored?
Selected Surfaces
Stormwater runoff was monitored for five different types of urban surface. The surfaces included a galvanized iron roof, a concrete carpark, an asphalt roadway, a grassed area turfed with couch and an exposed area of bare kraznozem soil.
All monitoring sites were located close together within inner city Toowoomba. The surface areas that were monitored ranged from 50 to 450m2.
Site Monitoring
The objective of the study was to quantify the amount of NCP, or load, washed from each
surface during a number of storms. At each site, a flow-weighted composite sample of runoff was collected to determine the Event Mean Concentration. NCP loads were estimated by
multiplying the EMC and runoff volume for each storm event.
In order to reliably obtain a composite sample for these small catchments, a new type of sampling device was designed and tested as part of the study. Referred to as the flow splitter, the device is shown below in Figure 1.
A
[image:1.612.350.575.476.656.2]B
A flow splitter was installed at each of the five sites and a typical installation is shown in Figure 2. A tipping-bucket raingauge was used to measure rainfall depths at 0.25mm increments. This data was recorded by a datalogger and routinely downloaded during the monitoring period.
[image:2.612.81.306.190.360.2]\\
Figure 2 showing roof sampler. Flow from roof gutter [A] is screened [B] to remove debris and directed to the flow splitter which is housed in a locked box [C]
Laboratory Analysis
After each storm, the runoff samples were collected and analyzed to determine the NCP concentration in mg/L. This required a new laboratory technique adapted from the Suspended Sediment Concentration (SSC Method) used by the US Geological Survey.
The laboratory approach provided a breakdown of NCP into three particle size ranges: Very Fine Particles (VFP) less than 8μm in size, Fine Particles (FP) between 8 to 63 μm and Medium Particles between 63 to 500 μm.
This breakdown was performed as washoff behavior, stormwater treatment and contaminant associations such as adsorption of heavy metals are closely allied to particle size.
Monitoring Period
This report will outline results for the period from December 2004 to June 2005. The monitoring work is ongoing.
A total rainfall of 370mm was recorded at the monitoring site for the December 2004 to June 2005 period. Data was collected for 24 storms with rainfalls ranging from 2.5mm to 48.5mm. Sample volumes of the order of 80L were obtained for analysis in some storm events. Figure 3 shows typical samples from the impervious surfaces.
A
B
C
Figure 3 shows samples taken, from left to right, the road, carpark and roof surfaces for a 24mm rainfall event
On average, Toowoomba receives an annual rainfall of 950mm typically over 103 raindays. The monitoring work was conducted under drier than average conditions.
Load Computation
The sample volume that was captured provided a measure of the amount of runoff that was
generated from each surface. This measurement was used to check estimates of runoff volume predicted by a hydrological model of the surface. The urban drainage model, DRAINS, was used for this runoff estimation.
[image:2.612.350.575.210.379.2]What were the results?
Runoff Characteristics
The sites included the impervious road, carpark and roof surfaces and the pervious grassed and bare soil areas. As expected, the runoff
characteristics of the pervious surfaces were very different due to infiltration of rainfall into the soil.
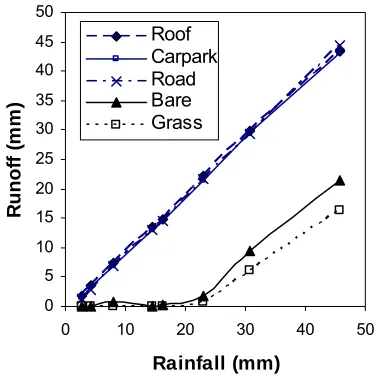
Runoff was generated from the impervious surfaces when rainfall exceeded only 1mm depth. As shown in Figure 4, generally 15 to 20mm of rainfall soaked into the ground before runoff occurred from the grass and bare soil plots (an exception being the bare soil yielding minor runoff during an 8mm storm having a very high intensity of 40 mm/hr).
This infiltration effect is a significant factor in determining the NCP load that is generated from pervious surfaces. Pervious runoff occurred during less than 20% of storms within the monitoring period.
0 5 10 15 20 25 30 35 40 45 50
0 10 20 30 40 50
Rainfall (mm)
Ru
n
o
ff (m
m
)
[image:3.612.371.532.212.418.2]Roof Carpark Road Bare Grass
Figure 4 shows the mean runoff that is produced from each surface type in response to rainfall.
Event Mean Concentrations
Box-plots of particle EMCs are presented as Figure 5 and show the median, minimum (min), maximum (max), first quartile or 25 percentile (q1)
and third quartile or 75 percentile (q3) concentrations that were measured.
The box-plots indicate that each surface exhibits a significant variation in EMC, typically a 10 to 100-fold difference between minimum and maximum values.
0.1 1 10 100 1000 10000
Ro of
Ca rpar
k Ro
ad
Grass Ba re
No
n
-Co
a
rs
e
E
M
C
(m
g
/L
)
[image:3.612.103.291.402.590.2]q1 min median max q3
Figure 5 shows box-plots of NCP EMCs for each type of surface for December 2004 to June 2005.
Median NCP EMCs for impervious surfaces varied from 10 mg/L for the roof, 45 mg/L for the carpark, increasing to 255 mg/L for the road surface. On the limited occasions that grass runoff occurred, the resulting EMCs were similar to carpark runoff. Bare soil EMCs were significantly higher (median 740 mg/L).
Particle Size and Composition
Particle mass for all surfaces was mainly
inorganic. For the road and bare soil surfaces, the median inorganic content was approximately 75%. The runoff from the other surfaces had more organic matter, with the median inorganic content falling in the 60 to 65% range.
Median NCP Loads
Median values of NCP loads are provided below for each surface. Note that there is considerable variation in the magnitude of the load generated by each surface for different storms.
Table 1 Median NCP Load (in mg/m2/storm)
Roof 90
Carpark 500
Road 1500
Grass 500
Bare 3700
The above table provides only a simplistic indication of the relative amounts of NCP washed off the various surfaces. The fact that runoff doesn’t generally occur from pervious surfaces in storms less than 20mm rainfall should be taken into account. This aspect is discussed below.
NCP Loads Depend on Rainfall and Runoff
Particle loads vary between surfaces from storm to storm depending on a number of factors. Storm characteristics, such as rainfall depth, intensity and duration, all influence the amount of particles washed off. The study also found that the rainfall depth in the previous storm (the antecedent rainfall) also influences particle washoff, particularly for the road surface. On this basis, any comparison of the NCP loads generated based on surface type should be made over a number of storm events.
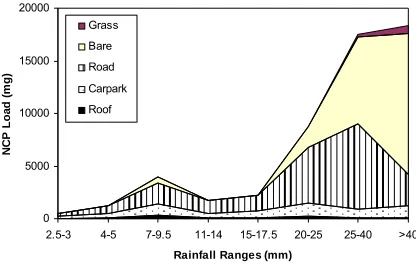
[image:4.612.359.567.190.322.2]Such a comparison was made for the five surface types for the 24 storms that were monitored from December 2004 to June 2005. NCP load estimates were grouped according to various rainfall ranges and averaged. The average values are plotted as a stacked graph in Figure 6 against the rainfall ranges.
Figure 6 shows the load that 1m2 of each surface type generates, on average, for the storms that occurred during December 2004 to June 2005 plotted against various rainfall ranges.
0 5000 10000 15000 20000
2.5-3 4-5 7-9.5 11-14 15-17.5 20-25 25-40 >40
Rainfall Ranges (mm)
NC
P
L
o
a
d
(m
g
)
Grass
Bare Road
Carpark Roof
Figure 6 NCP Load in mg against rainfall ranges. This is based on 1m2 of each surface.
It is clear from Figure 6 that, on a per square metre basis, the NCP load contributed by the roof is negligible. Carpark loads are moderate and less significant compared to the road loads. The bare soil produced a high load for rainfalls exceeding 15 to 20mm and, with the road surface, was the dominant contributor to NCP loadings. The grass surface contributed relatively small loads at rainfalls exceeding 25mm.
0% 10% 20% 30% 40% 50% 60% 70% 80% 90% 100%
2.5-3 4-5 7-9.5 11-14 15-17.5 20-25 25-40 >40
Rainfall Range (mm)
N
C
P
Loa
d (%
of tot
a
l)
Grass
Bare
Road
Carpark
[image:5.612.359.558.117.233.2]Roof
Figure 7 NCP Load as percentage of total against rainfall ranges.
It should be noted that the comparison is based on equal areas (in this case 1m2) of each surface type. In reality, an urban catchment would consist of unequal proportions of each surface which would change the results. Initial analysis using typical surface compositions found in residential areas suggest that the broad trends discussed above may also be applicable to urban
catchments in general. The next phase of the study will investigate ways that the surface data can be applied to represent various urban landuses.
It should also be noted that the comparison has been made for the historical sequence of storms that occurred during the monitoring period. The results may change if a different mix of storms is used in the analysis.
Cumulative NCP Loads
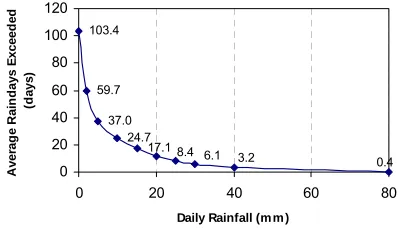
As shown in Figure 8, minor rainfalls occur in Toowoomba on a more frequent basis than larger storms. On average, daily rainfalls in excess of 40mm occur on only 3 raindays throughout the year compared with 37 raindays for rainfalls less than 5mm.
103.4
59.7
37.0 17.1
3.2 0.4
6.1 24.7
8.4
0 20 40 60 80 100 120
0 20 40 60 80
Daily Rainfall (m m )
A
ve
ra
g
e R
a
in
d
a
ys
E
x
cee
d
ed
(d
ay
[image:5.612.97.318.136.259.2]s)
Figure 8 shows a plot of average raindays exceeded during a year against daily rainfall based on Toowoomba rainfall data from 1980 to 2003.
Due to their more frequent occurrence, the loads associated with small storms, when totaled, may represent a sizable portion of the load generated during a year or a season. The cumulative load defined as the sum of loads for a number of storm events thus provides a useful basis to compare the various surfaces.
On this basis, the cumulative loads from each surface were calculated for the 24 storms that occurred during the monitoring period. To provide a relative context, the cumulative load for each surface was presented as a ratio of the roof load. This analysis was also done for the runoff volumes and the results are compiled as Table 2.
Table 2 Cumulative loads and runoff volumes from each surface for December 2004 to June 2005 storms, expressed as a ratio of the roof estimates
Surface Cumulative Cumulative
Runoff NCP Load
Roof 1.0 1.0
Carpark 0.98 5.1 Road 0.98 16.6 Grassed 0.14 0.6 Bare soil 0.20 14.6
[image:5.612.355.547.527.610.2]associated with significantly less runoff. Grass NCP load was relatively minor (0.6x). All of these loads are on a per m2 basis.
Small-to-Moderate Storms
It is becoming more recognized that the runoff from the more frequent storms (generally less than 15 to 20mm) is a major cause of environmental impact to downstream waterways. Urban
development leads to a substantial increase in the frequency of these ‘small-to-moderate’ runoff events, which in undeveloped catchments may be absent due to infiltration. The flows and pollution associated with these events can lead to a wide range of impacts, including channel erosion, reduced biodiversity, more variable water
temperatures and poor water quality (Walsh et al, 2004).
On this basis, the NCP loads generated from urban surfaces in small-to-moderate storms are of particular interest. On a per m2 basis, the road surface generated the highest NCP load in the less than 20mm rainfalls and is thus likely to be an important contributor to adverse environmental effects. Road drainage is also generally efficient in conveying stormwater directly to waterways which increases the impact potential.
Further Research
This study has investigated the washoff of suspended particles (NCP) from various urban surfaces. NCP is a general indicator of pollution and the research should be extended to
incorporate other types of pollutants. These pollutants should include nutrients, heavy metals and pathogens.
The work is also based on the monitoring of small-scale catchments each representing a single type of surface. In reality, urban catchments consist of a mosaic of surfaces and monitoring of larger scale catchments should be performed to confirm the initial findings of this study.
References Cited
Walsh, C.J., Leonard, A.W. Ladson, A.R.,
Fletcher, T.D. Urban Stormwater and the Ecology of Streams. CRC for Freshwater Ecology and CRC for Catchment Hydrology, 2004
Acknowledgement
USQ would like to thank the Condamine Alliance for contributing funds to the development and installation of samplers used in this study.
Information
For more information on this study, contact:
Ian Brodie
![Figure 1 showing the flow splitter [A] which collects a constant proportion of runoff and directs the sample to a plastic storage container [B]](https://thumb-us.123doks.com/thumbv2/123dok_us/319992.63997/1.612.350.575.476.656/figure-showing-splitter-collects-constant-proportion-directs-container.webp)
![Figure 2 showing roof sampler. Flow from roof gutter [A] is screened [B] to remove debris and directed to the flow splitter which is housed in a](https://thumb-us.123doks.com/thumbv2/123dok_us/319992.63997/2.612.350.575.210.379/figure-showing-sampler-gutter-screened-remove-directed-splitter.webp)