University of Southern Queensland
Faculty of Engineering and Surveying
Historical Identification and Mapping
A dissertation submitted by
Mario de la Pena
In fulfilment of the requirements of
Courses ENG4111 and ENG4112 Research Project
Towards the degree of
Bachelor of Surveying
ABSTRACT
This project was set out to design a method of capturing and cataloguing historical data to produce a Geographic Information System (GIS) map of a portion of the Old Ballaarat Cemetery. The research project was undertaken due to the lack of digital information on historical features in Ballarat.
The completion of the GIS map was achieved using a Total Station for survey control and data collection and a hand held Global Positioning System (GPS) unit to capture and catalogue the data in the cemetery, in addition a GIS was used to store and map the
captured data. The mapped data was transferred onto a web page that is able to be updated with new information from other cemeteries for the formation of an Australia wide
database in the future.
DISCLAIMER
University of Southern Queensland
Faculty of Engineering and Surveying
ENG4111 & ENG4112
Research Project
Limitations of Use
The Council of the University of Southern Queensland, its Faculty of Engineering and Surveying, and the staff of the University of Southern Queensland, do not accept any responsibility for the truth, accuracy or completeness of material contained within or associated with this dissertation.
Persons using all or any part of this material do so at their own risk, and not at the risk of the Council of the University of Southern Queensland, its Faculty of Engineering and Surveying or the staff of the University of Southern Queensland.
This dissertation reports an educational exercise and has no purpose or validity beyond this exercise. The sole purpose of the course pair entitled "Research Project" is to contribute to the overall education within the student’s chosen degree program. This document, the associated hardware, software, drawings, and other material set out in the associated appendices should not be used for any other purpose: if they are so used, it is entirely at the risk of the user.
Prof G Baker Dean
ACKNOWLEDGEMENTS
This research was carried out under the principal supervision of Associate Professor Frank Young (Head of Department) Faculty of Surveying, The University of Southern
Queensland. Frank was instrumental in completing this dissertation through his guidance and knowledge in the area of GIS.
Appreciation is also due to Mr. Brian Marsh (GIS Officer, City of Ballarat) who assisted me with the process of capturing data, processing the information, analysing the results and mapping the information into the GIS system.
The City of Ballarat and Mr. David.C.Beames (Ballarat Cemetery Manager) who gave me permission to enter the cemetery along with information on the entombment’s from their records.
I would also like to show gratitude to my work colleague Russell Brookes for assisting me with the traversing and secondly my cousin Marcial Cano-Perez for helping collect the grave plots using the Total Station and taking some of the digital photos of the cemetery plots.
Last of all I would like to acknowledge the support of my wife Emma and three children who helped me achieve this goal and supported me all the way. Thank you.
TABLE OF CONTENTS
ABSTRACT ... i
DISCLAIMER ... ii
CERTIFICATION ...iii
ACKNOWLEDGEMENTS ... iv
TABLE OF CONTENTS ... v
LIST OF FIGURES...viii
LIST OF TABLES... x
GLOSSARY OF TERMS ... xi
CHAPTER 1 – INTRODUCTION... 1
1.1 Outline and Background of Study ... 1
1.2 Historical information ... 2
1.3 The Problem ... 2
1.4 Research Objectives... 3
1.5 Conclusion... 3
CHAPTER 2 – LITERATURE AND EQUIPMENT REVIEW ... 5
2.1 Previous cemetery surveys... 5
2.2 GPS... 6
2.2.1 GPS Options ... 6
2.2.2 Comparison of hand held GPS units ... 7
2.2.3 Errors and Inaccuracies using GPS... 8
2.3 Total Station ... 9
2.3.1 Total Station Options ... 9
2.3.2 Comparison of Total Station Options ... 10
2.3.3 Accuracy range of Total Stations... 12
2.4 Mapping ... 12
2.6 Further research... 15
2.7 Conclusions... 15
CHAPTER 3 – METHODOLOGY ... 17
3.1 Study Area ... 17
3.2 Total Station (ground coordinates and data collection)... 18
3.2.1 Investigation of Survey marks ... 19
3.2.2 Traversing and collecting data in the Cemetery Site... 19
3.2.3 Reducing the Traverse and downloading collected data ... 21
3.2.4 Alternative methods of traversing and data collection... 23
3.3 Hand held GPS (planning a new project)... 24
3.3.1 Setting up the attribute table ... 24
3.3.2 Preparing for a new project... 25
3.3.3 Testing the Hand Held GPS data collector ... 26
3.4 Hand held GPS (capturing and cataloguing data) ... 26
3.4.1 Capturing the data ... 27
3.4.2 Cataloguing the data ... 28
3.5 GIS (Mapping the data)... 29
3.5.1 Mapping the data into a GIS ... 29
3.5.2 Cadastre, Metadata and Polygonisation ... 32
3.6 Web Page Design... 34
3.6.1 Design requirements and contents ... 34
3.6.2 Language used to create a web page ... 34
3.6.3 Creating the web page... 35
CHAPTER 4 – DATA ANALYSIS ... 37
4.1 Analysis of Traversed and Collected Data ... 37
4.2 Analysis of Captured Data ... 38
4.3 Analysis of Catalogued Data ... 43
4.4 Analysis of Mapped Data... 44
4.4.1 Cadastre Analysis ... 44
4.4.2 Attribute Analysis ... 45
4.5 Analysis of Web Page Design ... 45
CHAPTER 5 – CONCLUSIONS, DISCUSSIONS AND IMPLICATIONS... 49
5.1 Conclusions... 49
5.1.1 Control and data collection ... 49
5.1.2 Capturing and Cataloguing ... 49
5.1.3 Mapping... 50
5.1.4 Web Page ... 50
5.1.5 General... 50
5.2 Discussion... 51
5.2.1 Evolution of Project ... 51
5.2.2 Capturing and Cataloguing ... 51
5.2.3 Mapping... 52
5.2.4 Benefits and Limitations ... 52
5.3 Implications ... 53
5.3.1 Public perception ... 53
REFERENCES ... 54
LIST OF APPENDICES... i
Appendix A – Project Specification... iii
Appendix B – Traverse Information after compass adjustment...v
Appendix C – Part of raw data from feature survey ... vii
Appendix D – Spreadsheet listing attributes of each Grave Plot. ... ix
Appendix E – Stages of mapping data. ... xvi
Appendix F – Web page for grave plot search... xxii
LIST OF FIGURES
PAGE
Figure 2.1 Hand held GPS Units 8
Figure 2.2 Terrestrial Positioning Systems 11
Figure 2.3 A typical line graph 14
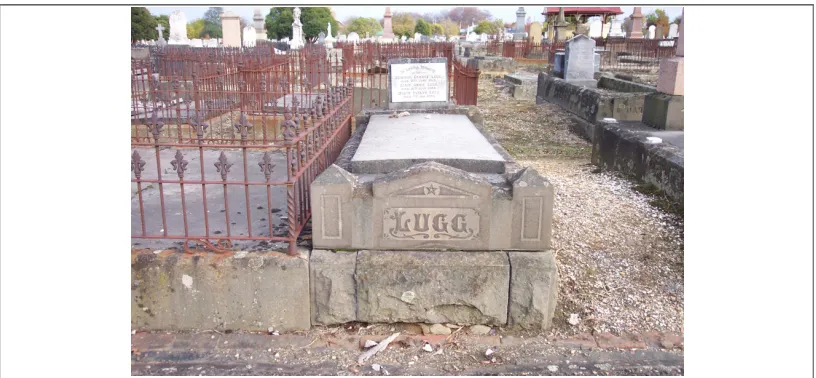
Figure 2.4 Grave Plot 16
Figure 3.1 Aerial Photo of the Old Ballaarat Cemetery Site 17
Figure 3.2 The Study area including the lake and surrounds 18
Figure 3.3 Cemetery plots produced in CivilCad 22
Figure 3.4 Collecting data using TPS 24
Figure 3.5 Capturing data using Hand Held GPS 28
Figure 3.6 Unadjusted Captured data overlayed on grave plots 30
Figure 3.7 Adjusted Captured data overlayed on grave plots 31
PAGE
Figure 4.1 Session 1 graphed maximum PDOP of grave plots 39
Figure 4.2 Session 2 graphed maximum PDOP of grave plots 39
Figure 4.3 Session 3 graphed maximum PDOP of grave plots 40
Figure 4.4 Session 1 graphed maximum HDOP of grave plots 40
Figure 4.5 Session 2 graphed maximum HDOP of grave plots 41
Figure 4.6 Session 3 graphed maximum HDOP of grave plots 41
Figure 4.7 Session 1 graphed Horizontal Precision of grave plots 42
Figure 4.8 Session 2 graphed Horizontal Precision of grave plots 42
LIST OF TABLES
PAGE
Table 2.1 – Data Analysis 15
Table 3.1 – Traverse information 20
Table 3.2 – Attributes 25
GLOSSARY OF TERMS
ACU – Attachable Controller UnitAGD – Australian Geocentric Datum
AHD – Australian Height Datum
AMG – Australian Map Grid
Bluetooth – A seamless wireless short-range communication of data and voice between both mobile and stationary devices.
DOS – Direct Operating System
DXF – Drawing Exchange Format
EGNOS – European Geostationary Navigation Overlay System
EDM – Electronic Distance Measuring device
GDA – Geocentric Datum of Australia
GDOP – Geometric Dilution of Precision
GIS – Geographic Information Systems
GPS – Global Positioning Systems
GRS – Geometric Reference Spheroid
HDOP – Horizontal Dilution of Precision
HTM – Hypertext Markup
HTML – Hypertext Markup Language
JAVAscript – Object-oriented programming that is embedded in a HTML file
MapInfo – GIS software used for Mapping
PC – Personal Computer
PCMCIA – Portable Computer Memory Card International Association
PDM – Professional Data Mapper
RMP – Reference Mark Pipe
RTK – Real Time Kinematic
SMES – Survey Mark Enquiry Service
SPSM – Standard permanent Survey Mark
SQL – Structured Query Language
SSM – Standard Survey Mark
TPS – Terrestrial Positioning Systems
TM – Trademark
UNESCO – United Nations Educational, Scientific, and Cultural Organization
UTM – Universal Transverse Mercator
USB Port – Universal Serial Bus Port
CHAPTER 1 – INTRODUCTION
Cemeteries hold a special place in cultures, they contain concrete reminders of those who lived
and shaped the landscapes which we inhabit. The headstones cemeteries contain and expose
artistic styles and techniques of prior generations and inscriptions hold a great deal of
historical information, allowing us to observe the health of an area, the impact of war on an
area, how wealthy a region was and to trace genealogical roots of historic family properties
among other uses. Cemeteries and the information they hold are some of the oldest
demographic information recorded. (Boston Parks and Recreation Department, The Boston Experience, 1989, pp.55).
1.1 Outline and Background of Study
Identification of historical features using mapping methods can benefit many interest groups and a convenient way of archiving information for future use. This identifies the need to capture and/or catalogue historical data to create information that is in a useable format. The information can be stored in a medium such as a GIS to manipulate and use for a particular purpose.
The study chosen was to map a portion of Old Ballaarat1 Cemetery so that there would be a permanent digital database and record of information pertaining to the people entombed in this cemetery. A web page was created to both hold the mapped information and act as a tool to be accessed by organisations or the public in a way that would benefit them.
The Old Ballaarat Cemetery was established in 1858 during the gold rush era and is one of the oldest cemeteries in Victoria. It holds approximately 35,000 entombments and is still in operation. Examples of historical figures and events which occurred in this era include Peter Lalor, leader of the Eureka Stockade Rebellion, who is entombed
1Note: When Ballarat was settled in the early 1850’s its name was spelt ‘Ballaarat’, from the aboriginal words ‘Balla’ ‘Arat’
in this location along with many miners and soldiers that fought against each other during this time. A separate area was designated for the Chinese population who made up a large proportion of the miners. The majority of the historical interest entombment’s occurred before 1885 and were made up mostly of soldiers and miner’s killed during the Eureka Stockade uprising.
This cemetery is of great historical significance and way of preserving this piece of history using modern technology can only be of benefit.
1.2 Historical information
There is an abundance of information regarding historical features in places such as museums, Local Government Offices and interest group organisations but the majority of it is only archived in hard copy form. In the advent of a robbery, fire or relocation of this information, it is possible that these records could be lost. There needs to be a method of archiving this information into digital format. This would allow accurate and reliable records on cemeteries for future use that can easily be copied onto a permanent database and kept by cemetery management. In recent times there has been attempts to do this but they were unstructured and mostly isolated to one theme such as information on entombments at the Old Ballaarat Cemetery. An effort should be made to further expand this in the future to information on entombments in Australian cemeteries. This is beyond the scope of this project and will be further discussed in section 2.6. This study will attempt to start of a piece of a puzzle that will be built on over time to create an Australian registry of information on cemeteries nationally.
1.3 The Problem
1.4 Research Objectives
The project aimed at determining the best method to capture, catalogue and map grave plots in a section of the Old Ballaarat Cemetery.
Achieving this required meeting a number of steps which included determining the best method to use in capturing, cataloguing and mapping cemetery data, evaluating the most appropriate equipment to use in performing a cemetery survey, creating a source of information about entombments in a cemetery and creating a web site to be able to access the information easily.
To complete the capturing and cataloguing traditional surveying methods and a hand held GPS were employed and in addition GIS, was used to produce a digital map of the cemetery. This was assessed against any other method available to complete the same project and the benefits and limitations of these methods were discussed and evaluated. The web design needed to follow a firm criteria to produce a user friendly and informative website.
The research methodology following the literature review was broken down into five parts with several sub parts. The main headings discussed included:
• Total Station (ground coordinates and data collection);
• Hand held GPS (setting up a new project);
• Hand held GPS (capturing and cataloguing data);
• GIS (Mapping the data); and
• Web page design.
The five headings mentioned formed the basis of this research project and there practices and principles are discussed in chapter three.
1.5 Conclusion
The outcomes are expected to demonstrate the most appropriate method of achieving the capturing, cataloguing and converting this data into useable information in a GIS system. The web design will draw all of the GIS information into one central web site to enable a user to access the cemetery information quickly and easily.
CHAPTER 2 – LITERATURE AND EQUIPMENT
REVIEW
The literature review will provide examples of capturing, cataloguing and mapping data in a cemetery site or other historical sites and examine the methods and equipment used to achieve this.
Advantages and disadvantages of current systems used, along with possible data sources will be sought out to design and develop the methodology that will be used to complete the project.
In order to fulfil the requirements of the research project it is necessary to find methods and practices used to complete the task efficiently and to ensure the information gathered would be of benefit to the general public.
2.1 Previous cemetery surveys
In reviewing relevant literature there were numerous examples found of this type of work but they were mainly surveys that were looking for remnants of old cemeteries with maybe ten to fifty people entombed in them. Sizer (1999) had an example of this work that demonstrated it as a location survey rather than on an individual gravesite by gravesite survey and most of the other examples were for identifying family cemeteries.
In comparison there were an abundance of surveys relating to boundary definition of a cemetery for local government use and location of historical features in an area of interest such as a cemetery. The authorities of the County of Boone (1998) conducted an individual gravesites survey but weren’t in depth enough and only presented a general outline of the process required to undertake this type of survey.
Information regarding mapping cemeteries was limited although the processes involved are similar for mapping projects such as mine sites, animal habitat studies and forestry.
2.2 GPS
Attempting a project of this magnitude required the use of equipment that was quick and reliable. GPS is one such tool that enables the user to capture and catalogue information at an efficient rate.
This section will examine types of GPS’ available in the market place, how two GPS models compare against each other and the errors and inaccuracies that can occur using a GPS during the capturing process.
2.2.1 GPS Options
There is a significant range of GPS’ available in the market place and selecting an appropriate system depends on the accuracy and requirements needed for a project. They range from small hand held devices used for camping and orienteering to the accurate models used for geodetic work.
Grimes (1999) suggested that if it were a search for a survey of a family cemetery the best method for pin pointing would be using GPS RTK methods. This method could also be adopted to accurately define the boundaries of the site.
Comparing the Leica GS20 and Trimble GeoXT GPS units would determine the which model would be used for the cemetery mapping project.
2.2.2 Comparison of hand held GPS units
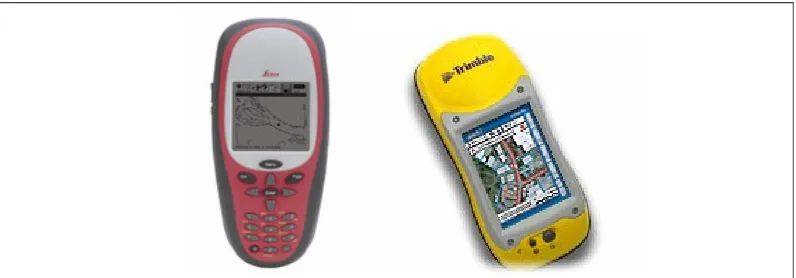
There are several hand held GPS units available on the market and for this exercise the comparison of two major brands were evaluated. The two brands are Trimble CE series and the Leica GS Series. The main features that are expected of the equipment are reliability, ease of use, applications for this type of project, accuracy, functionality and reliable software used for post processing.
a. Trimble
“Trimble GeoXT handheld, from the GeoExplorer series, combines sub-meter accuracy GPS with Microsoft Windows Mobile 2003 software for Pocket PCs in one rugged unit which allows you concentrate on what's important: collecting and maintaining high-quality data for your GIS”, (Trimble GeoXT datasheet available on www.trimble.com).
The main features of the Trimble hand held GPS are;
• Sub meter accuracy with integrated Wide Area Augmentation System (WAAS)/ European geostationary navigation overlay system (EGNOS);
• Real time correction support;
• EVEREST multipath rejection technology;
• Bluetooth wireless technology;
• Rugged and water resistant design;
• TerraSync software for data capture;
• GPS Pathfinder Office for post processing; and
• Touch screen for easy data entry.
b. Leica
and your PC. It has a flexible configuration, user-friendly interface and ergonomic design”, (Leica GS20datasheet available on www.lieca.com).
The main features of the Leica hand held GPS are;
• Sub meter accuracy;
• Easy to read graphical display on the fly;
• Geo Clipboard used to cut, copy and paste features;
• Bluetooth wireless technology;
• Rugged and water resistant design;
• Powerpage software for data capture;
• Leica software used for post processing; and
• Large keypad for easy data entry.
[image:22.612.110.508.326.465.2]
Figure 2.1 Leica GS20 PDM & Trimble GeoXT Hand Held GPS units.
The two systems compared offer similar features and both have there own functions that make them industry leaders in this area. The Trimble GPS was chosen for availability, accuracy, user-friendliness and cost. Both systems are for a project of this nature with the capabilities they possess. The differences between each system were few and either one could have been chosen but cost and the users familiarity of the Trimble GPS were the factors used to determine the decision.
2.2.3 Errors and Inaccuracies using GPS
significant are Atmospheric conditions, Ephemeris errors, Selective availability and Multipath errors. This suggests that the ability to control or minimise the effects of these errors will succeed in producing more accurate results. Atmospheric conditions are related to the ionosphere and troposphere, which refract the GPS signal. This causes the speed of the GPS signal in the ionosphere and troposphere to be different from the speed of the GPS signal in space. Ephemeris errors are concerned with orbital position and about the rate of clock drift for the broadcasting satellite. Selective availability is the intentional alteration of the time and ephemeris signal by the US department of defence , USQ(1999).
An awareness that these errors and inaccuracies will always exist in GPS surveying is the first step in completing a cemetery survey. The errors that have been discussed provides information on pre-planning before the survey, which can achieve an accuracy that is to acceptable standard.
2.3 Total Station
In addition to the use of GPS for this project, a Total Station was required to collect data in the cemetery. An instrument that was easy to operate and gathered the data in an efficient and reliable mode would be selected to complete several components of this project. This section will explore the range of instruments available in the market place, compare two Total Station models and discuss their accuracy range.
2.3.1 Total Station Options
The market is currently flooded with numerous Total Station models and selecting one that will complete a project is not only complex but time consuming. Most surveyors learn to use a particular model and find moving to another instrument difficult. This leads to assessing what specific tasks the user needs the instrument to perform and its accuracy requirements.
perform are similar for engineering surveying applications which was the task for the Total Station in this project.
2.3.2 Comparison of Total Station Options
Rather than using any available instrument, comparing two of them would be used to observe their capabilities and performance in engineering surveying. The Leica TPS1100 and Trimble 3000 series were chosen as leaders in the surveying duties that would be undertaken in this project. The focus was to assess the instruments data collecting, traversing and downloading capabilities. The choice of instrument would be determined using these parameters along with availability and cost.
a. Trimble
“Operate the 3600 Total Station with your choice of control unit including the Attachable Controller Unit (ACU). The ACU is an on-board, colour, Windows CE device equipped with a graphical touch-screen that can also be used with Trimble 5800 RTK Rovers and 5600 Total Stations. The Trimble ACU delivers one keyboard, one display, one dataset, one user interface, no cables, no hassles – truly Integrated Surveying.” (Trimble 3000 series datasheet available atwww.trimble.com)
The main features of the Trimble 3000 series are;
• Cable free operation;
• Tracklight;
• Colour touch screen;
• Bluetooth wireless technology;
• Water resistant design;
• Trimble Toolbox software;
• Millimetre accuracy; and
• Direct reflex (Electronic Distance Measuring device)EDM capability.
b. Leica
“The Leica TPS1100 Professional Series high-end surveying instruments offer a large degree of flexibility. The easy-to-read, clear user interface and the professional programming environment invite you to configure the instrument to meet your individual requirement and personal preferences. The modular system assures a large variety of available models and options to meet varying demands and requirements.” (Leica TPS1100 datasheet available at www.lieca.com).
The main features of the Leica TPS1100 series are;
• Millimetre accuracy;
• Rugged and water resistant design;
• Leica office software;
• Reflectorless EDM capability;
• Cable free operation;
• Automatic Target Recognition (ATR);
• Electronic Guide Light (EGL); and
• Lightweight
[image:25.612.101.508.579.715.2]In addition to these basic features the Leica TC1105 has an onboard coding system that is read via a Portable Computer Memory Card International Association (PCMCIA) card. During the transferring stage the data is dragged into the Engineering software from the PCMCIA card. Traverse station information is all saved onto the card and reduction of the project includes the points collected and the station information. This instrument uses very little key strokes during data collection and control and makes it an efficient and east to use system.
2.3.3 Accuracy range of Total Stations
The accuracy required for a survey such this project, defining a cemetery plot boundary, would be in the order of ± 5” for angular measurement and ± 5mm + 5ppm for distance measurement. This determined the use of these points which was a check for the points that are captured with the GPS.
The specifications shown in the Trimble 3605 are:
• Angular measurement standard deviation of ± 5” .
• Distance measurement ± 1mm + 1ppm using a prism over 3000m.
• EDM measuring time is 2 seconds.
(Trimble specification datasheet for TC1105 available at www.trimble.com)
The specifications shown in the Leica TC1105 are:
• Angular measurement standard deviation of ± 5” .
• Distance measurement ± 2mm + 2ppm using a prism over 3000m.
• EDM measuring time is 1 second.
(Leica specification datasheet for TC1105 available at www.lieca.com)
The specifications for both instruments are very similar so from an accuracy perspective either instrument was capable of completing the project.
The Total Stations in the market place were illustrated and out of these two a comparison was made. After considering the specifications and accuracy of both instruments it was apparent that both were more than capable of being used for the project. The choice was the a Leica TC1105 for its availability and the users familiarity with this particular Total Station.
2.4 Mapping
The GIS software used was MapInfo, it was available at no cost and needed little training to operate the system. The method that was be used for this project was to create a layer for the captured data, create polygons using data collected by the Total Station, moving the captured data into its correct position and attaching a photo of each grave plot to the point. This process has been explained in more detail by referring to section 3.5.1.
The mapping process is required to locate the spatial attributes of the cemetery using accurate surveying principles to ensure that the location of the line work and polygons that make up the grave plot layer are correctly located within the GIS and can be incorporated into existing GIS system. The hand held GPS was used to catalogue the data pertaining to each grave plot. This data logging component of the GPS allows the non spatial information to be collected. (I.e. name, dates, epitaph condition etc). The GPS also provides a Geospatial reference point.
The linking of the two capture processes, the hand held GPS and TPS data collection, allows the data captured by the GPS to be joined to the correct plot shapes that creates a GIS layer with linked attribute data. This is achieved by using SQL to join and analyse the data. The collected TPS information determines the shape of the plots that the user will see and requires the spatial accuracy to ensure a valid plot profile. The higher the accuracy here the better it will look on the GIS.
2.5 Analysis of collected and mapped data in a cemetery survey
Data analysis can be defined as the extraction of significant facts embodied in a dataset, Bonham-Carter (1994), this suggests that there must be some sorting of quality data from superfluous or erroneous data. This erroneous data in spatial databases can be in the form of data collection and compilation, data processing, data misuse, positional error, attribute error and final product error, Hunter & Beard(1992). Each one of these errors can be minimised by applying good analysis techniques from the initial collected data to mapped cemetery on the web page.
transformations). The potential benefits to be realised in linking these to GIS should not be ignored, particularly as all other analytical methods ultimately depend on such elementary functions”.
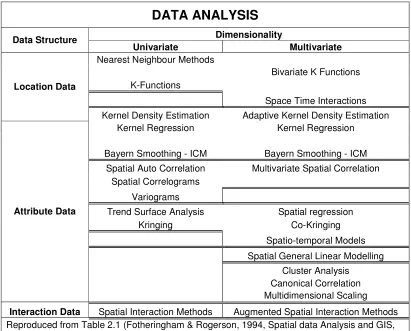
[image:28.612.118.430.302.499.2]Fotheringham & Rogerson (1994) suggest that “data analysis techniques used can vary and selecting the appropriate method should suit the type of work with several options available”(see Table 2.1). They also noted that “their is much value in being able to view simple statistical summaries and plots of data at the same time as being able to view the data geographically in the form of a map”. This suggests that analysis techniques should be kept simple as over analysing could also create problems. An example graph is illustrated below to demonstrate analysing tools that can be used.
Figure 2.3 A typical line graph that can be used for analysis purposes.
DATA ANALYSIS
Dimensionality Data Structure
Univariate Multivariate
Nearest Neighbour Methods
Bivariate K Functions
K-Functions
Space Time Interactions
Location Data
Kernel Density Estimation Adaptive Kernel Density Estimation
Kernel Regression Kernel Regression
Bayern Smoothing - ICM Bayern Smoothing - ICM
Spatial Auto Correlation Multivariate Spatial Correlation
Spatial Correlograms
Variograms
Trend Surface Analysis Spatial regression
Kringing Co-Kringing
Spatio-temporal Models
Spatial General Linear Modelling
Cluster Analysis
Canonical Correlation
Attribute Data
Multidimensional Scaling
[image:29.612.104.515.66.397.2]Interaction Data Spatial Interaction Methods Augmented Spatial Interaction Methods Reproduced from Table 2.1 (Fotheringham & Rogerson, 1994, Spatial data Analysis and GIS, pp18. )
Table 2.1 Data Analysis techniques used for certain data types.
2.6 Further research
This project, at a national level, could possibly be completed over a few years with the right resources, funding and processes. Further research must be performed to enable this project to completed in a more efficient manner. There should be no compromise in quality of information and method used to achieve the desired result but if it is possible to catalogue the data where there is less manual entry would make a huge difference and with use of RTK GPS alone would cut down time considerably. Furthermore research to investigate the availability of an approved cemetery mapping software package is needed to increase productivity.
2.7 Conclusions
of the difficulties and limitations encountered during a survey and the GPS used was evaluated against another system as an indication of its ability to complete the project. The outcomes of the review demonstrated the preparation needed to perform the cemetery mapping survey and the necessary steps involved in each process.
[image:30.612.100.508.299.488.2]The evaluation of these tasks was necessary to establish the most appropriate method needed to perform this process. Highlighting the benefits and limitations of each task was pertinent in ascertaining if the chosen method would suffice for this project. This provided new or more suitable methods of completing the project. This method can be used to consolidate the plan to perform the cemetery survey based on the available information.
CHAPTER
3 – METHODOLOGY
After reviewing the literature and equipment the best method that will complete this project is using a Total Station for control of the cemetery site and a hand held GPS to capture each plot. The cemetery data in conjunction with a GIS will form a digital cemetery map and the creation of a web page will make it possible to view the map and associated information.
This chapter will focus on developing a method of capturing, cataloguing and collecting cemetery data that is economical and easy to perform. The sections following will explore the methods used in collecting, capturing, cataloguing and mapping the cemetery data in preparation for the web page. Any relevant findings that were encountered during this process will be discussed along with the methods used which will be critically evaluated.
3.1 Study
Area
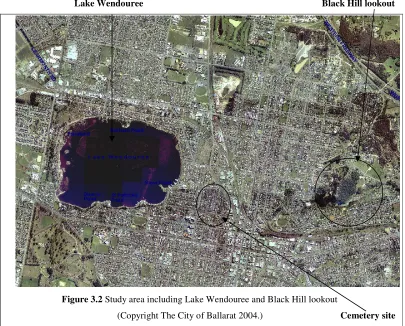
[image:31.612.99.510.444.695.2]The study area is in Ballarat which lies approximately 120 kilometres west of Melbourne in the state of Victoria. The cemetery site is 4 kilometres north of the city centre, to the east of Lake Wendouree and west of Black Hill lookout. The shape of the cemetery is rectangular and covers an area of approximately 7.56 hectares. See figures 3.1 & 3.2. Portion of cemetery mapped
Lake Wendouree Black Hill lookout
Figure 3.2 Study area including Lake Wendouree and Black Hill lookout
(Copyright The City of Ballarat 2004.) Cemetery site
The first task of the project was to establish ground coordinates for the cemetery map. The following section will discuss how this was achieved and in addition the investigation of existing survey marks, data collection and reduction of the grave plots and an alternative method to survey the cemetery.
3.2 Total Station (ground coordinates and data collection)
includes the initial investigation, the traversing to new points and the reduction of the traverse. This information, from a Surveyors perspective, is common knowledge and does not need discussion but was included for evaluation and completeness.
3.2.1 Investigation of Survey marks
The process of investigation was used to determine the distance necessary to coordinate points in the cemetery. The majority of surveying firms keep maps of known permanent marks for a particular area and sketches of these marks are kept in hardcopy form or can be extracted digitally via an internet service named Survey Mark Enquiry Service(SMES). These marks are found on a digital map of Victoria which contains every known mark and its coordinates on a permanent database that is updated regularly. The information, once located, can be viewed as a digitized sketch and be printed into hardcopy form. The majority of this hardcopy information is kept by many Surveyors at their own practice and is also shared throughout the surveying community.
Sketches of the marks required were located and once copied they were kept in a file for future reference. Two existing marks were used to start the traverse and all other new points were based on this information, these initial known marks are referred to as the baseline.
The known marks likely to be used are Standard Permanent Survey Marks (SPSM’s), Reference Mark Pipes (RMP’s), nails, rivets, star pickets, Standard Survey Marks (SSM’s) or spikes. The SPSM’s make up most of the marks used in initialising a survey as they have little or no ground movement and their coordinates are very reliable. This investigation was also used to determine the length of the traverse that relates to the time taken to complete the project and ultimately the cost to perform the task.
3.2.2 Traversing and collecting data in the Cemetery Site
The method of traversing required the placement of marks in specific areas in the cemetery. The marks were placed, to view any detail from the Total Station that required collection, and to tie in the GPS points collected during data capture.
point. These known marks have coordinates and are used, in conjunction with survey observations, to transfer coordinates to newly placed marks. Bearings and distances were read to each new mark and once a new mark had been read it became the base station for the placement of the next new mark. This process was repeated until all the marks needed were placed in the cemetery site and the last mark was closed onto a known mark to complete the traverse and as a check for any errors that may have occurred during the reading of bearings and distances. In this case only two new marks were required to collect the data in the cemetery.
The points were traversed using a Terrestrial Positioning System (TPS) Leica TC1105 Total Station and were coded according to the type of mark placed in the cemetery. Only one face needs to be read using this instrument due to a compensator built into the system that allows for the horizontal circle error. The raw traverse information has been included below in Table 3.1.
CIVILCAD 5 Job ENG4111 Date 13/04/04 14:24:56 File C:\CCAD5\TEMP\ENG4111.OUT
Job details Mapping Survey at Old Ballaraat Cemetery 13/04/04
Point -X- -Y- -Z- Code Sym C Layer 11 751608.833 5840221.458 452.450 NAIL/11 STN1 C SURVEY 12 751627.554 5840328.155 453.421 NAIL/12 STN1 C SURVEY 13 751584.418 5840112.198 450.781 SPSM/179 PSM SURVEY 20179 751584.414 5840112.196 450.781 SPSM/179 PSM SURVEY 20574 751557.984 5839965.270 448.671 SPSM/574 PSM SURVEY Pt 1 Pt 2 Bearing Distance Line Type Color Layer
20574 20179 10°11'52" 149.284 18 15 SURVEY 20179 11 12°35'52" 111.958 18 15 SURVEY 11 12 9°57'08" 108.327 18 15 SURVEY 12 13 191°17'47" 220.225 18 15 SURVEY Table 3.1 A print out of the traverse displaying ground coordinates of nails 11 and 12
hand held GPS and any points that fell out of a grave plot grid were adjusted accordingly.
The points were collected in what is known as ‘string form’ this means that each point was collected consecutively, like joining the dots on a picture, so when the information is presented graphically it is a true representation of what is in the field. Each point collected was coded with unique identifier eg. 01EDGE, to able easy editing if the points had been strung or coded incorrectly.
Another method commonly used is ‘cross-sectional form’, this collects multiple strings in a particular order and is mainly applied in road surveys, where this occurs. The string method was preferred over the cross-sectional method for its simplicity in collecting information in an area where there are very few strings to be coded. The cemetery plots were the only features that needed collection therefore only one code was required.
This component of the project allowed the definition of grave plot boundaries in the cemetery site and led to the next phase of data collection and traversing which was the reduction of raw information.
3.2.3 Reducing the Traverse and downloading collected data
The points collected in the field need to be processed using a method commonly known as reduction. The Engineering software is used in this instance to firstly process and adjust the traverse. Errors that are encountered, generally a misclose, are adjusted and the results are presented in the form of a report (See appendix B). The second task is to download the raw collected information and turn it into a graphical representation of what was collected in the field.
The traversed points were entered manually into the Personal Computer (PC) and processed using a misclose program. The traverse reduction was performed as separate task to compare results against the full reduction of collected and traversed points as discussed in the next section. The adjusted traverse data was transformed into AMG coordinates so that the new stations can become part of the AMG grid.
aid of a translation program supplied by Leica that turns the raw Leica data into raw CivilCad data. The raw data is able to viewed in a Direct Operating System (DOS) editing program and all the points were checked to make certain they had been coded correctly and the station data coordinates were confirmed for correct number used and coordinates assigned to each station (mark).
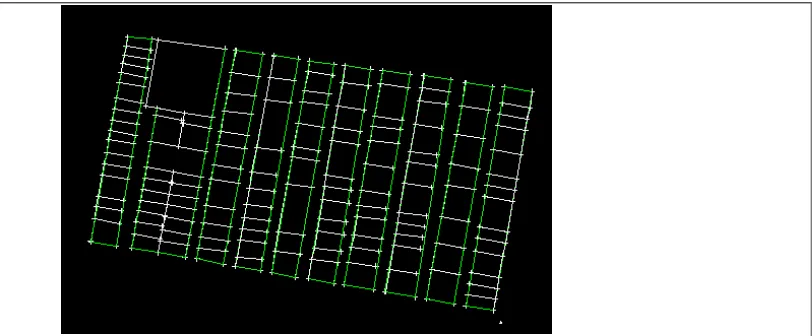
The next process was the reduction phase which turned the bearings and distances from the points collected into coordinates. These points were transferred into CivilCad where they were displayed graphically onto a PC screen. The process calculates the position of each point collected, using the bearing and distance read to each point, during the data collection stage. These points were checked and edited as necessary and any obvious errors were eliminated. The finished product was a series of lines connected which represents each grave plot all joined together to show a portion of the cemetery. An example of a portion of the cemetery from CivilCad is shown below in figure 3.3.
The collected points were converted into a Drawing Exchange Format (DXF) file, this file converts the CivilCad file into a format that can be used by a variety of programs, to be used during the mapping stage as polygons around the grave plots. This process is the check to locate any erroneous data collected during the capturing stage and also aids in the ability to move the points into their correct position should they be in the wrong location.
[image:36.612.101.507.514.682.2]
3.2.4 Alternative methods of traversing and data collection
Apart from collecting data using traditional methods, with a Total Station, RTK GPS was the other option. The process of collecting of data would have been similar and eliminated traversing requirements.
RTK GPS would be more efficient and involve less field time. In addition a one man operation would have benefited the process of completing the cemetery survey along with the convenience of less equipment to carry around the site. Comparing the two methods and displaying them graphically could be a task that is used in further research of this project. This questioned the need to use a Total Station for this project and its reasoning was that the equipment was available at no cost and the time taken for an experienced person to perform the traversing and data collection was minimal compared with RTK GPS although this system would have been the preferred option.
Control of the site served two purposes in this project, the first was to verify that the boundaries of cemetery sections are in their correct position and secondly to able to check that the points captured are not outside the grave plot boundaries.
The fundamentals of traversing were discussed and illustrated standard methods of this process in addition to the reduction process which will vary in different Engineering software packages. Exploring other possible methods provided an alternative to using a Total Station and illustrated their benefits and limitations. The underlying point was that this was a necessary process to be able to perform a cemetery survey and to detail the steps if future research is undertaken on this project.
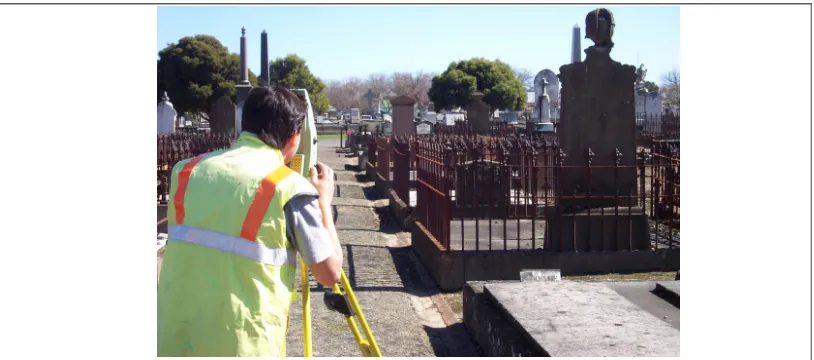
Figure 3.4 Collecting data around the grave plots using the Leica TC1105 (TPS).
3.3 Hand held GPS (planning a new project)
Hand Held GPS units have come a long way since its introduction into the market place. Initially its purpose was for navigation, particularly from an orienteering perspective. The asset-collecting component in the current range of Hand Held GPS units have many added features that make it very adaptable to a cemetery or similar surveys.
The background work necessary to prepare the Hand Held GPS ready for a survey is performed in the office with the aid of a software program. A file created in the software program is saved into the Hand Held GPS and selected when setting up a new project. A more detailed explanation is necessary to understand the steps involved and will include setting up the attribute table, setting up a new job and testing the equipment before performing the survey.
3.3.1 Setting up the attribute table
The process of setting up an attribute table commences on the PC using the GPS’s Pathfinder software. This software has been developed by Trimble and works in conjunction with the Hand held GPS’s (Trimble GeoXT’s, TerraSync program).
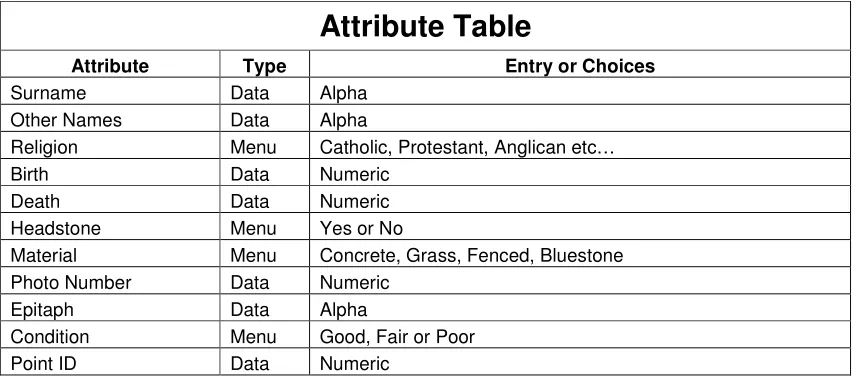
[image:38.612.101.508.66.246.2]numeric, date, time, filename or menu entry (see table 3.2). This project used point, numeric and menu which covered all the attribute data collected during cataloguing. Adding as much information as possible in the menu lists was essential in reducing field time describing certain aspects of the grave plot.
After the attribute table was completed it was transferred as the cemetery file from the GPS Pathfinder software to the Trimble GeoXT hand held GPS via a Universal Serial Bus Port (USB) connection. The attribute table becomes an entity of the GPS system and remains there until deleted, it is also used in setting up the unit for data collection. To retrieve the attribute file is a matter of choosing it from a list that includes previously created tables and is part of the initial set up in the creation of a new project outlined in the next section.
Attribute Table
Attribute Type Entry or Choices
Surname Data Alpha
Other Names Data Alpha
Religion Menu Catholic, Protestant, Anglican etc…
Birth Data Numeric
Death Data Numeric
Headstone Menu Yes or No
Material Menu Concrete, Grass, Fenced, Bluestone
Photo Number Data Numeric
Epitaph Data Alpha
Condition Menu Good, Fair or Poor
[image:39.612.105.532.320.508.2]Point ID Data Numeric
Table 3.2 Attribute table used to catalogue the captured data.
3.3.2 Preparing for a new project
The Trimble GeoXT Hand Held GPS is a user-friendly device that operates much like a PC and works together with a program named TerraSync. This data collection software has a process that automatically allocates a default filename that includes the current date and time, an example of this would be R050809A. This particular filename indicates that it is the 8th of May at 9.00am. The filename may be changed but for all
The system prompts the user for the attribute type and this stage is the ‘cemetery’ attribute table is selected from the systems data dictionary. At the same time the GPS is searching for satellites and as soon as 5 or more are found the system is ready to log data. The user can now proceed to log data about an individual grave plot into the Hand Held GPS which will be discussed later in section 3.4.1.
3.3.3 Testing the Hand Held GPS data collector
Before commencing a new project the equipment must be tested for any problems or faults that may occur in the field. A common method is to use a location that is in close proximity to the office so that the results can be viewed and checked quickly.
A small test job is the common approach to fulfilling this task and requires a number of random points to be collected including some known points as a check. This process will also test for any bugs that may appear and help to verify the accuracy of the equipment. This process will also give the user an indication of the time that will be required to capture a certain number of points and the time needed to log each piece of data into the GPS.
Preparing the Hand Held GPS for data collection is one of the processes required to perform the project and is vital in estimating time and quantity of data to be captured. The importance of this stage is evident from the initial set up of attributes through to testing the equipment. Many hours may be wasted if this preparation is not performed properly and the overall quality of the project may be degraded.
The second part of the GPS component of the project is the capturing and cataloguing of data in the cemetery the next section will discuss these issues.
3.4 Hand held GPS (capturing and cataloguing data)
3.4.1 Capturing the data
The methods that can be employed for a cemetery survey depend on its application. Grimes (1999) suggested that if it were a search for a survey of a family cemetery the best method for pin pointing it is using GPS RTK methods. This method could also be adopted to accurately define the boundaries of the site.
In contrast the method used for pin pointing a particular gravesite such as in this research project requires more rigorous coordinates as the area in question has already been mapped and we are only adding another layer to the GIS. Johnson (2001) identified that a hand held device such as a GPS asset data collector is ideal for this type of work and is also inexpensive to buy or hire in comparison to RTK GPS systems.
The process of capturing the data is initialised during the set up of a new job (refer 3.3.2). Once the system has been step up the GPS starts to locate satellites and if enough are found, five is preferable, it begins to log data about the point that is to be captured. Once the user believes enough data has been logged, in the order of one to two minutes is required, the point is captured by pressing the ‘capture’ button with the touch pen. It is during this process that the user catalogues the data. At this point it is vital that the user remains still and only moves very slightly or the results may not be very accurate even after post processing. It is at this time the GPS is resolving ambiguities and any sudden movement will not allow the device to correctly calculate its position relative to the satellites and beacon it uses to retrieve its coordinate information.
Figure 3.5 Capturing and cataloguing data using the Trimble GeoXT hand held GPS.
3.4.2 Cataloguing the data
Cataloguing the data is the process in which the user enters information pertaining to each grave plot. It can be a time consuming exercise as one grave plot may contain up to eight entombments. The time taken to enter each piece of information is generally enough for the GPS to have logged enough data to be able to collect the point. The cataloguing requires the user to choose a number of attributes and is included in Table 3.1. This process will need to be repeated if there are multiple entombments in one plot.
The information entered on each grave plot must be accurate and can be cross-referenced using the cemeteries records. It was found that some grave plots were unmarked but they were included for location and further research would be necessary to locate the attributes of the person/s entombed in these grave plots.
Completing this task required a steady hand as the interface between user and GPS is via a touch screen. The screen is also quite small and inaccuracies occurred during the cataloguing. This time consuming exercise though cumbersome allowed the GPS time to log data and created a situation where waiting for ambiguities to be resolved was almost eliminated.
[image:42.612.103.508.65.244.2]place in the future. A method that involves less field time to capture and catalogue more grave plots is essential so that it is more economically viable for local government authorities or cemetery trusts to have this information mapped.
The information now in a raw format needs to be converted, along with the data collected, into a GIS to view in a useable format. This process will involve gathering all spatial attributes and merging them to have completed cemetery map.
3.5 GIS (Mapping the data)
The mapping element of the project required the data captured by the GPS and the data collected by the TPS to be combined and transferred into a GIS mapping software package, in this project MapInfo was used.
The collected data produced a digital map of a portion of the cemetery that clearly defined each grave plot as a polygon. The plots were also tagged with a point(s) containing information about an individual(s) entombed in the plot. These points in their raw format were assessed to determine whether their location was suitable in terms of accuracy. The points that did not fall within the plot region were relocated and will be discussed further in this section. The final task was to link a photo to each plot so a record of information along with a visual identity of the grave plot could be viewed.
The techniques used for this mapping process are particular to MapInfo but the fundamental processes used to extract information are similar between GIS systems. This information is included as a one method to map a cemetery survey project. In addition the theory behind the data capturing process and the cadastre used to verify the accuracy of the collected and captured will be discussed.
3.5.1 Mapping the data into a GIS
The next layer included was the data captured by the hand held GPS. This data is an RDB file in Trimble’s TerraSync Program and has been formatted to be recognised by most GIS’s. The new layer is introduced in MapInfo by having the first layer, the cemetery plots, active. The steps to add a layer are, using the layer function on the toolbar in MapInfo, to choose the required file and accept it. The result is the collected, captured and catalogued data combined as shown in figure 3.6. The data displayed is in a raw format and requires manipulation to bring up to an acceptable level ready to transfer in to the web page.
Figure 3.6 Raw captured data overlayed onto collected grave plots.
The manipulation of this information can be achieved by using two methods the first is to post process the points and the second is two manually move the points into their correct grave plot. The latter method was chosen because it easier and the plots are accurate and show the true boundaries, all that is required is a point(s) in each plot.
[image:44.612.118.481.241.474.2]now ready for the next phase in the completion of the cemetery map the inclusion of digital photos.
Figure 3.7 Captured data aligned with collected grave plots
The final layer comprised of attaching a photo of each grave plot to each point captured in the cemetery survey. The method used to introduce this information required adding an attribute ‘HotLink’ to the grave plot points and copying the link to its location to this attribute. The user enquires on a point using the HotLink function icon in MapInfo and by selecting a grave plot can view the grave plot photo (see Appendix G).
To complete the cemetery map colours can be added to enhance the effect of the map. The polygons were cross hatched with purple to stand out and the crosses on each grave plot corner collected with the Total Station were reduced in size to make the completed map more presentable.(See Appendix E).
3.5.2 Cadastre, Metadata and Polygonisation
A cadastre is defined is defined by the United Nations Educational, Scientific, and Cultural Organization(UNESCO) in 1983 as: ‘an official up-to-date public record usually recording ownership, the value and quantity of land in a jurisdiction, state or country, recorded in fiscal or legal land parcel units.’ USQ(2001). In this case the cadastre of the cemetery area was used to verify that the points collected in the field were true and to an acceptable accuracy. The City of Ballarat cadastre was overlayed on the captured and collected lines and points and the results were detailed in section 4.4.1. The cadastre and the cemetery map were overlayed to assess if they matched and once this was satisfied became a verification that the cemetery plots collected by the Total Station were in the correct location.
All the data collected and captured in the field should have metadata detailing the accuracy of the line work, time of capture and the person responsible for it. This serves the purpose of enabling a person who might be performing research on a similar topic the opportunity to see where the data has come from and whether or not it suitable for their requirements. Part of this information is included in Appendix D and features the accuracy of each point including when and what time it was captured. The person who collected, captured and catalogued the data is the author of the research project and the location is The Old Ballaarat Cemetery.
Figure 3.8 Collected data that has been transferred to MapInfo and polygonised
Collecting the grave plots in the field to create a map and check the data captured was more accurate than using the digital map, although this verified that the information was in the proximity of that portion of the cemetery. This ultimately led to an extra step in the process of collecting data using a Total Station but the end result was a more accurate picture of what was captured in the field.
The method of mapping the data was discussed and determined that layers would need to be combined for a complete picture of the cemetery plots and its boundaries. The relocating of points was performed manually although time consuming but the end product has achieved the desired result.
The cadastre process was discussed along with the metadata required and polygonisation techniques, these topics were introduced to have an overall picture of the mapping procedure. The creation of layers to form the map is only part of the as discussed in section 3.5.1 are only one part of the process.
[image:47.612.135.471.62.284.2]3.6 Web Page Design
The mapped cemetery information, at this stage, could not be used as a shared application so a medium was sought after that could hold this amount of information and could be accessed anywhere and at anytime. The world wide web was one such medium that would able this information to reach a larger audience and was considered the obvious choice. The problem would be the design requirements necessary to able a user to obtain information from the web site, what it would contain and to find the a suitable language to create such a web site.
3.6.1 Design requirements and contents
In preparing the web site a specific criteria was required to suit the needs of the user. The parameters for the website were that the site had to be easy to use, needed links to other related sites, required a search option to be able to find specific grave plots and had the ability to expand when further mapping was completed at the cemetery. The site would have a menu containing headings such as a history, grave plot search, further work, a cemetery map, related links and contact person for further information.
The site would contain a home page with a brief history of the cemetery including all relevant information on any significant people entombed in there. The grave plot search would require the input of a surname or previous name and looking through its database would find that person if they were located in the cemetery otherwise a ‘no matching records’ would be displayed. A ‘further work’ heading would be used by interested people who wanted to know what the next step was in completing the cemetery map or how they could contribute to the project. A general cemetery map would allow a user to view the cemetery site in relation to the Ballarat township and also give some perspective of its size. All related links such as historical societies, genealogical sites and any other related web sites would be included in the final design. In addition a contact area would be available for further information on the cemetery mapping project.
3.6.2 Language used to create a web page
(HTML), Hypertext Markup (HTM) and JAVAScript. HTML is widely recognised, Microsoft based and is easy to learn. The other two are better used for experienced programmers and web designers and require more extensive training.
HTML uses a simple web language that shows errors and only requires typing the information that will be contained in the web site. All the coding language is displayed as shortcuts on top of the programming page, (HTML Lite), and requires the user to click on the necessary code to complete a section of the website. Any photos can be added to the web site by simply referring to the filename and its drive location. All links are added by supplying the address and will automatically link to the site and can be accessed by clicking on the particular web address. Any errors are checked using a validation section in the menu, this shows the user which line is wrong and the remedies to fix the problem.
3.6.3 Creating the web page
Creating a good web page involves a logical structure of coding that will create the main home page a user will see when they visit the site. Coding in HTML is relatively fast when the user is familiar with the basic codes but the actual typing of information contained in the web page can be laborious if there is a lot of content.
The main heading is the first item that is required and from this the content in the home page comes together very quickly. It is much easier to type the text component of the page and introducing the photos at a later stage. There is a tool, external viewer, that allows switching between the code page and the home page as it is developed. This allows aligning the text size and spacing correctly and the ability to fit graphical items. The code also allows you to link to other pages, other websites and sends you to the home page at any stage.
The methods used to complete the project was developed using a number of parameters. Availability and cost of using the equipment played a major part in completing the project along with the reason for approaching the problem in this manner, which evolved over the duration of the survey. Findings such as the maps accuracy and the difficulty of the touch pen during cataloguing culminated in the finished design used.
If the project was to be redone more resources would have been sought such as RTK GPS and additional manpower to complete the whole cemetery site. In regard to the project as it was completed, it was adequate for a portion of the cemetery and using another method would have meant over sourcing.
The field and office work now completed will require analysis to see if the results obtained was to a level of accuracy that was desired and that correct processes towards the completion of the project had been performed.
[image:50.612.103.508.376.604.2]CHAPTER 4 – DATA ANALYSIS
4.1 Analysis of Traversed and Collected Data
The traversed data can be processed in several ways depending on the size of the traverse and the application of its information. This research project required a traverse that was accurate to at least third order, meaning that the bearings and distances read to each new point was read to the second for bearing and to the millimetre for distance. The traverse was closed back to the base station to check for any possible errors and adjusted using a Compass adjustment (standard CivilCad adjustment).
The total length of the traverse was short so it was decided to test whether or not the coordinated points would vary significantly if the traverse was reduced with the collected data and unadjusted or adjusted first then reduced with the collected data.
The results illustrated that the difference was minimal although the desired method of closing and applying an adjustment is the correct procedure for reducing a traverse. A comparison table has been compiled to demonstrate the small differences found between the two methods.
COMPARISON OF READ COORDINATES OF NEWLY PLACED POINTS INTO CEMETERY
STATION UNADJUSTED COORDINATES ADJUSTED COORDINATED DIFFERENCE
11 751608.833E , 5840221.458N 751608.832E, 5840221.458N -.001E, 0.000N
12 751627.554E, 5840328.155N 751627.552E, 5840328.155N -.002E, 0.000N
Table 4.1 Comparison of unadjusted and adjusted coordinates.
This demonstrates that the two methods result in coordinates that are comparatively the same over a short distance but this will increase considerably over a greater distance. Third order traversing has an acceptable error of 1:10000, Surveyors Board of Victoria (1992). After applying a Compass adjustment on the traverse the accuracy stated was 1:99843 which is well inside these parameters. See Appendix B for both traverse and the Compass adjustment.
4.2 Analysis of Captured Data
The data captured by the hand held GPS requires analysis after it has been transferred into the MapInfo software. The method used to the analyse included using the MapInfo tools to move the points into their correct location. Another analysis would be to tabulate or graph the GPS inaccuracies mainly Positional Dilution of Precision (PDOP), Horizontal Dilution of Precision (HDOP) and Horizontal Precision and assess the points which were considered to be outliers.
The analysis techniques included comparing the points captured against the points taken around each grave plot. This process produced a table showing the differences and allowed the movement of the points captured into their correct position. The difficulty with this method is that their was no common error in their position therefore moving the points into position needed to be performed manually and one by one. Figure 3.6 illustrates the points in their raw form before the points were relocated. Figure 3.7 illustrates the points that after the were relocated to their correct location.
The other option was to use a post processing technique that uses coordinated points around the site. These points are fixed and a best fit method is used to move the points captured into a location relative to the fixed points. The benefits of using this method are that they can be moved together and can produce very good results if the error is common to a series of point. The capture was completed in three sessions so the data would have to be post processed for each session. A tabulated version of this produces a before and after scenario and again these moved points can be compared against the points taken around each grave plot. The limitations using this system are the availability of known points evenly spread around the site for accuracy when the captured points are moved.
Although the points were moved into their correct location manually and did not require post processing, it was decided to set up a table to illustrate the three attributes the Hand Held GPS used to display its accuracy. The three attributes were the PDOP, the HDOP and the Horizontal Precision. This would identify any wayward points and also compare the data accuracy over the three sessions.
yellow line in figures 4.1, 4.2 and 4.3. The averages for the PDOP were 2.89, 2.80 and 2.79. It was apparent that in all three sessions a PDOP of above 4 should be considered an outlier and figure 3.6 suggest that these are points not located near the grave plots. These outlying points were caused as a result of moving before the point was captured, not having a good satellite constellation, not enough satellites or not logging enough data on a particular point.
Session 1 PDOP
0 1 2 3 4 5 6 7 8 9
[image:53.612.158.458.207.392.2]1 8 15 22 29 36 43 50 57 64 71 78 85 92 99 106 Grave Plots M ax P D O P
Figure 4.1 Session 1 displaying maximum PDOP of grave plots (8/5/2004).
Session 2 PDOP
0 1 2 3 4 5 6 7 8 9