“EFFECT OF MUSCLE ENERGY TECHNIQUE AND CONSERVATIVE EXERCISES ON PAIN, RANGE OF MOTION AND SHOULDER
FUNCTION IN PATIENTS WITH ADHESIVE CAPSULITIS”
REGISTER NO : 271410301
ELECTIVE: PHYSIOTHERAPY IN ORTHOPAEDICS
A DISSERTATION SUBMITTED TO THE TAMILNADU DR. M. G. R MEDICAL UNIVERSITY, CHENNAI.
AS PARTIAL FULFILLMENT OF THE
CERTIFICATE
Certified that this is the bonafide work of Mr GOPINATH of K.G. College of Physiotherapy, Coimbatore, submitted in partial fulfillment of the requirements for the Master of Physiotherapy degree course from the Tamilnadu Dr. M.G.R. Medical University under the Registration No: 271410301 for the April 2016 Examination.
Principal
“EFFECT OF MUSCLE ENERGY TECHNIQUE AND CONSERVATIVE EXERCISES ON PAIN, RANGE OF MOTION AND SHOULDER
FUNCTION IN PATIENTS WITH ADHESIVE CAPSULITIS”
Under the guidance of,
Guide:
Dr. B.Arun, MPT, Ph.D., Principal,
K.G. College of Physiotherapy, K.G. Hospital,
Coimbatore- 641035.
A DISSERTATION SUBMITTED TO THE TAMILNADU
Dr. M.G.R. MEDICAL UNIVERSITY, CHENNAI,
AS PARTIAL FULFILLMENT OF THE
MASTER OF PHYSIOTHERAPY DEGREE
A Dissertation On
“EFFECT OF MUSCLE ENERGY TECHNIQUE AND CONSERVATIVE EXERCISES ON PAIN, RANGE OF MOTION AND SHOULDER
FUNCTION IN PATIENTS WITH ADHESIVE CAPSULITIS”
Has been submitted in partial fulfillment for the requirement of the
Master of Physiotherapy degree
April 2016
ACKNOWLEDGEMENT
With a humble and grateful heart, I thank Lord Almighty who has granted me this good opportunity to experience his abundant blessing and gracious mercy to be fruitful throughout this venture.
With due respect, I would like to express my sincere thanks to Padmashree Dr. G. Bakthavathsalam, Chairman, KG Hospital for permitting to conduct the study by providing a wonderful environment and the necessary infrastructure.
With a sincere and a honest heart, I would like to thank madam, Mrs.Vaijayanthi Mohandas, Director of Education, KG College of Health Sciences for her enthusiasm and concern for all the well being of the students.
I express my heartful gratitude to my guide Dr. B.Arun, MPT, Ph.D., Principal, K.G College of Physiotherapy for instilling the professional attitude of discipline, for guiding and correcting me with patience always. He has support and timely help in all possible manners in successfully carrying out and completing this project.
It gives me immense pleasure to express my gratitude to Prof.Mr.Mohan Raj,MPT.,Vice-Principal, K.G. College of Physiotherapy.
I am extremely pleased to thank all the staffs of K.G.College of Physiotherapy, and all the Staff in the Department of Physiotherapy, K.G.Hospital, Coimbatore, for their valuable suggestions which greatly enhanced the contents of this study.
I am obliged to offer my sincere thanks to all My Subjects for having consented to participate in this study forgoing all suffering.
I also express my sincere thanks to all my patients for having consented to participate in this study and for their co-operation in making this study a successful one.
CONTENTS
S.NO CHAPTER PAGE NO
I IINTRODUCTIN 1
1.1 Need for the study 7
1.2 Aim of the study 8
1.3 Objectives 9
1.4 Hypothesis 9
II REVIEW OF LITERARURE 10
III METHODOLOGY 18
3.1 Study design 18
3.2 Study setting 18
3.3 Study population 18
3.4 Study duration 18
3.5 Selection of samples 18
3.6 Selection of criteria 19
3.7 Variables 20
3.8 Parameters 20
3.9 Operational tools 20
3.10 Procedure 21
IV DATA ANALYSIS & INTERPRETATION 26
V RESULTS 54
VI DISCUSSION 59
VII SUMMARY AND CONCLUSION 64
VIII LIMITATIONS AND RECOMMENDATIONS 66
IX BIBLIOGRAPHY 67
LIST OF TABLES
SL . NO
LIST OF TABLES PAGE . NO
1
Pre test and post test values of Group A
( VISUAL ANALOGUE SCALE ) 26
2
Pre test and post test values of Group B ( VISUAL ANALOGUE SCALE )
27
3
Pre test and post test values of Group A (SHOULDER PAIN AND DISABILITY INDEX)
28
4
Pre test and post test values of Group B (SHOULDER PAIN AND DISABILITY INDEX)
29
5
Pre test and post test values of
Flexion in Group A (UNIVERSAL GONIOMETER)
30
6
Pre test and post test values of
Flexion in Group B (UNIVERSAL GONIOMETER)
31
7
Pre test and post test values of
Extension in Group A (UNIVERSAL GONIOMETER) 32
8
Pre test and post test values of
Extension in Group B (UNIVERSAL GONIOMETER) 33
9
Pre test and post test values of
Abduction in Group A (UNIVERSAL GONIOMETER) 34
10
Pre test and post test values of
Abduction in Group B (UNIVERSAL GONIOMETER) 35
11
Pre test and post test values of
Internal rotation in Group A (UNIVERSAL GONIOMETER) 36
12
Pre test and post test values of
Internal rotation in Group B (UNIVERSAL GONIOMETER) 37
13
Pre test and post test values of
External rotation in Group A (UNIVERSAL GONIOMETER) 38
14
Pre test and post test values of
S.NO LIST OF TABLES PAGE . NO
15
Pre test values of Group A and Group B
( VISUAL ANALOGUE SCALE) 40
16
Post test values of Group A and Group B
( VISUAL ANALOGUE SCALE) 41
17
Pre test values of Group A and Group B
( SHOULDER PAIN AND DISABILITY INDEX ) 42
18
Post test values of Group A and Group B
( SHOULDER PAIN AND DISABILITY INDEX ) 43
19
Pre test values of Flexion in Group A and Group B
( UNIVERSAL GONIOMETER ) 44
20
Post test values of Flexion in Group A and Group B
( UNIVERSAL GONIOMETER ) 45
21
Pre test values of Extension in Group A and Group B
( UNIVERSAL GONIOMETER ) 46
22
Post test values of Extension in Group A and Group B
( UNIVERSAL GONIOMETER ) 47
23
Pre test values of Abduction in Group A and Group B
( UNIVERSAL GONIOMETER ) 48
24
Post test values of Abduction in Group A and Group B
( UNIVERSAL GONIOMETER ) 49
25
Pre test values of Internal rotation in Group A and Group B
( UNIVERSAL GONIOMETER ) 50
26
Post test values of Internal rotation in Group A and Group B
( UNIVERSAL GONIOMETER ) 51
27
Pre test values of External rotation in Group A and Group B
( UNIVERSAL GONIOMETER ) 52
28
Post test values of External rotation in Group A and Group B
1
I.INTRODUCTION
The shoulder is a unique anatomical structure with an extraordinary range of
motion (ROM) that allows us to interact with our environment. A loss of mobility
of this joint will cause significant morbidity. Frozen shoulder or Adhesive
capsulitis or shoulder Periarthritis affects 2—5% of the population and is most
common in the 40-60 year old age group. (Jalena Jurgel et al., 2005). Nevasier was
the first person who identifies the pathological and histological examination of the
frozen shoulder and concludes that it is not a periarthritis where as there is a
thickening and contraction of the capsule is seen, which becomes adherent to the
humeral head and he termed is as Adhesive capsulitis. (Nevasier, 1945).
Shoulder pain initially was described as “periarthritis” which was described
by Duplay in 1872. Later it was termed as “Frozen shoulder” where there is
gradually developing condition, characterized by pain, restricted movements and
painful movement and disability to sleep on affected side. (Codman, 1934).
Nevasier defined this shoulder pain as the “Adhesive capsulitis” since there were
inflammatory pathogenesis and fibrosis around the shoulder joint capsule.
(Nevaiser 1945). Histological studies has confirmed the presence of fibroblasts
and chronic inflammatory cells which seen in joint capsule of the shoulder. (Hand
2
Women are more frequently affected than men approximately 70% of
women are affected. (Sheridan et al., 2006). Bilateral involvement occurs in
10-40% cases. The incidence of adhesive capsulitis in people with diabetes is up to
20%. (Kulkarni 1999). Adhesive capsulitis is a condition of the shoulder of
unknown etiology. Predisposing factor includes secondary trauma, post surgery,
cardiovascular disease and diabetes. (Matsen et al., 1993). There are some
evidences that protease inhibitors used in antiretroviral therapy have been
associated with the development of Adhesive capsulitis. (Zuckerman et al., 2011).
Adhesive capsulitis has been classified as primary and secondary. Primary
adhesive capsulitis is characterized by global capsular inflammation and fibrosis
which occurs without any precipitating cause. Secondary capsulitis includes much
condition causing stiff shoulder such as calcific tendinopathy, glenohumeral
arthritis, rotator cuff tear, acromioclavicular arthritis and previous shoulder trauma
or surgery. (Pearsall et al., 1998). Treatment for the adhesive capsulitis should be
based on the disorder of have to sort out the primary cause of stiffness. (Noel et al.,
2000).
Adhesive capsulitis describes three clinical stages. 1) Freezing stage,
characterized by acute and continuous pain and arm stiffness in adduction and
internal rotation. 2) Frozen stage during which there is less pain but more of
3
gradually restored. Even though this disease has a benign course, its symptoms can
sometimes persist for a long time, possibly leading to functional damage of the
shoulder griddle and general shoulder disability. (Donatelli, 2012).
Adhesive capsulitis is characterized by the spontaneous onset of pain, Pain
located on the antero-lateral aspect of the joint and rarely radiates to the anterior
aspect of the upper arm. Discomfort is worse at night and it interferes with sleep.
Palpable tenderness is noticed over the humeral head and over the bicepital groove.
Movements are limited in all directions, restrictions of movement are seen in active
and passive range with which effects the entire upper limb. ( Boyle-Walker 1997,
Peter et al., 2003, Harryman et al., 2004). Most common limitation of the range of
motion is flexion, abduction, and external rotation. Loyd (1983) suggested that
secondary frozen shoulder develops when painful spasm limits activity and creates
dependency of the arm.
Adhesive capsulitis cause limitation or selective immobilization in the
shoulder movement. Prolonged immobilization of the joint has been shown to
cause several detrimental pathophysiologic findings which include decrease
collagen length, fibrofatty infiltration into the capsular recess, ligament atrophy
result in decreased stress absorption, collagen band bridging across recesses,
random collagen production and altered sarcomere number in muscle tissues.
4
Adhesive capsulitis is a commonly recognized but poorly understood cause
of a painful and stiff shoulder. Although most orthopaedic literature supports
treatment with physical therapy and stretching exercises, some studies have
demonstrated late pain and functional deficits.
Adhesive capsulitis are treated conservatively using physiotherapy alone or
physiotherapy in combination with steroids which helps to resolve symptoms in
3—4 months. (Levine et al., 2007). Physiotherapy are measured as the key to the
treatment for the adhesive capsulitis and treatment includes ultrasound, Ice pack,
Range of motion exercises and eventually strengthening exercises. (Melzer et al.,
1995). Conservative physiotherapy for adhesive capsulitis includes joint
mobilization, stretching, strengthening exercises and Codman’s pendulum
exercises.
Joint mobilization techniques like muscle energy technique, cyriax technique
are considered to be good in the treatment for adhesive capuslitis. These manual
therapy techniques can break up the scar tissues in the joint capsule. It is very
important for the patient to undergo these techniques to reduce pain and improve
range of motion. (McClure et al., 1997).
Codman’s Pendulum exercises are techniques that use effects of gravity to
distract the humerus from glenoid fossa. (Calliet 1991). Hence these are passive
5
oscillating movement and provide early motion of joint structures and synovial
fluids. (Kisner 2002).
Muscle energy technique (MET) is a common soft tissue mobilization
technique which involves the voluntary contraction of the subject’s muscles in a
precisely controlled direction, against a counterforce provided by the therapist.
MET is used to decrease pain, stretch the tight tissues, reduce the tone, improve
circulation, mobilize the joints and strengthen the weak musculatures. (Fryer et al.,
2004). Muscle energy technique has show significant improvement for range of
motion which was supported in various literatures. (Schenk et al, 1997). Another
study done by Stephanie et al., 2011 concluded that MET for glenuohumeral joint
helps to improve Glenohumeral joint range of motion.
Clinical measurement of range of motion is a fundamental evaluation
procedure with ubiquitous application in physical therapy. The examination of
shoulder mobility may be accomplished using a number of instruments including:
visual observation, goniometry, linear measures, and inclinometry (Clarkson
2005). Goniometry has been used widely due to its portability and low
cost.(Gajdoski et al., 1987). Clinicians should use a goniometer to take repeated
PROM measurements of a patient's knee to minimize the error associated with
6
Visual analogue scale (VAS) is a numerical scale which measures the pain
of the individual. It is a 10cm line with one end marked as Zero(0) indicates no
pain and other end with Ten (10)indicates intolerable pain or worst type of pain.
(Wong et al., 1988). Studies show that VAS has high amount of reliability and
validity and can be used as a measurement tool. (Ritter et al., 2006)
The Shoulder Pain and Disability Index (SPADI) is a self-report measure
developed to evaluate patients with shoulder pathology. The shoulder pain and
disability index (SPADI) is a self-report questionnaire developed to measure the
pain and disability associated with shoulder pathology. The SPADI consists of 13
items in two subscales: pain (5 items) and disability (8 items). Validity was
established by correlating SPADI total and subscale scores with shoulder range of
motion (ROM). (Roach 1991).
Though there are many interventions prescribed in the management of
adhesive shoulder, the evidences are still lacking or the results are controversial.
First choice of the treatment is based on a rehabilitation therapy program that has
to follow precise steps leading to functional recovery of the shoulder joint avoiding
the need for surgery. (Donatelli,2012). So this study is done to find out the efficacy
of the muscle energy techniques in addition to the Conservative exercises in
7
1.1 NEED FOR THE STUDY
Adhesive capsulitis is a condition affecting the glenohumeral joint
characterized by pain and loss of active and passive joint mobility. It is generally
primary or idiopathic and arises spontaneously in the absence of specific causes
such as traumas, fractures, tendon injuries or dislocations, which are causes of
secondary shoulder stiffness. The fibroblastic proliferative process involves the
entire joint capsule, and the fact that anterior capsular release generally leads to
resolution of the clinical picture has led to the suggestion that fibroplasia and
contracture are two clearly distinct processes, and that joints stiffness might not be
entirely related to capsular fibroplasia (Ryu et al., 2006).
Contracture is defined as shortening of connective tissue (ligaments,
tendons, and cartilage) caused by excessive arthrofibrosis, immobilization,
inactivation, adhesions, or excessive neuromuscular tone. (Ada et al., 2005).
Even though this disease has a benign course, its symptoms can sometimes
persist for a long time, possibly leading to functional damage of the shoulder girdle
and general disability. The treatment of first choice for adhesive capsulitis is based
on a rehabilitation therapy program that has to follow precise steps leading to
functional recovery of the shoulder joint, avoiding the need for surgery.
Conservatively physiotherapy management includes a variety of interventions like
8
electrical nerve stimulation, active and passive range of motion (ROM) exercises,
Proprioceptive neuromuscular facilitation techniques and mobilization techniques.
(Vermeulen et al., 2006).
Still there is no consensus regarding the best treatment for adhesive
capsulitis. Although many different conservative measures were taken part, still
there is no well treatment addressed. The recognition of the clinical stage must be
the one which address the kind of the treatment. Implementation of muscle energy
techniques along with Conservative therapy, demonstrated a significant decrease in
pain and improved ROM and functional disability which supports the alternate
hypothesis. (Lokesh et al., 2015).
Although there are many studies evaluated the efficacy of various treatment,
only few studies are done to evaluate the effect of muscle energy technique and
Conservative exercises in adhesive capsulitis. This study aims to address the
problem.
1.2 AIM OF THE STUDY
The aim of the study is to find out the effect of Muscle energy technique and
conservative exercises on pain, range of motion and shoulder function in
9
1.3 OBJECTIVES
To find out the effect of Muscle energy technique on pain, range of motion
and shoulder function in adhesive capsulitis pain
To find out the effect of Conservative exercises on pain, range of motion and
shoulder function in adhesive capsulitis
To compare the effect of Muscle energy technique and Conservative
exercises on pain, range of motion and shoulder function in adhesive
capsulitis
1.4HYPOTHESIS
Null Hypothesis
There is no significant difference between Muscle energy technique and
conservative exercises on pain, range of motion and shoulder function in
adhesive capsulitis
Alternate Hypothesis
There is a significant difference between Muscle energy technique and
conservative exercises on pain, range of motion and shoulder function in
10
II REVIEW OF LITERATURE
Catherine et al., (2011)
Stated that the Shoulder Pain and Disability Index is a valid measure to
assess pain and disability in people with shoulder pain.
Boonstra et al.,(2008)
Conducted a study to determine the reliability and validity of the Visual
Analogue Scale for disability in patients with chronic musculoskeletal pain and
they concluded the reliability of the visual analog scale for disability is moderate to
good and a strong correlation with the visual analog scale for pain.
Yang (2007)
Stated that mobilization had a positive effect in improving joint mobility and
daily function in person with frozen shoulder.
Mac Dermid et al.,(2006)
Stated that internal consistencies of the shoulder pain and disability index
subscales were high. It was found that the shoulder pain and disability index is a
valid measure to assess pain and disability in shoulder pain due to musculoskeletal
11
Ritter et al., (2006)
Found that the Visual Analogue Scale is a valid measure as it was successful
for measuring the underlying pain variable, and easier to use and code and
sensitive to change in pain
Dias et al.,(2005)
Stated that adhesive capsulitis is more common in females and the peak age
in 56 years. The natural course of the disease is divided into three phases which
may not be clearly separated from each other: Painful freezing phase (10-36
weeks), adhesive phase (4-12 months) and resolution phase (12-42 months).
Seymore et al.,(2004)
Stated that visual analogue scale has found to be reliable and sensitive tool
for measuring pain with high test-retest reliability.
Ong and Seymour et al.,(2004)
Suggested that visual Analogue Scale has been found to be a reliable and
sensitive tool for measuring pain with high-test retest reliability.
Gould et al., (2003)
Stated that the Visual Analogue Scale is a measurement instrument that
12
Fitz Patrick et al.,(2003)
Stated that adhesive capsulitis is caused by inflammation of the joint capsule
and synovium that eventually results in the formation of capsular contractures.
Clinically there is global loss of both active and passive range of motion of the
glenohumeral joint with external rotation being the most restricted physiological
movement, thus leading to functional limitation.
Dalton et al., (2003)
Stated that adhesive capsulitis is a disabling and painful condition
characterized by the active and passive limitation of the shoulder range of motion
(ROM). Shoulder motion and daily activities are restricted gradually, causing
disability. Primary adhesive capsulitis is characterized by idiopathic fibrosis of the
joint capsule. Secondary adhesive capsulitis occurs following some predisposing
factors or seen together with some diseases. Female gender, age over 40 years,
rotator cuff lesions, diabetes mellitus, thyroid diseases, stroke lung diseases,
myocardial infarction, cervical spine disorders and reflex sympathetic dystrophy
symdrome are the factors associated with adhesive capsulitis.
Wilson et al., (2003)
Muscle Energy Technique (MET) has been described as a valuable treatment
technique because of many claimed therapeutic benefits resulting from a single
13
mechanics and decreasing local edema, mobilizing restricted articulations and
reducing pain and disability.
Kimberley Hayes et al (2001)
Conducted a study that the reliability of five methods for assessing shoulder
range of motion with goniometry has inter-rater rho (0.64-0.69) and intra rater rho
as 0.53-0.65 while assessing shoulder range of motion using goniometry.
Bijur et al, (2001)
Concluded that the Visual Analog Scale is a highly reliable instrument for
measurement of acute pain.
Vermeulen et al., (2000)
Indicated that adherent axillary recess hinders humeral head mobility
resulting in diminished mobility of the shoulder.
Sean and Griggs et al.,2000)
Stated that the Shoulder and Disability is a valid measure and more
responsive than the sickness impact profile to asses pain and disability.
Philip Clure et al.,(2000)
Stated that there is a significant increase in active range of motion following
14
Bang, et al., (2000)
Stated that the application of mobilization techniques optimized conditions
for performing the strengthening exercise by reducing pain.
Strakowski et al.,(2000)
Stated that codman’s exercises are those most frequently used to improve the
range of motion. The emphasis in the therapy is on passive stretching of the
shoulder capsular contracture in all planes of motion.
Myles et al.,(1999)
Stated that Visual Analogue Scale score is a linear scale changes in the
visual analog scale score represents a relative change in the degree of pain
sensation. Visual Analog Scale is comparative trials can help to quantify
differences in patency and efficiency.
Mouliner et al., (1998)
Stated that high intensity mobilization significantly improved pain and
passive range of motion.
Goodridge et al.,(1997)
Defined the muscle energy techniques are osteopathic procedures which are
used to mobilize joints with limitation in movement, stretch tight muscle and
fascia, improve local circulation and balance neuromuscular relationships to alter
15
Williams et al., (1995)
Stated that shoulder pain and disability index (SPADI) is used to assess pain
and routine functional skills of shoulder. A ten reduction in the score accurately
distinguishes between people whose shoulder problems improve and those whose
conditions remain stable and a ten-point gain distinguishes between people whose
shoulder problems are unchanging and those whose problems are worsening.
Denslow et al., (1993)
Stated that effect of muscle energy technique may result from the inhibitory
golgi tendon reflex, activated during the isometric contractions that leads to reflex
relaxation of the muscle, as a result of post isometric relaxation (PIR).
Cox et al.,(1992)
The study on thirteen subjects keeping the pain tool as a Visual Analog
Scale for self reporting of Subjective phenomena in the medical sciences and
concluded that Visual Analogue Scale is valuable instrument fot the observation
overtime for individual subjects.
Roach etal.,(1991)
Stated that a Shoulder Pain and Disability Index was developed to measure
16
Howel ey al., (1988)
Stated that adhesive capsulitis is characterized by an insidious and
progressive loss of active and passive mobility in glenohumeral joint presumably
due to capsular contracture.
Dan et al., (1987)
Stated that incidence of frozen shoulder is slightly higher in women than in
men and is somewhat more common in the non dominant arm. This condition most
frequently affects persons aged 40-60 years.
Richard et al., (1987)
Conducted a study to review the related literature on the reliability and
validity of goniometric measurements of the extremities. They concluded that
clinicians should adopt standardized methods of testing and should interpret and
report gonoiometric results as range of motion measurements only, not as
measurements of factors that may affect range of motion.
Cyriax et al.,(1978)
Suggested that thickness in a joint capsule would result in a pattern of
proportional motion restriction (a shoulder capsular pattern in which external
rotation would be more limited than abduction, which would be more limited than
17
space capacity and restricted range of motion contracted soft tissue around the
shoulder may be related to restricted shoulder range of motion.
Codman (1934)
Stated that adhesive capsulitis is one of the most common and disabling
orthopedic disorder characterized by painful restriction of shoulder motion for
which patients seeks treatment.
Richard et al., (1986)
Stated that primary frozen shoulder is classically described as having three
stages, “Freezing”, “Frozen” and Thawing”. Pain particularly in the first phase
often keeps patients from performing activities of daily living (ADL). In the
second phase, pain appears to be less pronounced but the restriction in active
motion appears to limit the patient in personal care, activities of daily living
(ADL), and occupational activities. In the third phase, there is increase in
18
III METHODOLOGY
3.1 STUDY DESIGN:
Pre test and post test study design.
3.2 STUDY SETTING:
The study was conducted at the Department of physiotherapy, K.G Hospital,
coimbatore.
3.3 STUDY POPULATION:
50 patients with shoulder pain who volunteered for the study were assigned
for the assessment. A blinded assessor does the assessment and the patients were
selected for the study based on strict selection criteria. 40 patients who fulfills the
criteria of adhesive capsulitis were included in the study and they all be divided in
to two equal groups.
3.4 STUDY DURATION:
The study was conducted for a period of one year. Individual subjects
underwent treatment duration of six weeks.
3.5 SELECTION OF SAMPLES:
Total of 40 subjects were included for the study by using simple random
19
3.6 SELECTION OF CRITERIA:
INCLUSIVE CRITERIA:
Adhesive capsulitis patients with limited range of motion of shoulder.
Age group of 40-60 years.
Both male and female patients were included.
Subjects with bilateral and/or unilateral adhesive Capsulitis.
Subjects without type 2 diabetes mellitus.
EXCLUSIVE CRITERIA:
Rotator cuff tears and other shoulder ligament injuries.
History of any arthritis of shoulder.
Reflex sympathetic dystrophy.
Fracture in and around of shoulder joint.
Reduced sensation.
Malignancy.
Peri-arthritis shoulder secondary to fracture
dislocation
20
3.7 VARIABLES:
DEPENDENT VARIABLES:
Pain
Function
Range of motion- Flexion, Extension, Abduction, Internal rotation and
External rotation
INDEPENDENT VARIABLES:
Muscle energy technique
Conservative physiotherapy (Mobilization, Capsular stretches, Codman’s
Pendulum exercises, Pulley exercises).
3.8 PARAMETERS:
Pain
Function
Range of motion- Flexion, Extension, Abduction, Internal rotation and
External rotation.
3.9 OPERATIONAL TOOLS
Visual analogue scale (VAS)
Shoulder Pain and Disability Index (SPADI)
21
3.10 PROCEDURE
40 patients with Adhesive capsulitis who fulfilled inclusion and exclusion
criteria were selected and all the subjects were divided in to 2 groups, 20 subjects
in each group. A clear explanation about the study was given to the selected
patients who agreed to participate. Pain, function and range of motion measures are
taken at the beginning of the first day and at the end of the second week of
treatment.
GROUP A- MUSCLE ENERGY TECHNIQUE
Muscle energy technique (Post isometric relaxation -PIS)
Muscle energy technique is applied for 5 repetition per set, 5 sets per
session, Each repetition is maintained for 10 seconds.
MUSCLE ENERGY TECHNIQUE FOR SHOULDER FLEXION:
Therapist should stand infront of the patient and placed one hand over the
top of the patient’s involved shoulder at the superior part of the scapula and cup the
glenohumeral joint to palpate for motion. The other hand and forearm support the
patient’s flexed elbow and flexed the humerus at the glenohumeral joint in the
sagittal plane up to the initial point of resistance. The patients are directed to
22
MUSCLE ENERGY TECHNIQUE FOR SHOULDER EXTENSION:
Therapist should stand in front of the patients and placed one hand over the
top of the patient’s involved shoulder at the superior part of the scapula and cups
the glenohumeral joint to palpate for motion. Place the other hand to support
patient’s flexed elbow and directed the patient to push the elbow anteriorly.
MUSCLE ENERGY TECHNIQUE FOR SHOULDER ABDUCTION:
Therapist should stand in front of the patient, placed one hand over the top
of patient’s involved shoulder, cups the glenohumeral joint to palpate for motion
and directed the patients to press the elbow towards their body.
MUSCLE ENERGY TECHNIQUE FOR SHOULDER INTERNAL
ROTATION:
Therapist should behind the patient. Carefully place the dorsum of the
patient’s hand of the involved side against the patients back. Therapist placed his
one hand over the top of shoulder and superior part of the scapula and other palm
protecting anterior side of the shoulder capsule and then placed his other hand,
posterior to the patient’s flexed elbow. Directed the patient to “press their elbow
23
MUSCLE ENERGY TECHNIQUE FOR SHOULDER EXTERNAL
ROTATION:
Therapist should stand behind the patient. Placed his hand superior to the
patient’s involved glenohumeral joint. Placed his forearm of the other hand medial
to the patient’s flexed forearm with his hand supporting the patient’s hand and the
wrist and then directed the patients to internally rotate the arm by pressing the
hand.
Frequency of treatment:- One session per day, five days per week.
Treatment duration:- 6 weeks
GROUP B- CONSERVATIVE PHYSIOTHERAPY
Mobilization:
Anterior glide
Posterior glide
Inferior glide
Codman’s pendulum exercises
Pulley exercise
Capsular stretches- Anterior capsule, Posterior capsule, Inferior capsule,
Hold the stretch for 30 seconds for each repetitions
24
STATISTICAL TOOLS:
Paired ‘t’- test
The intra group analysis of results were done with paired ‘t’ test with 5 % level of
significance. Statistical analysis is done using dependent ‘ t’ test
Where,
d=difference between the pre-test Vs post-test
d=mean difference
n=number of observations
25
To compare experimental group and control group
Statistical analysis is done using independent ‘t’ test
Where,
S=Combined standard deviation.
S1 and S2= Standard deviation of experimental and control group respectively.
d1 and d2 = Difference between initial and final readings in control group and
experimental group respectively.
n1= No. of patients in control group
n2== No. of patients in experimental group
26
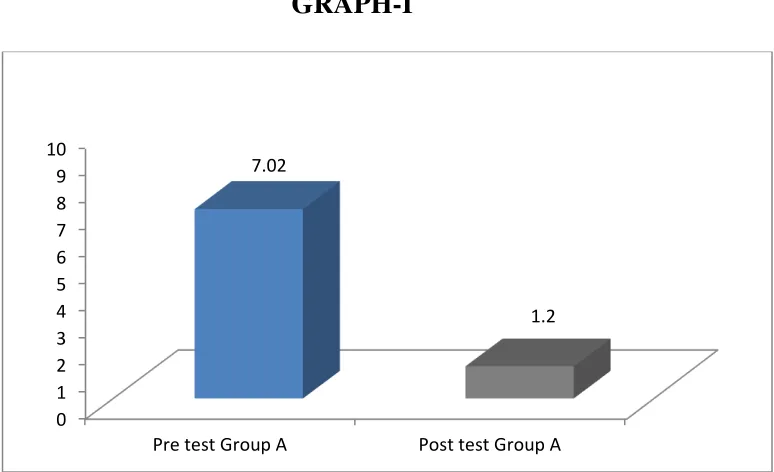
TABLE -I
COMPARISON BETWEEN THE PRE TEST AND POST TEST VALUES
OF GROUP A - VISUAL ANALOGUE SCALE (Paired ‘t’ test)
The table I Analysis of VAS on paired ‘t’ test. The ‘t’ value for Group A was 24.01 at 0.05% level of significance, which was greater than the tabulated ‘t’ value 2.145. The result shows that there was marked difference between pre test and post
test values. GRAPH-I 0 1 2 3 4 5 6 7 8 9 10
Pre test Group A Post test Group A 7.02
1.2 S.N
Group A Mean
Mean Difference
Standard
Deviation Paired ‘t’ Value
1.
Pre test 7.05
±5.85 0.83
24.01
2.
27
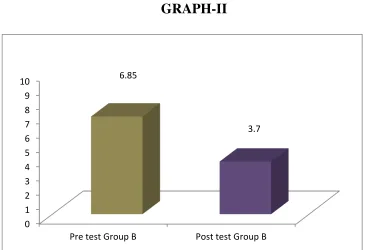
TABLE -II
COMPARISON BETWEEN THE PRE TEST AND POST TEST VALUES
OF GROUP B - VISUAL ANALOGUE SCALE (Paired ‘t’ test) S.N
Group B Mean
Mean Difference
Standard
Deviation Paired ‘t’ Value
1.
Pre test 6.85
± 3.15 0.81 16.09 2.
Post test 3.70 0.98
The table II shows analysis of VAS on paired‘t’ test. The‘t’ test value for Group B was 16.09 at 0.05% level of significance, which was greater than the tabulated ‘t’ value 2.145. The result shows that there was marked difference between pre test
and post test values.
GRAPH-II -0 1 2 3 4 5 6 7 8 9 10
Pre test Group B Post test Group B 6.85
28
TABLE -III
COMPARISON BETWEEN THE PRE TEST AND POST TEST VALUES
OF GROUP A - SPADI (Paired ‘t’ test)
The table III shows analysis of SPADI on paired ‘t’ test. The ‘t’ value for Group A was 60.62 at 0.05% level of significance, which was greater than the tabulated ‘t’ value 2.145. The result shows that there was marked difference between pre test
and post test values
GRAPH -III 0 10 20 30 40 50 60 70 80 90 100
Pre test Group A Post test Group A 86.65
12.5 S.N
Group A Mean
Mean Difference
Standard
Deviation Paired ‘t’ Value
1.
Pre test 86.65
±74.15 5.89 60.62 2.
29
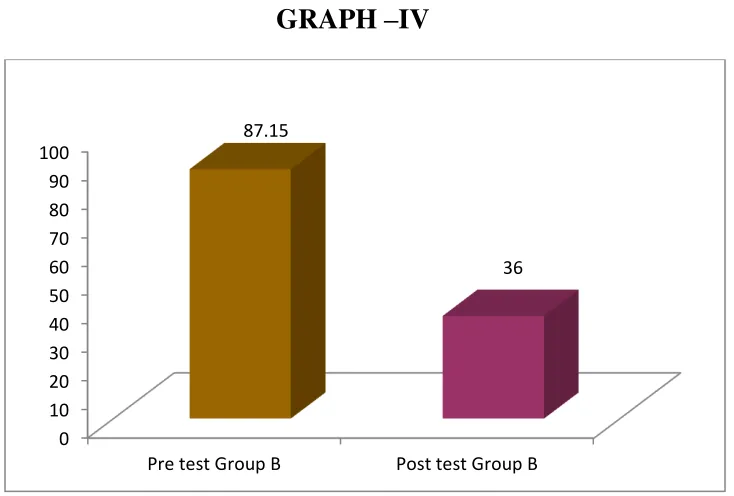
TABLE –IV
COMPARISON BETWEEN THE PRE TEST AND POST TEST VALUES
OF GROUP B - SPADI (Paired ‘t’ test) S.N
Group B Mean
Mean Difference
Standard
Deviation Paired ‘t’ Value
1.
Pre test 87.15
±51.15 6.70 24.76 2.
Post test 36.00 5.65
The table IV shows analysis of SPADI on paired ‘t’ test. The ‘t’ value for Group B was 24.76 at 0.05% level of significance, which was greater than the tabulated ‘t’ value 2.145. The result shows that there was marked difference between pre test
and post test values.
GRAPH –IV
0 10 20 30 40 50 60 70 80 90 100
Pre test Group B Post test Group B 87.15
[image:39.612.114.481.467.715.2]30 TABLE -V
COMPARISON BETWEEN THE PRE TEST AND POST TEST VALUES
OF FLEXION IN GROUP A – GONIOMETER (Paired ‘t’ test) S.N
Group A Mean
Mean Difference
Standard
Deviation Paired ‘t’ Value
1.
Pre test 96.30
±38.65 1.75 10.44 2.
Post test 134.95 16.64
The table V shows analysis of GONIOMETER on paired ‘t’ test. The ‘t’ value for Group A was 10.44 at 0.05% level of significance, which was greater than the
tabulated ‘t’ value 2.145. The result shows that there was marked difference between pre test and post test values.
GRAPH –V
0 20 40 60 80 100 120 140
Pre test Group A Post test Group A 96.3
31
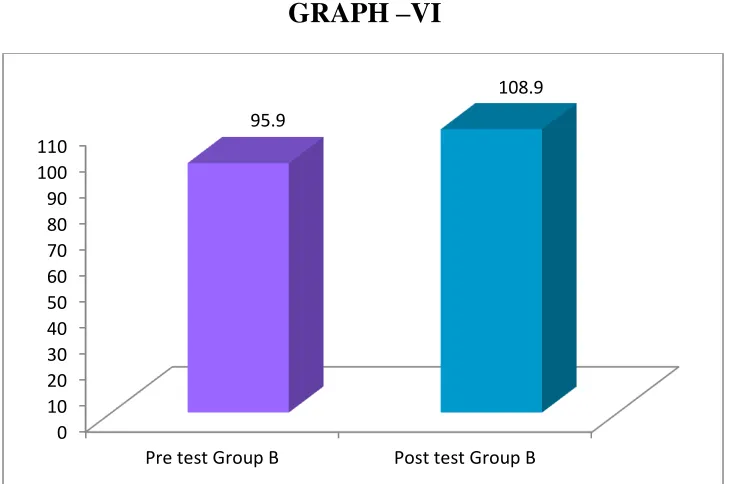
TABLE -VI
COMPARISON BETWEEN THE PRE TEST AND POST TEST VALUES
OF FLEXION GROUP B – GONIOMETER (Paired ‘t’ test) S.N
Group B Mean
Mean Difference
Standard
Deviation Paired ‘t’ Value
1.
Pre test 95.90
±13.00 1.89
10.16
2.
Post test 108.90 5.59
The table VI shows analysis of GONIOMETER on paired ‘t’ test. The ‘t’ value for Group B was 10.16 at 0.05% level of significance, which was greater than the
tabulated ‘t’ value 2.145. The result shows that there was marked difference between pre test and post test values.
GRAPH –VI
0 10 20 30 40 50 60 70 80 90 100 110
Pre test Group B Post test Group B 95.9
32 TABLE -VII
COMPARISON BETWEEN THE PRE TEST AND POST TEST VALUES
OF EXTENSION GROUP A – GONIOMETER (Paired ‘t’ test) S.N
Group A Mean
Mean Difference
Standard
Deviation Paired ‘t’ Value
1.
Pre test 42.90
±12.15 2.36 17.06 2.
Post test 55.05 2.68
The table VII shows analysis of GONIOMETER on paired ‘t’ test. The ‘t’ value for Group A was 17.06 at 0.05% level of significance, which was greater than the
tabulated ‘t’ value 2.145. The result shows that there was marked difference between pre test and post test values.
GRAPH –VII
0 10 20 30 40 50 60
Pre test Group A Post test Group A 42.9
33
TABLE -VIII
COMPARISON BETWEEN THE PRE TEST AND POST TEST VALUES
OF EXTENSION GROUP B – GONIOMETER (Paired ‘t’ test) S.N
Group B Mean
Mean Difference
Standard
Deviation Paired ‘t’ Value
1.
Pre test 42.65
±3.15 2.28 7.764 2.
Post test 45.80 2.12
The table VIII shows analysis of GONIOMETER on paired ‘t’ test. The ‘t’ value for Group B was 7.764 at 0.05% level of significance, which was greater than the
tabulated ‘t’ value 2.145. The result shows that there was marked difference between pre test and post test values.
GRAPH –VIII
0 10 20 30 40 50
Pre test Group B Post test Group B
34 TABLE -IX
COMPARISON BETWEEN THE PRE TEST AND POST TEST VALUES
OF ABDUCTION IN GROUP A – GONIOMETER (Paired ‘t’ test) S.N
Group A Mean
Mean Difference
Standard
Deviation Paired ‘t’ Value
1.
Pre test 108.30 ±39.80 9.03 10.90 2.
Post test 148.10 16.62
The table IX shows analysis of GONIOMETER on paired ‘t’ test. The ‘t’ value for Group A was 10.90 at 0.05% level of significance, which was greater than the
tabulated ‘t’ value 2.145. The result shows that there was marked difference between pre test and post test values
GRAPH –IX
0 20 40 60 80 100 120 140 160
Pre test Group A Post test Group A 108.3
35 TABLE -X
COMPARISON BETWEEN THE PRE TEST AND POST TEST VALUES
OF ABDUCTION IN GROUP B – GONIOMETER (Paired ‘t’ test) S.N
Group B Mean
Mean Difference
Standard
Deviation Paired ‘t’ Value
1.
Pre test 109.90 ±6.95 9.03 10.18 2.
Post test 116.85 8.92
The table X shows analysis of GONIOMETER on paired ‘t’ test. The ‘t’ value for Group B was 10.18 at 0.05% level of significance, which was greater than the
tabulated ‘t’ value 2.145. The result shows that there was marked difference between pre test and post test values.
GRAPH –X
0 20 40 60 80 100 120
Pre test Group B Post test Group B
36 TABLE -XI
COMPARISON BETWEEN THE PRE TEST & POST TEST VALUES OF
INTERNAL ROTATION IN GROUP A – GONIOMETER (Paired ‘t’ test) S.N
Group A Mean
Mean Difference
Standard
Deviation Paired ‘t’ Value
1.
Pre test 38.80
±16.00 4.44 12.54 2.
Post test 54.80 4.26
The table XI shows analysis of GONIOMETER on paired ‘t’ test. The ‘t’ value for Group A was 12.54 at 0.05% level of significance, which was greater than the
tabulated ‘t’ value 2.145. The result shows that there was marked difference between pre test and post test values.
GRAPH –XI
0 10 20 30 40 50 60
Pre test Group A Post test Group A 38.8
37
TABLE -XII
COMPARISON BETWEEN THE PRE TEST & POST TEST VALUES OF
INTERNAL ROTATION IN GROUP B – GONIOMETER (Paired ‘t’ test) S.N
Group B Mean
Mean Difference
Standard
Deviation Paired ‘t’ Value
1.
Pre test 40.70
±4.10 3.64 10.33 2.
Post test 44.80 3.71
The table XII shows analysis of GONIOMETER on paired ‘t’ test. The ‘t’ value for Group B was 10.33 at 0.05% level of significance, which was greater than the
tabulated ‘t’ value 2.145. The result shows that there was marked difference between pre test and post test values.
GRAPH –XII
0 10 20 30 40 50
Pre test Group B Post test Group B 40.7
38
TABLE -XIII
COMPARISON BETWEEN THE PRE TEST & POST TEST VALUES OF
EXTERNAL ROTATION IN GROUP A – GONIOMETER (Paired ‘t’ test) S.N
Group A Mean
Mean Difference
Standard
Deviation Paired ‘t’ Value
1.
Pre test 31.35
±37.25 5.90 17.73 2.
Post test 68.60 5.39
The table XIII shows analysis of GONIOMETER on paired ‘t’ test. The ‘t’ value for Group A was 17.73 at 0.05% level of significance, which was greater than the
tabulated ‘t’ value 2.145. The result shows that there was marked difference between pre test and post test values.
GRAPH –XIII
0 10 20 30 40 50 60 70
Pre test Group A Post test Group A 31.35
39
TABLE -XIV
COMPARISON BETWEEN THE PRE TEST & POST TEST VALUES OF
EXTERNAL ROTATION IN GROUP B – GONIOMETER (Paired ‘t’ test) S.N
Group B Mean
Mean Difference
Standard
Deviation Paired ‘t’ Value
1.
Pre test 32.40
±8.30 5.25 13.20 2.
Post test 40.70 5.91
The table XIV shows analysis of GONIOMETER on paired ‘t’ test. The ‘t’ value for Group B was 13.20 at 0.05% level of significance, which was greater than the
tabulated ‘t’ value 2.145. The result shows that there was marked difference between pre test and post test values.
GRAPH –XIV
0 10 20 30 40 50
Pre test Group B Post test Group B 32.4
40
TABLE -XV
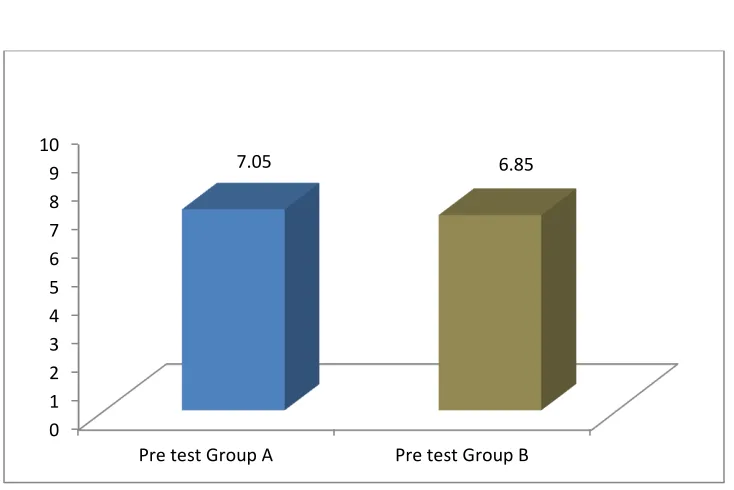
COMPARISON BETWEEN THE PRE TEST VALUES OF GROUP A AND
GROUP B - VISUAL ANALOGUE SCALE (Unpaired ‘t’ test)
S.N Groups Mean
Mean Difference
Standard
Deviation Un paired ‘t’ Value
1.
Group A 7.05
±0.20 0.83 0.7721 2.
Group B 6.85 0.81
The table XV shows analysis of VAS on unpaired ‘t’ test. The pre test value for Group A and Group B was 0.77 at 0.05% level of significance, which was lesser
than the tabulated ‘t’ value 2.048. The result shows that there was no marked difference between Group A and Group B.
GRAPH -XV 0 1 2 3 4 5 6 7 8 9 10
Pre test Group A Pre test Group B
41
TABLE -XVI
COMPARISON BETWEEN THE POST TEST VALUES OF GROUP A
AND GROUP B - VISUAL ANALOGUE SCALE (Unpaired ‘t’ test)
S.N Groups Mean
Mean Difference
Standard
Deviation Un paired ‘t’ Value
1.
Group A 1.20
±2.50 0.83 8.697 2.
Group B 3.70 0.98
The table XVI shows analysis of VAS on unpaired ‘t’ test. The post test value for Group A and Group B was 8.697 at 0.05% level of significance, which was greater
than the tabulated ‘t’ value 2.048. The result shows that there was marked difference between Group A and Group B.
GRAPH -XVI 0 0.5 1 1.5 2 2.5 3 3.5 4
Post test Group A Post test Group B 1.2
42
TABLE -XVII
COMPARISON BETWEEN THE PRE TEST VALUES OF GROUP A AND
GROUP B - SPADI (Unpaired ‘t’ test)
S.N Groups Mean
Mean Difference
Standard
Deviation Un paired ‘t’ Value
1.
Group A 86.65
±0.50 5.89 0.250 2.
Group B 87.15 6.70
The table XVII shows analysis of SPADI on unpaired ‘t’ test. The pre test value for Group A and Group B was 0.250 at 0.05% level of significance, which was
lesser than the tabulated ‘t’ value 2.048. The result shows that there was no marked difference between Group A and Group B.
GRAPH -XVII 0 10 20 30 40 50 60 70 80 90 100
Pre test Group A Pre test Group B
43
TABLE -XVIII
COMPARISON BETWEEN THE POST TEST VALUES OF GROUP A
AND GROUP B - SPADI (Unpaired ‘t’ test)
S.N Groups Mean
Mean Difference
Standard
Deviation Un paired ‘t’ Value
1.
Group A 12.50
±23.50 2.04 17.50 2.
Group B 36.00 5.65
The table XVII shows analysis of SPADI on unpaired ‘t’ test. The post test value for Group A and Group B was 17.50 at 0.05% level of significance, which was
greater than the tabulated ‘t’ value 2.048. The result shows that there was marked difference between Group A and Group B.
GRAPH –XVIII
0 5 10 15 20 25 30 35 40
Post test Group A Post test Group B 12.5
44
TABLE -XIX
COMPARISON BETWEEN THE PRE TEST VALUES OF FLEXION IN
GROUP A AND GROUP B – GONIOMETER (Unpaired ‘t’ test)
S.N Groups Mean
Mean Difference
Standard
Deviation Un paired ‘t’ Value
1.
Group A 96.30
±0.40 1.75 0.694 2.
Group B 95.90 1.89
The table XIX shows analysis of GONIOMETER on unpaired ‘t’ test. The pre test value for Group A and Group B was 0.694 at 0.05% level of significance, which
was greater than the tabulated ‘t’ value 2.048. The result shows that there was marked difference between Group A and Group B.
GRAPH -XIX 0 10 20 30 40 50 60 70 80 90 100
Pre test Group A Pre test Group B
45
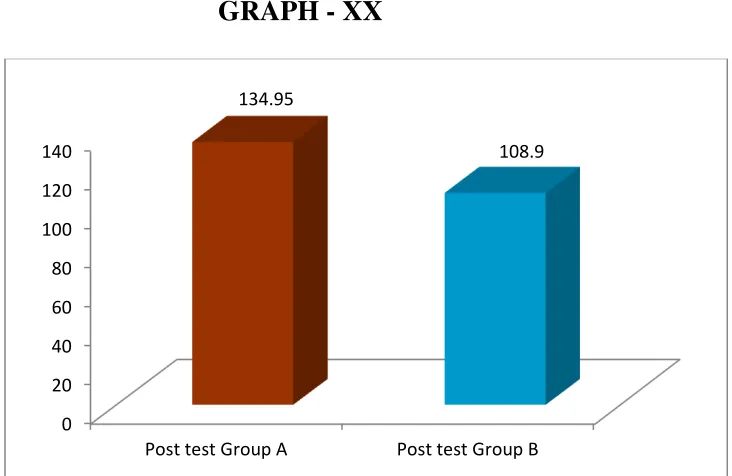
TABLE -XX
COMPARISON BETWEEN THE POST TEST VALUES OF FLEXION IN
GROUP A AND GROUP B – GONIOMETER (Unpaired ‘t’ test)
S.N Groups Mean
Mean Difference
Standard
Deviation Un paired ‘t’ Value
1.
Group A 134.95 ±26.05 16.64 6.637 2.
Group B 108.90 5.59
The table XX shows analysis of GONIOMETER on unpaired ‘t’ test. The post test value for Group A and Group B was 6.637 at 0.05% level of significance, which
was greater than the tabulated ‘t’ value 2.048. The result shows that there was marked difference between Group A and Group B.
GRAPH - XX
0 20 40 60 80 100 120 140
Post test Group A Post test Group B 134.95
46 TABLE -XXI
COMPARISON BETWEEN THE PRE TEST VALUES OF EXTENSION
GROUP A AND GROUP B – GONIOMETER (Unpaired ‘t’ test)
S.N Groups Mean
Mean Difference
Standard
Deviation Un paired ‘t’ Value
1.
Group A 42.90
±0.25 2.36 0.340 2.
Group B 42.65 2.28
The table XXI shows analysis of GONIOMETER on unpaired ‘t’ test. The pre test value for Group A and Group B was 0.340 at 0.05% level of significance, which
was greater than the tabulated ‘t’ value 2.048. The result shows that there was marked difference between Group A and Group B.
GRAPH -XXI 0 5 10 15 20 25 30 35 40 45 50
Pre test Group A Pre test Group B
47
TABLE -XXII
COMPARISON BETWEEN THE POST TEST VALUES OF EXTENSION
IN GROUP A AND GROUP B – GONIOMETER (Unpaired ‘t’ test)
S.N Groups Mean
Mean Difference
Standard
Deviation Un paired ‘t’ Value
1.
Group A 55.05
±9.25 2.68 12.097 2.
Group B 45.80 2.12
The table XXII shows analysis of GONIOMETER on unpaired ‘t’ test. The post test value for Group A and Group B was 12.097 at 0.05% level of significance,
which was greater than the tabulated ‘t’ value 2.048. The result shows that there was marked difference between Group A and Group B.
GRAPH -XXII 0 10 20 30 40 50 60
Post test Group A Post test Group B 55.05
48
TABLE -XXIII
COMPARISON BETWEEN THE PRE TEST VALUES OF ABDUCTION
GROUP A AND GROUP B – GONIOMETER (Unpaired ‘t’ test)
S.N Groups Mean
Mean Difference
Standard
Deviation Un paired ‘t’ Value
1.
Group A 108.30 ±1.55 9.03 0.541 2.
Group B 109.85 9.06
The table XXIII shows analysis of GONIOMETER on unpaired ‘t’ test. The pre test value for Group A and Group B was 0.541 at 0.05% level of significance,
which was greater than the tabulated ‘t’ value 2.048. The result shows that there was marked difference between Group A and Group B.
GRAPH -XXIII 0 20 40 60 80 100 120
Pre test Group A Pre test Group B
49
TABLE -XXIV
COMPARISON BETWEEN THE POST TEST VALUES OF ABDUCTION
IN GROUP A AND GROUP B – GONIOMETER (Unpaired ‘t’ test)
S.N Groups Mean
Mean Difference
Standard
Deviation Un paired ‘t’ Value
1.
Group A 149.40
±32.55 14.72
8.455
2.
Group B 116.85 8.92
The table XXIV shows analysis of ROM on unpaired ‘t’ test. The post test value for Group A and Group B was 8.455 at 0.05% level of significance, which was
greater than the tabulated ‘t’ value 2.048. The result shows that there was marked difference between Group A and Group B.
GRAPH -XXIV 0 20 40 60 80 100 120 140 160
Post test Group A Post test Group B 149.4
50
TABLE -XXV
COMPARISON BETWEEN THE PRE TEST VALUES OF INTERNAL
POTATION IN GROUP A & GROUP B– GONIOMETER (Unpaired ‘t’ test)
S.N Groups Mean
Mean Difference
Standard Deviation
Un paired ‘t’
Value
1.
Group A 38.80
±1.90 4.44 1.478 2.
Group B 40.70 3.64
The table XIX shows analysis of ROM on unpaired ‘t’ test. The pre test value for Group A and Group B was 1.478 at 0.05% level of significance, which was greater
than the tabulated ‘t’ value 2.048. The result shows that there was marked difference between Group A and Group B.
GRAPH -XXV 0 5 10 15 20 25 30 35 40 45
Pre test Group A Pre test Group B
51
TABLE -XXVI
COMPARISON BETWEEN THE POST TEST VALUES OF INTERNAL
ROTATION INGROUP A & GROUP B– GONIOMETER (Unpaired ‘t’ test)
S.N Groups Mean
Mean Difference
Standard
Deviation Un paired ‘t’ Value
1.
Group A 54.80
±10.00 4.26 7.916 2.
Group B 44.80 3.71
The table XXVI shows analysis of GONIOMETER on unpaired ‘t’ test. The post test value for Group A and Group B was 7.916 at 0.05% level of significance,
which was greater than the tabulated ‘t’ value 2.048. The result shows that there was marked difference between Group A and Group B.
GRAPH -XXVI 0 10 20 30 40 50 60
Post test Group A Post test Group B 54.8
52
TABLE -XXVII
COMPARISON BETWEEN THE PRE TEST VALUES OF EXTERNAL
ROTATION IN GROUP A & GROUP B– GONIOMETER (Unpaired ‘t’ test)
S.N Groups Mean
Mean Difference
Standard
Deviation Un paired ‘t’ Value
1.
Group A 31.35
±1.05 5.90 0.595 2.
Group B 32.40 5.25
The table XXVII shows analysis of GONIOMETER on unpaired ‘t’ test. The pre test value for Group A and Group B was 0.595 at 0.05% level of significance,
which was greater than the tabulated ‘t’ value 2.048. The result shows that there was marked difference between Group A and Group B.
GRAPH -XXVII 0 5 10 15 20 25 30 35
Pre test Group A Pre test Group B
53
TABLE -XXVIII
COMPARISON BETWEEN THE POST TEST VALUES OF EXTERNAL
ROTATION IN GROUP A & GROUP B– GONIOMETER (Unpaired ‘t’ test)
S.N Groups Mean
Mean Difference
Standard
Deviation Un paired ‘t’ Value
1.
Group A 68.60
±27.90 5.39 15.59 2.
Group B 40.70 5.91
The table XXVIII shows analysis of ROM on unpaired ‘t’ test. The post test value for Group A and Group B was 15.59 at 0.05% level of significance, which was
greater than the tabulated ‘t’ value 2.048. The result shows that there was marked difference between Group A and Group B.
GRAPH -XXVIII 0 10 20 30 40 50 60 70
Post test Group A Post test Group B 68.6
54
RESULT
The paired ‘t’ test analysis for the pre test and post test variable for the
visual analogue scale for measuring pain in patients with adhesive capsulitis which
was shown in the table I & II
Both the groups show significant differences in the pre test and post test
values. The ‘t’ value for the group A is 24.0145 , the value for the group B is
16.0980.
The unpaired ‘t’ test analysis for the post test variables for the both group for
visual analog scale for measuring pain in patients with adhesive capsulitis is shown
in the table XVI. There was a significant difference shown between the Groups.
Subjects in Group A show superior mean difference than Group B. The ‘t’ value
for the post test variables for both group is 8.6970.
The paired ‘t’ test analysis for the pre test and post test variables for the
shoulder pain and disability index for measuring disability in patients with
adhesive capsulitis which was shown in table III & IV.
Both the group show significant differences in the pre test and post test
values. The ‘t’ value for the Group A is 60.6204, the ‘t’ value for the Group B is
24.7689.
The unpaired ‘t’ test analysis for the post test variables for the both group for
55
adhesive capsulitis is shown in the table XVIII. There was a significant difference
shown between the Groups. Subjects in Group A show superior mean difference
than group B. The ‘t’ value for the post test variables for both group is 17.5031.
The paired ‘t’ test analysis for the pre test and post test variable for the
goniometer for measuring range of motion (flexion) in patients with adhesive
capsulitis which was shown in the table V & VI.
Both the groups show significant differences in the pre test and post test
values. The ‘t’ value for the group A is 10.4496, the value for the group B is
10.1611.
The unpaired ‘t’ test analysis for the post test variables for the both group for
goniometer for measuring range of motion (flexion) in patients with adhesive
capsulitis is shown in the table XX. There was a significant difference shown
between the Groups. Subjects in Group A show superior mean difference than
Group B. The ‘t’ value for the post test variables for both group is 6.6377.
The paired ‘t’ test analysis for the pre test and post test variable for
goniometer for measuring range of motion (Extension) in patients with adhesive
capsulitis which was shown in the table VII & VIII .
Both the groups show significant differences in the pre test and post test
values. The ‘t’ value for the group A is 17.0685, the value for the group B is
56
The unpaired ‘t’ test analysis for the post test variables for the both group for
goniometer for measuring range of motion (Extension) in patients with adhesive
capsulitis is shown in the table XXII. There was a significant difference shown
between the Groups. Subjects in Group A show superior mean difference than
Group B. The ‘t’ value for the post test variables for both group is12.0979.
The paired ‘t’ test analysis for the pre test and post test variable for the
goniometer for measuring range of motion (Abduction) in patients with adhesive
capsulitis which was shown in the table IX & X.
Both the groups show significant differences in the pre test and post test
values. The ‘t’ value for the group A is 10.9077, the value for the group B is
10.1848.
The unpaired ‘t’ test analysis for the post test variables for the both group for
goniometer for measuring range of motion (Abduction) in patients with adhesive
capsulitis is shown in the table XXIV. There was a significant difference shown
between the Groups. Subjects in Group A show superior mean difference than
Group B. The ‘t’ value for the post test variables for both group is 8.4554.
The paired ‘t’ test analysis for the pre test and post test variable for the
goniometer for measuring range of motion (Internal rotation) in patients with
57
Both the groups show significant differences in the pre test and post test
values. The ‘t’ value for the group A is 12.5464 , the value for the group B is
10.3353.
The unpaired ‘t’ test analysis for the post test variables for the both group for
goniometer for measuring range of motion (Internal rotation) in patients with
adhesive capsulitis is shown in the table XXVI. There was a significant difference
shown between the Groups. Subjects in Group A show superior mean difference
than Group B. The ‘t’ value for the post test variables for both group is 7.9161.
The paired ‘t’ test analysis for the pre test and post test variable for the
goniometer for measuring range of motion (External rotation) in patients with
adhesive capsulitis which was shown in the table XIII & XIV.
Both the groups show significant differences in the pre test and post test
values. The ‘t’ value for the group A is 17.7384, the value for the group B is
13.2019. The unpaired ‘t’ test analysis for the post test variables for the both group
for goniometer for range of motion (External rotation) in patients with adhesive
capsulitis is shown in the table XXVIII. There was a significant difference shown
between the Groups. Subjects in Group A show superior mean difference than
58
VI DISCUSSION
The purpose of the study is to find out the effect of Muscle energy technique
and Conservative exercises on pain, range of motion and shoulder function in
adhesive capsulitis. 40 patients who complain of shoulder pain were diagnosed as
adhesive capsulitis by the orthopedician were selected for the study using stratified
sampling method. All were subjects were divided into two equal groups, 20
subjects in each group. Group A Subjects underwent Muscle energy technique for
shoulder with Conservative exercises whereas Group B receives Conservative
exercises.
Adhesive capsulitis has an incidence of 3–5% in the general population and
up to 20% in those with diabetes. This disorder is one of the most common
musculoskeletal problems seen in orthopedics. (Bridgman et al., 1972, Pal et al.,
1986). Adhesive capsulitits has significant loss of its range of motion in all
directions and severe pain around the shoulder. Despite many researches in the last
century, the etiology and pathology of the Adhesive Capsulitis remains enigmatic.
(Wadsworth 1986). Most of cases the Frozen Shoulders is idiopathic (Primary), but
some may be associated with certain factors such as diabetes Mellitus, Spinal
Lesion, Trauma or Prolonged Immobilization of the shoulders for some other