hands on
Pen ink as an ultraviolet
dosimeter
by Nathan Downs, Joanna Turner, Alfio Parisi, Jenny Spence
A technique for using highlighter ink as an ultraviolet dosimeter has been developed for use by
secondary school students. The technique requires the students to measure the percentage
of colour fading in ink drawn onto strips of paper that have been exposed to sunlight, which
can be calibrated to measurements of the uttravioiet irradiance using an inexpensive and
readiiy available pocket-sized meter. The concepts introduced in the article provide students
with simple computer image processing and scientific measurement skilis that enhance
understanding of the ultravioiet environment. The methods presented in this article aliow
schooi students to make accurate measurements of personal uttravioiet exposure using self
made and calibrated ultraviolet dosimeters which until now have not been readily available
to schoois.
Introduction
T
he ultraviolet environment in Australia presents a significant risk to school-aged children. The development of skin cancers (both non melanoma and melanoma) is strongly associated with exposure to ultraviolet radiation (UV) occurring naturally in sunlight. Furthermore, the risks associated with developing skin cancer are closely related to both the long-term and occasional severe episodes of sunburn that occur during childhood (Armstrong 1988; Longstreth 1998). For school-aged children, developing an understanding of the UV environment plays a critical role in reducing the rates of skin cancer, which in Australia are the highest in the world (Staples ei ai. 1999; MacKie 1998).A technique was previously presented for the measurement of the UV index by school children using pocket-sized UV irradiance meters (Downs ei al. 2008). The use of these meters is extended in this article to demonstrate techniques used to calibrate UV dosimeters which can be used to measure personal UV exposure.
Calibrated measurements of personal UV exposure have been performed accurately over the past 30 years with the use of polysulphone and poly 2,6-dimethyl-l ,4-phenylene oxide
Volume 54 1 Number 4 \ December 2008
polymer dosimeters (Davis ei al. 1976a; Davis ef al. 1976b). These polymers exhibit variations in optical opacity which are similar to the erythemal or sunburning response of human skin in the terrestrial UV waveband (280 nm to 400 nm). Measurements of the change in optical opacity of these polymers before and after exposure to UV radiation can be calibrated to the cumulative sunburning or erythemal UV exposure. Typically this involves measuring the cumulative UV exposure received on a series of polymer dosimeters which are removed from the UV radiation source (sunlight) after set periods of time. A calibration curve of cumulative UV exposure (y-axis) plotted against the measured change in optical absorbency (x-axis) for each dosimeter removed after set periods of time can then be used to determine the UV exposure of a dosimeter placed in an unknown UV environment. Polymer dosimeters calibrated in this way have been used to measure the personal UV exposure of human subjects over periods extending from several hours to several days.
However, the quantification of the degradation of these polymers requires the use of spectrophotometers which are generally not available in schools. A new type of dosimeter based on the fading of pen ink and using resources that are available or can be acquired
in schools is described in this article. The procedure outlined in this article can be used to measure UV exposures from periods as short as several hours to periods of several weeks. The calibration technique is reproduced here using the degree of colour fading ink drawn onto paper, calibrated against the measured UV exposure.
Measurements of cumulative UV exposure are usually reported in MED (minimum erythema dose) or SED (standard erythema dose), where 1 MED represents the erythemally effective UV which causes perceptive erythema in fair-skinned individuals 12 to 24 hours following exposure (approximately 215 Jm^), and 1 SED represents 100 Jm- of erythemally effective UV. Either of these units can be used to make a reasonable assessment of the severity of a sunburning exposure. The UV meters used here, which are readily available from electronics suppliers (Jaycar 2008) for less than $30, record the erythemally effective irradiance in units of mWm '. For the dosimeter calibration procedure outlined in the sections to follow, the erythemally effective UV irradiance was averaged between the first and last irradiance recorded over each dosimeter exposure period and divided by 1000 to convert to Wm •'. The erythemally effective exposure measured over the period was then calculated by
1. 2. 3. 4. 5. 6.
multiplying the average erylhemally effective irradiance by the numlïer of seconds in the period. That is, the UV exposure measured in (m^ is calculated by converting tbe UV irradiance measured in Wm -, recognising that 1 W is tbe equivalent of Us'.
Materials and methods
Students performing this activity will need: UV irradiance meter
Highlighter pen Paper strips
Digital camera or digital scanner
Access to a computer with photo-processing software Hat and sunscreen protection
Making the dosimeter strips
Dosimeters were made out of strips of paper with the size 1 cm X 15 cm exposed on a horizontal plane (Eigure 1 ). Suggested variations to tbe paper used include coffee filter paper whicb is easy to obtain, or tbe standard filter paper used in laboratories. The pen ink was applied as a single stripe across one end of the paper strip, leaving tbe other end to be used for handling, and for marking or writing details about each particular strip. A purple bigbligbter was selected as tbe most appropriate colour to use, due to the combination of primary colours within the ink. Previous tests indicate that UV exposure causes tbe blue component of the ink to fade, leaving a pink residue still visible. Highlighters have a broad nib, allowing for a fairly even spread of ink over a larger area, applied in one stroke. The ink of the highlighter is water based and also penetrates tbe paper easily, which means it cannot be removed by accidental touch, unlike some oil-based inks.
Calibrating the UV exposure
UV exposures presented in this article have been calibrated to tbe erytbemally effective UV exposure in units of SED, although MED units may be preferred. Table 1 lists the recorded erythemally effective UV irradiance {mWm ^), erythemally effective UV exposure {SED) measured during each exposure period, the cumulative erythemally effective UV exposure {SED) and dosimeter numbers 1 through to 12. Dosimeter strips were exposed on 24 August 2008 starting at 8:00 am and finishing at 4:00 pm. The dosimeter strips were removed at selected time intervals to allow cumulative UV exposure over the day. Dosimeters 1 to 4 were removed after consecutive 15 minute {900 second) exposures, dosimeters 5 and 6 were removed after consecutive 30 minute {1800 second) exposures and dosimeters 7 to 12 were removed after consecutive one bour {3600 second) exposures. At the time of exposing the dosimeter strips, and each time a dosimeter strip was removed, tbe UV irradiance was measured with the handheld UV irradiance meter. During the measurement it is important to hold tbe UV irradiance meter perpendicular to the surface on which the dosimeter strips are situated (as pictured in Figure 1 ). The calculations applied to these measurements are outlined in tbe introduction of this paper.
[image:2.588.306.566.37.238.2]Teachers may find hourly exposures from 9:00 am to 3:00 pm suitable for calibrating dosimeter strips during summer montbs when the UV exposure will be higb but may prefer to calibrate over several days during winter months in order to obtain tbe degree of colour fading necessary to produce an accurate calibration curve. Periods of frequent cloud will reduce the accuracy of exposure measurements over exposure intervals, as these are made by determining the average of the starting and ending exposure interval irradiance, which will be dependent on cloud cover. The calibration information provided in Table 1 was recorded on a reasonably clear day.
Figure 1. Dosimeter strips exposed on a horizontal plane at the University of Southern Queensland Toowoomba campus atmospherics research station. The handheid UV irradiance meter is the small device near the paper strips. In the background is the UV spectroradiometer and full sky monitor.
Measuring dosimeter colour fade
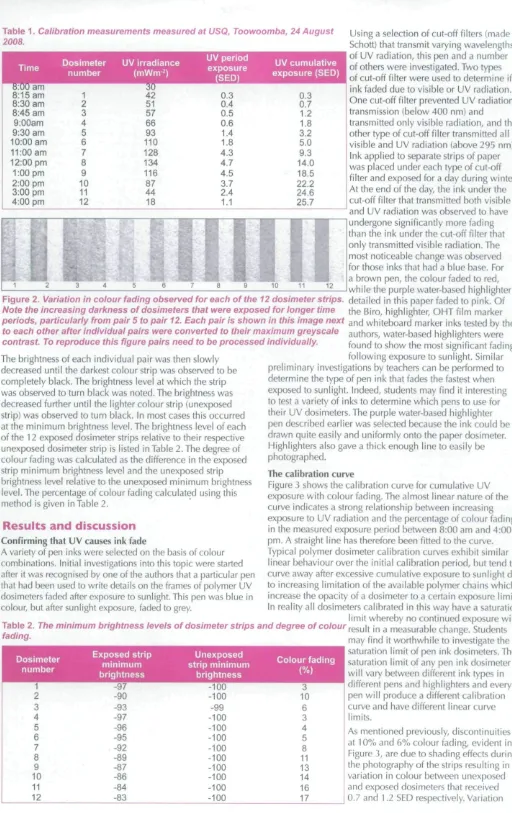
An unexposed dosimeter strip was placed next lo each of Ihe 12 exposed dosimeters which were flash photographed in turn to provide a comparison of the degree of colour fading. Each of 12 pairs comparing tbe unexposed dosimeter strip colour to tbe exposed strip colour were then processed using Microsoft Office Picture Manager {similar picture editing software could also be used). In order to make a better comparison, the colour strips {measuring approximately 2 mm in width) were electronically cut and pasted Into composite pairs and enlarged. Each of the 12 pairs Is shown in Figure 2 following conversion into greyscale with the image contrast increased to tbe maximum level. In the figure, the lighter strip is the unexposed dosimeter that was photographed next to each exposed dosimeter. The unexposed strip should appear to bave tbe same level of brightness in each comparison as ¡t represents a colour tbat was not affected by cumulative exposure
to sunlight. Variations in the brightness of the unexposed dosimeter strip were due to variations in camera angle and position when each pair was photographed. This variation increases the error in the resultant calibration curve, whicb is particularly evident in Figure 3 and is caused by comparisons of dosimeter pairs 2 and 3 in Figure 2. Here, the unexposed dosimeter strip appears brighter than otber comparisons in pair 2 and darker than other comparisons in pair 3. When preparing a dosimeter calibration curve pairs that result In
erroneous comparisons may be left out. Note also tbat a more
accurate curve will be produced for dosimeters exposed over longer periods of time as will experience a greater degree of
fading. The steps required to produce Figure 3 are outlined
below.
Step!: Individual pairs (1 through 12) were opened in Microsoft Office Picture Manager and the following colour settings were adjusted to convert each pair into a greyscale
image:
Amount = 0 Saturation = 0
Step 2: Tbe contrast of the greyscale image of each pair was
maximised to increase the greyscale contrast between the unexposed and exposed dosimeter:
Contrast = 100
Table 1. Calibration measurements measured at USQ, Toowoomba, 24 August 2008.
Ö:UU am 8:15 am 8:30 am 8:45 am 9:00am 9:30 am 10:00 am 11:00 am 12:00 pm 1:00 pm 2:00 pm 3:00 pm 4:00 pm 1
2
3
4
5
6 7 8 9 10 11 12Dosimeter UV irradiance number (mWm-^) 30 42 51 57 66 93 110 128 134 116
m
44 18 0.3 0.4 Ö.5 0.6 1.4 1.8 4.3 4.7 4.5 3.7 2.4 1.1 UVcumuiative exposure (SED) 0.3 Q.7 1 8 3.2 5.0 9.3 14.0 18.5 22.2 24.6 25.7Using a selection of cut-off filters {made by Schott) that transmit varying wavelengths of UV radiation, this pen and a number of others were investigated. Two types of cut-off filter were used to determine if ink faded due to visible or UV radiation. One cut-off filter prevented UV radiation transmission (below 400 nm) and transmitted only visible radiation, and the other type of cut-off filter transmitted all visible and UV radiation {above 295 nm).
Ink applied to separate strips of paper
was placed under each type of cut-off filter and exposed for a day during winter. At the end of the day, the ink under the cut-off filter that transmitted both visible and UV radiation was observed to have undergone significantly more fading than the ink under the cut-off filter that only transmitted visible radiation. The most noticeable change was observed for those inks that had a blue base. For a brown pen, the colour faded to red, while the purple water-based highlighter
Figure 2. Variation in colour fading observed for each of the 12 dosimeter strips, detailed in tbis paper faded to pink. Of
Note the increasing darkness of dosimeters that were exposed for longer time the Biro, highlighter, OHT film marker periods, particularly from pair 5 to pair 12. Each pair is shown in this image next g^d whiteboard marker inks tested bv the to each other after individual pairs were converted to their maximum greyscale authors water-based highlighters were contrast To reproduce this figure pairs need to be processed individually. ^ ^ n d to show the most significant fading
following exposure to sunlight. Similar preliminary investigations by teachers can be performed to determine the type of pen ink that fades the fastest when exposed to sunlight. Indeed, students may find it interesting to test a variety of inks to determine which pens to use for The brightness of each individual pair was then slowly
decreased until the darkest colour strip was observed to be completely black. The brightness level at which the strip was observed to turn black was noted. The brightness was decreased further until the lighter colour strip (unexposed strip) was observed to turn black. In most cases this occurred at the minimum brightness level. The brightness level of each of the 12 exposed dosimeter strips relative to their respective unexposed dosimeter strip is listed in Table 2. The degree of colour fading was calculated as the difference in the exposed strip minimum brightness level and the unexposed strip brightness level relative to the unexposed minimum brightness
level. The percentage of colour fading calculated using this method is given in Table 2.
Results and discussion
Confirming that UV causes ink fade
A variety of pen inks were selected on the basis of colour combinations. Initial investigations into this topic were started after it was recognised by one of the authors that a particular pen that had been used to write details on the frames of polymer UV dosimeters faded after exposure to sunlight. This pen was blue in colour, but after sunlight exposure, faded to grey.
their UV dosimeters. The purple water-based highlighter pen described earlier was selected because the ink could be drawn quite easily and uniformly onto the paper dosimeter. Highlighters also gave a thick enough line to easily be photographed.
The calibration curve
Figure .3 shows the calibration curve for cumulative UV exposure with colour fading. The almost linear nature of the curve indicates a strong relationship between increasing exposure to UV radiation and the percentage of colour fading in the measured exposure period between 8:00 am and 4:00 pm. A straight line has therefore been fitted to the curve. Typical polymer dosimeter calibration curves exhibit similar linear behaviour over the initial calibration period, but tend to curve away after excessive cumulative exposure to sunlight due to increasing limitation of the available polymer chains which increase the opacity of a dosimeter to a certain exposure limit. In reality all dosimeters calibrated in this way have a saturation
limit whereby no continued exposure will
Table 2. The minimum brightness levels of dosimeter strips and degree of co/our result in a measurable change. Students fading.
Dosimeter
niimhpr
J 1 Ui 1 I M d
1 2 3 4 5 6 7 8 9 10 11 12 Exposed Strip minimum brightness -97 -90 -93 -97 -96 -95 -92 -89 -87 -86 -84 -83 Unexposed strip minimum brightness -100 -100 -99 -100 -100 -100 -100 -100 -100 -100 -100 -100 Colour fading ¡"AX \/a) 3 10
6
3
4
5
8
11
13
14
16
17
may find it worthwhile to investigate the saturation limit of pen ink dosimeters. The saturation limit of any pen ink dosimeter will vary between different ink types in different pens and highlighters and every pen will produce a different calibration curve and have different linear curve limits.
As mentioned previously, discontinuities at ^0% and 6% colour fading, evident in Figure 3, are due to shading effects during the photography of the strips resulting in variation in colour between unexposed and exposed dosimeters that received 0.7 and 1.2 SED respectively. Variation
in the weight applied to the pen and the speed at which each dosimeter strip was drawn will also influence the calibration curve. Outliers in the measured data were ignored in drawing the line of best fit through the calibration data. The accuracy of a calibration curve, particularly in winter when UV exposures are lower, could further be increased if measured over several days in order to determine the relationship between a greater cumulative exposure and the percentage of colour fading.
Measuring UV exposures with dosimeters
Unexposed dosimeter strips made using the same pen or highlighter used to produce the calibration curve can be exposed in areas that students may like to measure. The percentage of colour fading of dosimeters placed in areas of interest can be determined using the presented method, then matched to the calibration curve to determine cumulative UV exposure. Examples include measurements of personal UV exposure recorded during school sports carnivals, weekly or monthly personal UV exposures recorded for various body sites or exposures in various areas of the playground.
Suggested variations to the technique
The line produced in Figure 3 was developed from dosimeters measured on a winter day. The total daily cumulative UV exposure will increase if measured over the summer season. Greater cumulative exposures measured over summer for example, will also show variations in the linear limit of the calibration curve. Teachers may like to collate calibration curve data measured at different times of the year to examine this effect.
As a further modification to the suggested technique, teachers may find that colour fade does not necessarily need to be measured by digital analysis of dosimeter strips. Cumulative exposure could simply be noted for each faded dosimeter during the calibration process. Dosimeters made using the same pen ink could then be exposed in different environments and compared to the measured cumulative exposure of the faded calibrated dosimeters to approximate the level of exposure.
Extension and links to the curriculum
The concept of calibration is significant to a variety of scientific fields. In the physical sciences, any measurement needs to be quantified relative to a known standard. In practice scientists can only measure the effect of the quantity they intend to measure, not the quantity itself. A measurement of temperature, for example, using a standard thermometer, is actually a measurement of the expansion of an enclosed liquid that reacts to an increase in temperature, not a measurement of temperature itself, In this, case students measure the UV irradiance, observe the effects of the UV irradiance over time on manufactured dosimeter strips and relate their findings to the biological sunburning response of human skin. In doing this students study the relationship between the erythemal UV irradiance, the Isunburning power incident over a square metre
l and the exposure, |the sunburning energy received over a given period of time i}m-^)\. Students may recognise that power is simply a measurement of energy received per unit time, which can be used to strengthen understandings of energy, the environmental energy budget and the law of conservation of energy. Students measuring the effect of changes in pen ink dosimeters placed in different environments may be interested in determining why exposures are not the same in different environments, or why exposures vary on different days, given a relatively constant solar emission of energy. The techniques detailed in the article provide students with the opportunity to develop understandings of the solar UV environment and their place within it.
The techniques developed for this article have application in the science, mathematics and information technology curricula of Australian secondary schools. The calibration of dosimeters In the activity requires the use of digital photograph image processing to determine the degree of fading caused by exposure to sunlight, A purple highlighter was used here and the contrast maximised after converting pre- and post-exposed dosimeters to greyscale. Students may be interested in finding the optimal colour for improving contrast in their dosimeters by changing the hue of photographed images before converting to greyscale. Students participating in the presented activity develop their graphing skills and have opportunity to practice curve fitting techniques. Students have the opportunity to further examine the effect of fitting linear regression lines to their data over low exposure periods and can be introduced to the value of quadratic polynomials, particularly over longer exposure periods, where linear fits to the measured exposure data may no longer be valid. An examination of the variation in the rate of change of an exposure calibration curve may be used to determine the optimal or linear region of a calibration curve, and could be of benefit in teaching differentiation techniques. Here a simple numerical technique was used to integrate the UV irradiance between measurement periods by averaging the irradiance in the period and multiplying by the time in seconds in each period to determine individual dosimeter exposures. Students may further like to integrate measurements of the UV irradiance measured over the calibration interval (Table 1) using different techniques to obtain more accurate estimates of the exposure for each dosimeter.
References
Armslrong, B. K. iTJHH). Epidemiology of m.itignant meîanomti: intermittent or total iiccLimulated exf>osLirc to Ihe sun? The lounul of Dcrmjiologic Surgery
¿ind Oncology, vol. 14, pp. 8.15-849.
Davis, A., Deane, C.H.W. & Diffoy, B.L. (1976). 'Possible dosimeter for ultraviolet radiation. Nature, vol.261, pp.169-170.
Davis A., Deane, C. H. W., Cordon, D., Howell C. V. & Ledbury K. |. (1976b). A world-wide program for the continuous monitoring nf solar UV radi.ilion using poly ¡phenylene oxide) film, and considération oí the results, ¡ournal of
Applied Polymer Science, vol.20, pp. 11 h'»-] 174.
Downs. N., l^risi. A., McDonnell, B. & Thornton, P. 2008, "Measurement variation ant) the factors influencing the UV index". Teaching Science, vol, 54, no, 2, pp. 8-l_3.
laycar Electronics (2008). Jaycar Electronics, Silverwater, New South Wales, viewed 5 February 2008, <http://wwv/.¡aycar.com.au/produttView. asp?URL=index&ID=CH11If.&CATID=12&SUBCATID=4.î7>.
Longstrelh, I, de GruijI, F.R., Kripke, M.L., Abseck, S., Arnold, F., Slaper, H.I., Velders, C.,Tnkizawa,Y. Ä van der Leun, ).C. (1998). Ht'aith Risks./(n/rnü/o/'
Photochi'mislry cind Photobiology, B:Biology, vol. 46, pp. 20-39,
MacKle, R. (1998). Incidence, risk factors and prevention of melanoma,
furopejn ¡ournal of Cdnri^r, vol. .14, pp. 1-6.
Staples, M,, Marks, R. & Giles, G. (1999). Trends in the incidence of non-meianocytic skin cancer (NMSC) treated in Australia 198.'>-1995; Are primary prevention programs starting to have an effect? international ¡ournal of Cancer, vol 78, no. 2, pp. 144-148. E n
Figure 3. Winter calibration curve for a pen ink dosimeter
Outliers at 6% and 10% colour fade were ignored in determining the straight line fit for the data.
t e a c h i n g s c i e n c e
About the authors:
Nathan Downs, Joanna Turner, Alfio Parisi and |enny Spence
work at the Department of Bioltjgical and Physicil Sciences, University of Southern Queensland, Toowoomba.