Article
How Vehicle Types and Operator’s Legal Status
Affect Safety of Interprovincial Buses in Thailand
Apiwat Ratanawaraha
1,a,, Saksith Chalermpong
2,b,*, and Paniti Samnakorn
2,c1 Department of Urban and Regional Planning, Faculty of Architecture, Chulalongkorn University,
Patumwan, Bangkok 10330, Thailand
2 Department of Civil Engineering, Faculty of Engineering, and Transportation Institute, Chulalongkorn
University, Patumwan, Bangkok 10330, Thailand
E-mail: a[email protected], b[email protected] (Corresponding author), c[email protected]
Abstract. In urgent response to an unenvied label as the world’ second worst road safety record, the Thai government has begun to ban the use of vans and double-decker buses for intercity bus services and is considering to change the legal status requirement of entities applying for bus operating licenses. This paper examines whether the empirical evidence justifies such policy directions. We use the Poisson and Negative Binomial regression models to examine whether vehicle types and legal status affect safety risks of intercity bus services, focusing on interprovincial routes outside Bangkok. The results confirm that the use of vans and double-decker buses significantly increases fatality risks of interprovincial bus services. But the results produce no evidence to support the claim that formal legal entities provide safer operation. While banning specific vehicle types for bus services is the right policy, our results caution that simply requiring bus operators to obtain formal legal status may not help improve safety performance. More effective policy options should focus on operational characteristics and vehicle standards.
Keywords: Accident risks, intercity bus, operator characteristics, vehicle types.
ENGINEERING JOURNAL Volume 23 Issue 1 Received 8 May 2018
1.
Introduction
Thailand’s road safety records are among the worst in the world. According to the World Health Organization (WHO), the road accident fatality rate in Thailand in 2015 is the second worst in the world, with estimated 24,000 road fatalities per year [1]. Although the majority of road accident deaths in Thailand involved motorcycles, intercity public buses, which are usually considered one of the safest modes of transport in developed countries, also show poor safety performance. As many as 114 persons were killed and 1,509 injured in 234 accidents involving intercity buses in 2015 [2].
Recognizing the severity of the problem, the Department of Land Transport (DLT) as the bus regulator has imposed a series of new regulations in attempt to curb the accidents. For example, all public buses are required to install the Global Positioning System (GPS) tracking system, which the DLT uses to monitor speed and driving behaviors. Also, due to the high accident rates involving public vans and double-decker buses, as shown in Table 1, the DLT announced in 2017 to ban the use of vans in public transport service, and that it would no longer issue or renew operating licenses for double-decker buses. Approximately 400 intercity vans would no longer be allowed to operate from 1 October 2018 onwards, as the DLT would not extend their operating licenses for vans that are more than ten years old. Operators would have to change their vehicles to minibuses instead. Such a policy will affect the operators, as they have to invest in new vehicles. It will also affect the passengers if the operators can no longer operate or have to raise fare.
Table 1. Accident statistics of intercity bus in Thailand in 2015.
Type of vehicle Registered Number of
vehicles Accidents Deaths passengers Injured
Passenger van 7,934 102 61 487
Full-size bus 7,455 100 40 732
Double-decker bus 1,886 52 29 290
Source: Department of Land Transport (2016).
The government has also considered changing the bus operator standards, including legal status requirement for operators. Policymakers believe that poorly managed operators, often small and family-run or individual owner operators, are more prone to accidents, but little empirical evidence is available to evaluate the efficacy of the proposed changes in regulations. This paper aims to provide additional empirical evidence on this matter, focusing on interprovincial routes outside Bangkok.
The paper is structured as follows. Section 2 reviews the literature on the determinants of bus safety. Section 3 provides an overview of intercity bus services in Thailand, with specific reference to interprovincial routes. Section 4 outlines the hypotheses and research methodology. Section 5 presents the findings. The last section concludes with policy implications and suggestions for future research.
2.
Literature Review
practices, and public attitudes that could affect road safety, such as attitudes on driving and drinking, enforcement of licensing and driving laws, and speed limits. Several studies have adopted the Haddon framework to examine bus safety, including a study on school bus safety in Australia [4] and an analysis of crash and injury mechanisms in several bus crashes in Sweden [5]. Our focus in this study is on the vehicle and the legal environment.
While the Haddon framework provides a comprehensive approach to risk analysis and prevention, other studies focus more on specific determinants and mechanisms. A few studies have examined bus drivers’ behaviors, which are reportedly influenced by another layer of factors. Examples of the determinants include drivers’ compensation levels and methods [6], age, history of traffic violations, and surface conditions [7], and gender [8]. Business structure and drivers’ employment status could also affect bus safety risks as well. Owner operators are found to have more driver and vehicle violations than employee drivers, although they have better crash records [9]. Unionized drivers also have better safety performance, possibly due to job security and compensation methods [10].
Meanwhile, a study in Denmark finds that bus accident severity is positively related to five key factors, namely, (i) the involvement of vulnerable road users, (ii) high speed limits, (iii) night hours, (iv) elderly drivers of the third party involved, and (v) bus drivers and other drivers crossing in yellow or red light. The same study also finds that occurrence of injury to bus passengers is positively related to another five key factors: namely, (i) the involvement of heavy vehicles, (ii) crossing intersections in yellow or red light, (iii) open areas, (iv) high speed limits, and (v) slippery road surface [11].
There may be some differences between developed and developing countries in terms of determinants of bus crashes. In Dhaka, Bangladesh, crash severity tends to increase when the collision occurs on weekends, off-peak periods, and two-way streets or involves only one vehicle, a pedestrian, and other vulnerable road users. On the other hand, the severity of a crash tends to be lower at locations with some form of police control or road medians, as well as for crashes involving hit object, parked vehicles, or sideswipes [12].
The types of buses may also matter. A study in Iowa, USA, finds that school buses there have low crash rates, and the majority of crashes do not lead to injury. Buses are among the safest forms of road transportation, and efforts to educate drivers of other vehicles may help reduce crashes with buses [13].
Compared to the literature on road and bus safety, there are much fewer studies specifically on the safety of intercity buses. A study in the United States examines factors associated with driver errors in fatal bus crashes involving five bus operator types, including school, transit, intercity, charter or tour, and other. Factors associated with driver error include bus operation type, age, sex, hours driving, trip type, method of compensation, and previous driving record. While transit and school bus drivers are the least likely to have contributed to the crash, intercity buses are 1.9 times more likely to become involved in an accident, and charter operations have significantly higher odds of driver error [14]. Safety risks of intercity buses could be attributed to region-specific road conditions, as in the case of Malaysia [15], and/or drivers’ fatigue and visibility restriction during nighttime driving [16].
As for operators’ types, a study in the USA examines factors associated with driver errors in fatal bus crashes involving different bus operator types. Five different carrier types were identified: school, transit, intercity, charter or tour, and other. The study finds that bus operation type, previous violations, and previous crashes are significant factors. Prior driver violations and crashes both increase the probability that a driver would have been coded with an error in the crash. Transit and school bus drivers were the least likely to have contributed to the crash. Intercity operations were associated with an increase in the risks. Charter and other bus operations were also associated with significantly higher odds of driver error [17].
joint-operators with the TLC. This means an intercity bus route for Route Group 2 could be officially operated by a number of operators, whereas a route for Route Group 3 could be operated by only one operator. Such differences could contribute to different risk levels and resulting accidents.
3.
Interprovincial Bus Services in Thailand
Intercity bus routes in Thailand are categorized into two groups for the purpose of licensing and regulating. Route Group 2 includes bus routes between Bangkok and other provinces in Thailand. According to the Cabinet Order of 1960, the licenses to operate all 202 intercity bus routes in Route Group 2 are granted solely to the state enterprise TCL. Any private operator wishing to operate in these routes must subcontract from the TCL. On the other hand, intercity bus routes between provinces other than Bangkok are designated as Route Group 3. While many routes in Route Group 3 operate within the same region, a few of them cover very long inter-regional routes, such as between Chiang Mai in the north and Phuket in the south, covering more than 1,500 kilometers. For all 504 interprovincial routes in Route Group 3, private operators are eligible to apply for operating licenses directly from the DLT. The TCL also operates a small number of routes in Route Group 3. However, unlike in the case of Route Group 2 in which private individual operators can operate the buses by subcontracting through the TCL, private operators must have one of the three legal status, namely, limited company, limited partnership, or cooperatives in order to apply for operating licenses for routes in Route Group 3. These differences in rules mean that the safety performance of operators may be affected by different factors between the two Route Groups.
The Land Transport Act, B.E. 2522 (1979) also stipulates the vehicle types and vehicle standards that can be used to provide public transport services. The main vehicle types used for intercity bus services include VIP air-conditioned buses (Vehicle Standard 1), normal air-conditioned buses (Vehicle Standard 2), non-air-conditioned buses (Vehicle Standard 3), and double-decker buses (Vehicle Standard 4). Passenger vans were not originally permitted for public transport services. But the vans had gain widespread popularity since the late 1990s both for intra-urban and inter-urban travel, due to their speed, affordability, flexibility, and responsiveness. In 2009, the DLT formalized intercity van services and allowed them to operate within a distance of 300 kilometers from their base locations. Succumbing to the pressure from full-size bus operators who were losing ridership to van operators, the DLT changed its licensing policy for both Route Groups 2 and 3. Existing bus operators for short-haul intercity routes can now convert their licenses for full-size buses to vans at the ratio of 1:3. Since then the vans have practically dominated the short-haul intercity routes at the expense of full-size buses.
Institutional issues plague the governance of interprovincial bus services, which in turn affect bus safety as well as efforts to improve it. Both intercity bus services on Route Groups 2 and 3 are licensed and regulated by the Central Land Transport Control Committee based in Bangkok. On the other hand, intraurban routes within Bangkok and other municipalities (Route Group 1) and inter-urban routes within a province (Route Group 4) are governed by the respective Provincial Land Transport Control Committee, except for Bangkok and surrounding areas where the Central Committee is in charge. While it makes sense that the Bangkok-based Central Committee is responsible for routes between Bangkok and other provinces, it does not make much sense that the committee also oversees interprovincial routes that have nothing to do with Bangkok. For instance, a bus service between Chiang Mai and Chiang Rai in the same northern province would have to go through procedures under the Central Committee, not by a Provincial Committee. Such routes could be better served by the Provincial Committees that understand local situations and conditions better than their central counterpart. However, the current legal framework does not allow for such arrangement.
4.
Data
averaging 221.6 km in length. The number of branch lines can also vary greatly from one to 23 branches. In each route, one or more types of vehicles can be used. Air-conditioned vans are the most popular type of vehicles, averaging 8 vans per route. The first-class air-conditioned buses, the so-called VIP buses, are least numerous, averaging 0.15 vehicles per route. It should be noted that most routes operate only one or two types of vehicles, and that vans dominate shorter routes, whereas the VIP buses are common for very long routes.
Table 2. Characteristics of interprovincial bus routes (Route Group 3).
Variables Number of observations Mean S.D. Min. Max.
Route characteristics
Route distance (km) 504 221.6 260.4 8 1627
Number of branches 504 2.3 2.5 1 23
Number of vehicles of different types in route
First class air-conditioned bus (24 to 32 seats) 504 0.15 0.75 0 23
Second class air-conditioned bus (40 seats) 504 1.47 4.36 0 7
Air-conditioned van (13 seats) 504 8.04 18.85 0 164
Air-conditioned double decker bus (55 seats) 504 0.78 3.74 0 46
Non-air conditioned bus (40 seats) 504 0.18 0.95 0 11
Source: Record of Bus Operators, Department of Land Transport (2015).
Table 3 shows the frequency distribution of route origins and destinations. Most routes are operated within the same region. The northeastern region, the largest and most populous region in Thailand, has by far the most interprovincial routes, followed by the central and southern regions. There are relatively few interregional routes, most of which are between geographically contiguous regions, such as between the central and other regions. Figure 1 shows the frequency distribution of routes by operator’s legal status. As only one operator is licensed to operate in each route, there is only one possible legal status in each route. The great majority of the routes are operated by private companies, followed by the state-owned Transport Company, which is licensed to operate all routes in Route Group 2, i.e., between Bangkok and other provinces. Individual operators cannot be licensed to operate interprovincial buses but are required to form cooperatives, which account for about 7 percent of all routes. Operators with limited partnership status form the smallest group with 3 percent of the route share.
Table 3. Frequency distribution of origins and destinations interprovincial bus routes.
OD Region Central North Northeast East South West
Central 96
North 13 40
Northeast 9 10 160
East 7 4 10 20
South 1 4 4 2 88
[image:5.595.64.514.190.320.2] [image:5.595.61.515.516.598.2]Fig. 1. Distribution of interprovincial bus routes by operator’s legal status.
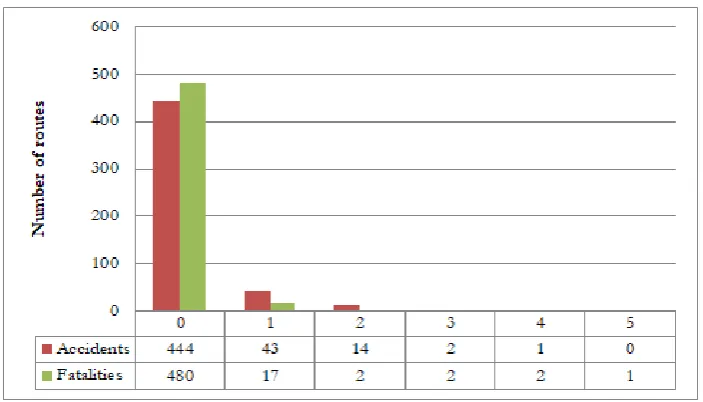
The second data set is the bus accident data are obtained from the DLT accident database, including the number of accidents and fatalities that occurred on each route in 2015. The two data sets are then merged. Among 504routes in Route Group 3, 444routes had no accident and 480routes had no fatality in 2015. The average (and standard deviation) numbers of accidents and fatalities are 0.16 (0.49)and 0.08 (0.44), respectively. The distribution of interprovincial routes by number of accident and fatality occurrences are shown in Fig. 2.
Fig. 2. Frequency distribution of routes with different number of accidents and fatalities.
5.
Research Methodology
The key research question of this study is whether vehicle types and an operator’s legal status affect safety risks of intercity buses. The main hypotheses are thus: (1) the more there are specific vehicle types on a given route, the greater the safety risks are; and (2) the legal status of the operator (e.g., state-owned, cooperatives, limited partnerships, and companies) on a given route affects the safety risks. The unit of analysis is the route of interprovincial buses.
[image:6.595.201.380.81.257.2] [image:6.595.122.474.390.591.2]operated by limited companies, and so we do not include a dummy for this operator’s legal status, leaving it as the reference category. Since each route may have multiple vehicle types, which may in turn affect its safety risks, we use the number of each type of vehicles that are operated in a given route as explanatory variables, including the number of first-class air-conditioned buses, second-class air-conditioned buses, non-air-conditioned buses, air-conditioned vans, and double-decker buses. (See Table 2 for information about the number of vehicles of different types.)
We also control for other factors that may affect safety risks of a given route, including route’s operational characteristics and other route specific characteristics. Longer routes are more exposed to accident risks and so we include the route’s length as an explanatory variable. In addition, some routes include both the main line and branch lines. Such arrangement may affect safety risks, since the branches of the same route tend to be operated by different operators who may compete with one another. Therefore, the number of branches of each route is hypothesized to be a causal factor and included in the model.
As for other route-specific characteristics that affect risks, such as traffic volume on the route and the highway geometry, due to limited data availability, we use dummy variables to proxy their effects. For example, the terrains of the Northern and Southern regions of Thailand are more mountainous than other regions, and may increase accident risks of bus routes operated in these regions. In this case, we specify five intra-regional dummy variables, for Central, Northern, Eastern, Western, and Southern regions in the model, leaving the Northeastern region, with the largest number of routes, as the base category. In addition, as some routes are operated interregionally, the combined effects of regions on risk may vary. We attempt to test these effects by including dummy variables for interregional routes with one end of the route located in each region, including Northern, Eastern, Western, Northeastern, and Southern regions in the model, leaving the Central region, with the largest number of route ends, as the base category.
We use the Poisson regression model [21] and the Negative Binomial regression model [22] to test the research hypotheses. Let Yi be the number of accidents/fatalities on route i , and assuming that it is distributed Poisson with the mean of i. The probability mass function of Yi is given by:
exp( )
( )
!
y
i i
i
P Y y
y (1)
The Poisson regression model can be parameterized by log-transformed mean as follows:
i exp(Ri
Vi
Xi
) (2)where i= the expected number of fatalities (or accidents) on route i,
, ,
i i i
R V X = vectors of explanatory variables, including route and Origin-Destination region
characteristics, the number of vehicles of different types, and the number of operators of different legal status, respectively,
, , = vectors of coefficients for the explanatory variables.One restrictive property of the Poisson model is that the conditional mean and variance of Yi must be equal. The common violation is when the variance exceeds the mean, known as over-dispersion. With such violation, the coefficients’ standard errors estimated by the Maximum Likelihood method will be incorrect, and inferences must be done based on the robust standard errors [23]. Also, in the case of over-dispersion, instead of the Poisson, the Negative Binomial (NB) regression model may be estimated. The conditional mean and variance of Yi in the NB model can be written as:
i exp(Ri
Vi
Xi
i) (3) and
( )i i(1 i )
Var Y (4)
where exp( )
i = the gamma distributed error with the mean of 1 and the variance of .The Poisson model is a special case of NB when
= 0. We run both regressions to test the problem of over-dispersion in the Poisson model, and if detected, we use the NB results.Since our data includes a large number of routes which had no accidents and fatalities, we also
considered using the zero-inflated version of the Poisson and NB regression models to analyze the data. In the zero-inflated models, it is assumed that the data are generated by two data generation processes [24, 25]. The value of zero is generated in the first process with a certain probability. For the remaining probability, the second process generates the number of event occurrences, which also includes the value of zero, that follows either the Poisson or NB distribution. However, in this study we do not have a theoretical basis that supports such an assumption, and our main research objective is to uncover the factors that affect accident risks by the model, not to use the model for prediction. Accordingly, we follow the advice by Lord et al. [26, 27] and Allison [28], who advised against using the zero-inflated models merely to improve curve fitting, and estimate only the Poisson and NB regression models.
6.
Results
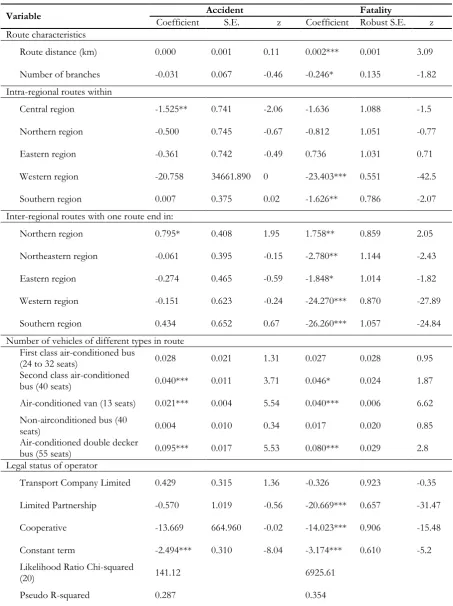
Table 4 shows the results from the Poisson regression models of accident and fatality risks. The coefficients estimates are presented for the three groups of explanatory variables in the models, including route and Origin-Destination (OD) region characteristics, regions of origin and destination of route, and legal status of operator. Note that the OD characteristics are included as dummy variables. Routes can be divided into two groups according to their OD, routes with both origin and destination in the same region (intra-regional routes) and routes with one end in one region and the other end in another region. As shown in Table 4, the northeastern region has the greatest number of intraregional routes. Therefore, we define dummy variables for intra-regional routes for routes in all regions except for the northern regions, which serve as the base category. As for inter-regional routes, we define dummy variables for each region for routes with one end in that region and the other end in another region. Since the central region has the largest number of such routes, it does not have a dummy variable, thus serving as the base category for comparing inter-regional routes.
The Poisson regression models were estimated by the Maximum Likelihood method. Based on the Likelihood ratio statistics of both models, which are Chi-squared distributed with 20 degrees of freedom, we can reject the null hypothesis that the coefficients are jointly zero at the 0.001 level of significance. As can be seen in Table 4, in the accident risk model, neither the route distance nor the number of branches is significant. The coefficient for intra-regional route dummy variable for the central region is negative and significant at the 0.05 level, implying that only the routes that are entirely in the central region has lower accident risk than do those in the northeastern region. The coefficient for inter-regional route dummy for the northern region is positive and significant at the 0.1 level, implying the inter-regional routes to and from the northern region may be more risky than other regions. This result can probably be explained by the mountainous terrain in the northern region. The coefficient estimates for number of vans, standard air-conditioned buses, and double decker buses are significant at 0.01 level and positive with increasing magnitude in that order, implying the greater accident risk of routes with these types of vehicles. As for legal status of operators, none of the coefficient estimates for level status dummy variables is significant. The result implies that there is no significant difference in terms of accident risk between private companies, the base category, and TCL, limited partnership, and the cooperatives of small operators.
Table 4. Poisson regression model estimation results of numbers of accidents and fatalities per route.
Variable Accident Fatality
Coefficient S.E. z Coefficient Robust S.E. z
Route characteristics
Route distance (km) 0.000 0.001 0.11 0.002*** 0.001 3.09
Number of branches -0.031 0.067 -0.46 -0.246* 0.135 -1.82
Intra-regional routes within
Central region -1.525** 0.741 -2.06 -1.636 1.088 -1.5
Northern region -0.500 0.745 -0.67 -0.812 1.051 -0.77
Eastern region -0.361 0.742 -0.49 0.736 1.031 0.71
Western region -20.758 34661.890 0 -23.403*** 0.551 -42.5
Southern region 0.007 0.375 0.02 -1.626** 0.786 -2.07
Inter-regional routes with one route end in:
Northern region 0.795* 0.408 1.95 1.758** 0.859 2.05
Northeastern region -0.061 0.395 -0.15 -2.780** 1.144 -2.43
Eastern region -0.274 0.465 -0.59 -1.848* 1.014 -1.82
Western region -0.151 0.623 -0.24 -24.270*** 0.870 -27.89
Southern region 0.434 0.652 0.67 -26.260*** 1.057 -24.84
Number of vehicles of different types in route First class air-conditioned bus
(24 to 32 seats) 0.028 0.021 1.31 0.027 0.028 0.95
Second class air-conditioned
bus (40 seats) 0.040*** 0.011 3.71 0.046* 0.024 1.87
Air-conditioned van (13 seats) 0.021*** 0.004 5.54 0.040*** 0.006 6.62
Non-airconditioned bus (40
seats) 0.004 0.010 0.34 0.017 0.020 0.85
Air-conditioned double decker
bus (55 seats) 0.095*** 0.017 5.53 0.080*** 0.029 2.8
Legal status of operator
Transport Company Limited 0.429 0.315 1.36 -0.326 0.923 -0.35
Limited Partnership -0.570 1.019 -0.56 -20.669*** 0.657 -31.47
Cooperative -13.669 664.960 -0.02 -14.023*** 0.906 -15.48
Constant term -2.494*** 0.310 -8.04 -3.174*** 0.610 -5.2
Likelihood Ratio Chi-squared
(20) 141.12 6925.61
Pseudo R-squared 0.287 0.354
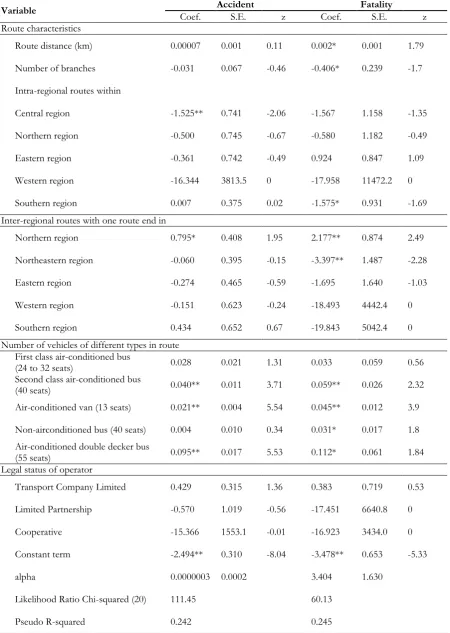
[image:9.595.62.516.113.720.2]Table 5. Estimation results of the Negative Binomial regression models of numbers of accidents and fatalities per route.
Variable Coef. Accident S.E. z Coef. Fatality S.E. z
Route characteristics
Route distance (km) 0.00007 0.001 0.11 0.002* 0.001 1.79
Number of branches -0.031 0.067 -0.46 -0.406* 0.239 -1.7
Intra-regional routes within
Central region -1.525** 0.741 -2.06 -1.567 1.158 -1.35
Northern region -0.500 0.745 -0.67 -0.580 1.182 -0.49
Eastern region -0.361 0.742 -0.49 0.924 0.847 1.09
Western region -16.344 3813.5 0 -17.958 11472.2 0
Southern region 0.007 0.375 0.02 -1.575* 0.931 -1.69
Inter-regional routes with one route end in
Northern region 0.795* 0.408 1.95 2.177** 0.874 2.49
Northeastern region -0.060 0.395 -0.15 -3.397** 1.487 -2.28
Eastern region -0.274 0.465 -0.59 -1.695 1.640 -1.03
Western region -0.151 0.623 -0.24 -18.493 4442.4 0
Southern region 0.434 0.652 0.67 -19.843 5042.4 0
Number of vehicles of different types in route First class air-conditioned bus
(24 to 32 seats) 0.028 0.021 1.31 0.033 0.059 0.56
Second class air-conditioned bus
(40 seats) 0.040** 0.011 3.71 0.059** 0.026 2.32
Air-conditioned van (13 seats) 0.021** 0.004 5.54 0.045** 0.012 3.9
Non-airconditioned bus (40 seats) 0.004 0.010 0.34 0.031* 0.017 1.8
Air-conditioned double decker bus
(55 seats) 0.095** 0.017 5.53 0.112* 0.061 1.84
Legal status of operator
Transport Company Limited 0.429 0.315 1.36 0.383 0.719 0.53
Limited Partnership -0.570 1.019 -0.56 -17.451 6640.8 0
Cooperative -15.366 1553.1 -0.01 -16.923 3434.0 0
Constant term -2.494** 0.310 -8.04 -3.478** 0.653 -5.33
alpha 0.0000003 0.0002 3.404 1.630
Likelihood Ratio Chi-squared (20) 111.45 60.13
[image:10.595.67.518.131.765.2]Table 5 shows the results from the Negative Binomial regression models of accident and fatality risks, also estimated by Maximum Likelihood approach. The explanatory variables specified in the NB regression models are the same as those in the Poisson regression, and based on the Likelihood ratio statistics, the null hypothesis that these variables are jointly zero can be rejected at the 0.001 level of significance. As mentioned earlier, in the models that test the effects on fatality risks, we cannot reject the null hypothesis that the coefficient of in the NB regression is equal to zero, thus providing no evidence for over-dispersion. Also, the goodness of fit measured by Pseudo R-squared of the NB regression is poorer, and therefore, we prefer the results from Poisson regression model for testing the effects on accident risk.
As for the results for the NB regression model of fatality risk shown in Table 5, the coefficient of α is significant, suggesting the problem of over-dispersion, and that the NB is preferred to the Poisson model. The regression coefficient for route distance is positive and significant at the 0.10 level, implying greater fatality risk for longer routes. The coefficient for the number of branches is negative and significant at the 0.10 level, implying lower fatality risk for routes with more branches. Among the coefficients for intra-regional route dummy variables, only the dummy variable for the Southern region is negative and significant at the 0.10 level, implying that routes within that region has lower fatality risk than those within the Northeastern region, the base category. As for inter-regional routes, the coefficient estimates for the Northeastern and Eastern region dummy variables are negative and significant at the 0.05, implying that routes with one end in those regions have lower fatality risk than those with one end in the Central region, the base category. Regarding vehicle types, the coefficient estimates for number of vehicles of different types follow similar pattern as those in the Poisson model, with the coefficients for vans, standard air-conditioned buses, and double decker buses are significant at least at the 0.10 level and positive with increasing magnitude in that order. Finally, the coefficient estimates for legal status of operators confirms the results from the accident risk regression models that that there is no significant difference in terms of fatality risk among operators of different legal status.
7.
Conclusions
In this paper, we test the hypothesis that vehicle types and operator’s legal status affect bus safety in terms of accidents and fatalities on intercity routes between provinces other than Bangkok. Using the Poisson and Negative Binomial regression models, we find that the number of vans and double-decker buses significantly increase the fatality risks on a given route. The evidence, however, does not support the hypothesis that operators with a more formal legal status, including the state-owned Transport Company, are safer than the less formal ones, such as cooperatives of individual operators.
The statistical results confirm the widely-held belief and empirical evidence from existing studies that vans are unsafe to be used for intercity bus services. However, we cannot conclude from the data to what extent such safety risks are attributed to the vehicle type versus the ways the van services are organized. Since the government allowed bus companies to substitute three vans for one full-size bus in 2009, many bus operators have opted to terminate their short-haul services. Instead of investing in a new fleet of vans, they have allowed individual van operators to join their operation under the same operating license. The safety risks thus increase, as these bus companies do not necessarily enforce strict safety standards and protocols on the individual operators. They just let the van operators provide services independently albeit under the same operating license. The safety risk effects are therefore confounded between the vehicle type and the de facto operational practice. Nonetheless, the study results clearly support the policy to ban vans from intercity services.
The evidence also suggests that the types of double-decker buses used in Thailand are not appropriate for intercity services. This finding is in line with the results from Taiwan [19], but opposite to a previous study in which we find no evidence that double-decker buses on routes between Bangkok and other provinces increase safety risks [20]. We conjecture that the difference is attributed to the classes and quality of roads on which the two route groups operate. Those on Bangkok-provincial routes tend to operate on major highways that are wider and of higher quality, whereas those on interprovincial routes often use minor roads that are narrower and of lower quality. In any case, the findings suggest that the vehicle standards and regulations for these types of vehicles need to be revised appropriately.
As for the legal status of operators, the insignificant effect may reflect the common practice in Thailand for large operators with formal legal status, such as limited company, to subcontract their bus operation to owner-operators with poor business and service practice. Further research into such practice can shed more light on how operator’s organization and management should be regulated in order to promote safer
operation of intercity buses.
Admittedly, the study has several limitations that should be rectified in future research. Our models do not explicitly include several important factors that could affect crash and fatality risks. Even though we attempted to use the operating region as a proxy for spatially-related factors, such as traffic volume on the route and road geometry, the dummy variables are too crude to capture the specific effects of these factors. Other important factors are not included either, such as vehicle composition, time of crash, and driver characteristics. The absence of these variables likely affects the estimation of the effect of vehicle types and legal status on bus crash and fatality risks. Unfortunately, many of these variables are not collected by relevant authorities at the time of crash, so primary data collection and in-depth investigation would become necessary. We hope future research will take on these research challenges.
Acknowledgments
We thank the Faculty of Architecture, Chulalongkorn University for financial support and the Office of Passenger Transport, Department of Land Transport for route and accident data. We also thank Chakaphan Chullabodhi for excellent research assistance. We thank two anonymous reviewers for valuable comments and suggestions.
References
[1] World Health Organization, “Global status report on road safety 2015,” WHO, Geneva, 2015. [2] Department of Land Transport, “Public transport accident annual report 2015,” Bangkok, 2016. [3] W. Haddon Jr., “Advances in the epidemiology of injuries as a basis for public policy,” Public Health
Report, vol. 95, pp. 411–421, 1980.
[4] C. J. Edmonston and M. C. Sheehan, “Safe school travel is no accident! Applying the Haddon Matrix to school transport safety,” in 2001 Road Safety Research, Education and Policing Conference, Melbourne, Victoria, 2001.
[5] P. Albertsson, U. Björnstig, and T. Falkmer, “The Haddon matrix, a tool for investigating severe bus and coach crashes,” Int J Disast Med, vol. 1, no. 2, pp. 109-119, 2009.
[6] M. H. Belzer, “The Economics of Safety: How Compensation Affects Commercial Motor Vehicle Driver Safety,” Working Paper Presented to United States House of Representatives Committee on Small Business, 2012.
[7] S. Feng, Z. Li, Y. Ci, and G. Zhang., “Risk factors affecting fatal bus accident severity: Their impact on different types of bus drivers,” Accident Anal Prev, vol. 86, pp. 29-39, 2016.
[8] M. Ma, X. Yan, H. Huang, and M. Abdel-Atym, “Occupational driver safety of public transportation: Risk perception, attitudes, and driving behavior,” TRR, no. 2145, 2014.
[9] D. E. Cantor, H. P. Celebi, T. Corsi, and C. M. Grimm, “Do owner-operators pose a safety risk on the nation’s highways?,” Transport Res E-Log, vol. 59, pp. 34-47, 2013.
[10] T. Corsi, C. M. Grimm, D. Cantor, and D. Sienicki, “Safety performance differences between unionized and non-union motor carriers,” Transport Res E-Log, vol. 48, no. 4, pp. 807-816, 2012. [11] C. G. Prato and S. Kaplan, “Bus accident severity and passenger injury: evidence from Denmark,”
presented at The 92nd Annual Meeting of the Transportation Research Board, Washington D.C., Jan. 13-17, 2013.
[12] U Barua and R. Tay, “Severity of urban transit bus crashes in Bangladesh,” J Adv Transp, vol. 44, pp. 34-41, 2010.
[13] J. Yang, C. Peek-Asa, G. Cheng, E. Heiden, S. Falb, and M. Ramirez, “Incidence and characteristics of school bus crashes and injuries,” Accident Anal Prev, vol. 41, pp. 336-341, 2009.
[14] B. Daniel and P. Green, “Type of motor carrier and driver history in fatal bus crashes,” TRR, no. 2194, pp. 37-43, 2010.
[15] T. H. Law, M. S. Daud, H. Hamid, and N. A. Haron, “Development of safety performance index for intercity buses: An exploratory factor analysis,” Transp Policy, vol. 58, pp. 46-52, 2017.
[17] D. Blower and P. E. Green, “Type of motor carrier and driver history in fatal bus crashes,” TRR, vol. 2194, no. 1, pp. 37-43.
[18] P. Taneerananon and O. Somchainuek, “Bus crash situation in Thailand: Case studies,” Journal of the
Eastern Asia Society for Transportation Studies, vol. 6, pp. 3617–3628, 2005.
[19] W. H. Chang, H. R. Guo, H. J. Lin, and Y. H. Chang, “Association between major injuries and seat locations in a motorcoach rollover accident,” Accident Analysis & Prevention, vol. 38, no. 5, pp. 949-953, 2006.
[20] A. Ratanawaraha and S. Chalermpong, “How operators’ legal status affects safety of intercity buses in Thailand,” in The Proceedings of the Transportation Research Board 97th Annual Meeting, Washington, D.C., 2018, to be published.
[21] H. S. Chang and C. C. Yeh, “Factors affecting the safety performance of bus companies—The experience of Taiwan bus deregulation,” Safety Sci, vol. 43, no. 5–6, pp. 323-344, 2005.
[22] A. Abdulhafedh, “Crash frequency analysis,” J Transp Tech, vol. 6, pp. 169-180, 2016.
[23] W. H. Greene, “Accounting for excess zeros and sample selection in poisson and negative binomial regression models,” NYU Working Paper No. EC-94-10, 1994. [Online]. Available: https://ssrn.com/ abstract=1293115 [Accessed: 20 April 2018]
[24] D. Erdman, L. Jackson, and A. Sinko, “Zero-inflated poisson and zero-inflated negative binomial models using the COUNTREG procedure,” in Proceedings of SAS Global Forum 2008, San Antonio, Texas, 2008.
[25] P. Wilson, “The misuse of the Vuong test for non-nested models to test for zero-inflation,” Econ Lett., vol. 127, pp. 51-53, 2015.
[26] D. Lord, S. P. Washington, and J. N. Ivan, “Poisson-gamma and zero-inflated regression models of motor vehicle crashes: Balancing statistical fit and theory,” Accident Anal Prev, vol. 37, no. 1, pp. 35-46, 2005.
[27] D. Lord, S. P. Washington, and J. N. Ivan, “Further notes on the application of zero-inflated models in highway safety,” Accident Anal Prev, vol. 39, no. 1, 2007, pp. 53-57, 2007.