Article
Software Module of Mathematical Chemistry
Web-Laboratory for Studying the Kinetics of Oxidation of
4-Tert-Butyl-Phenol by Aqueous Solution of H
2
0
2
in
the Presence of Titanosilicates
Irek Gubaydullin
1, Leniza Enikeeva
1,aand Lakavath Rammurthy Naik
2,b,*
1 Institute of Petrochemistry and Catalysis, Russian Academy of Science, Ufa, Russia 2 Indian Institute of Technology Kanpur, Uttar Pradesh, India
E-mail: a[email protected], b[email protected] (Corresponding author)
Abstract. Selective oxidation of phenols is of great interest in terms of practically valuable hydroquinone and pyrocatechin. The purpose of this paper is to investigate the kinetics of the oxidation reaction of 4-tert-butylphenol by an aqueous solution of hydrogen peroxide in the presence of titanosilicates. Macrokinetic model of experimental data was obtained. To minimize the relative error at different temperatures we use genetic algorithm and simulated annealing methods to solve the optimization problems. To perform the calculations a separate software module the mathematical chemistry Web-laboratory was developed. A sub module “The inverse problem” for the solving the inverse kinetic problem with the use of Java-interface for Octave was designed.
Keywords: Java, software engineering for internet projects, numerical algorithms, global optimization, ordinary differential equations.
ENGINEERING JOURNAL Volume 20 Issue 5 Received 14 December 2015
1.
Introduction
Hydroquinone and pyrocatechin are used in large amounts in the production of organic dyes; a vigorous reducing agents are widely used in photography as a developing agent [1, 2]. Pyrocatechin is used as a dye in deep dyeing fancy leather and fur, it is also used in the manufacture of drugs with hormonal properties [3].
This paper continues the systematic investigations in the field of modeling of phenol oxidation reaction by an aqueous solution of hydrogen peroxide in the presence of different samples of titanosilicates conducted in the Institute of petrochemistry and catalysis, The Russian Academy of Science (IPC RAS). An investigation of the catalysts selection theory is impossible without a comprehensive and detailed study of catalytic processes and their kinetics. Studying the reaction kinetics allows us to get the more rigorous and accurate estimate of the catalyst activity [4].
The Authors of the work are developing an information and computation electronic system “Mathematical chemistry Web-laboratory”, storage of the computational modules. At present a module for modeling of this chemical process is being developed. Earlier we investigated metal silicate catalytic activity in the hydrogen peroxide decomposition reaction [5] and others [6]. The main result was a computing module for modeling the metal silicate catalytic activity in the hydrogen peroxide decomposition reaction. The goal of this paper is creating the model and software complex for studying the catalytic activity of metal silicate in the oxidation reaction of 4-tert-butyl-phenol by an aqueous solution of H2O2.
2.
The Oxidation Reaction of 4-Tert-Butylphenol with an Aqueous Solution of Hydrogen
Peroxide
2.1. Reaction Mechanism
In our earlier work we studied the catalytic activity of the metallosilicate in the decomposition reaction of H2O2 in the absence of substrate [5]; now we are studying the oxidation of 4-tert-butyl phenol (TBP) in the
presence of the specimen No 648. The Reaction mechanism is shown in Fig. 1 [3].
Stage of reaction: Rate of the stage:
1 2 3 4
1) X X X X w1k x x1 1 2
1 1 2 1 5
2) X X X
2 2
w2k x2 1 x2
3 1 2 1 6
3)X 2X 2X w3k x3 3 x2
2 4 1 7
4)X X X
2
w4k x4 2
Fig. 1. Scheme of chemical conversions of the oxidation reaction of 4-tert-butylphenol by aqueous solutions of H2O2.
Notations: X1=TBP (C10H14O);
X2=H2O2;
X3=TBPC (C10H14O2);
X4=H2O;
X5=oligomer (C20H30O4);
X6= oligomer (C20H30O6);
X7=O2;
[image:2.595.89.530.437.575.2]ki—constants of stages rates ( 1
1 [k ]=
mass fraction×min; 2 3
1 [k ],[k ]=
mass fraction×min;
4
1 [k ]=
min.)
Experimental data on the observed changes in the concentrations of substances (TBP - 4-tert-butylphenol, TBPC – tert-butyl-pirocatechin) are shown in Table 1.
Table 1. Experimental data on changes in the concentrations of TBP and TBPC time.
Time, min 75 °С 50 °С 35 °С 75 °С 50 °С 35 °С TBP content, mass.% TBPC content, mass.%
0 100 100 100 0 0 0
10 84 87 95 6,5 4,8 2,2
20 72 76 - 14 12 -
30 60 - 91 20 - 5,2
40 52 57 - 26 23,5 -
60 37 42 86 37 34,5 10
2.2. Mathematical Model of the Reaction
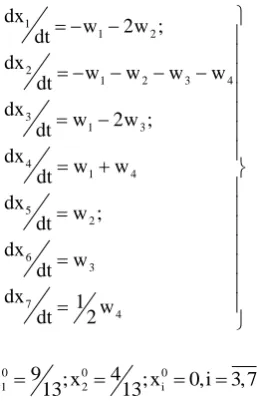
According to the scheme of transformations (Fig. 1), the mathematical model of the reaction is described by the following system of ordinary differential equations (1) with initial conditions (2):
1
1 2
2
1 2 3 4
3 1 3 4 1 4 5 2 6 3 7 4 dx
w 2w ;
dt dx
w w w w
dt dx
w 2w ;
dt
dx w w
dt
dx w ;
dt dx
w dt
dx 1 w
dt 2 (1)
0 0 0
1 9 2 4 i
x ; x ; x 0,i 3,7.
13 13
(2)
The initial conditions correspond to the initial concentrations of the reactants.
At time steps 10, 20, 30, 40 and 50 min 0.04 mol/l H2O2 was added. Therefore, to solve the inverse
kinetic problem we must to integrate the system (1) - (2) 6 times, and the concentration of output for the one step problem is the input for the next step.
The “stiff” method of Octave [7–9], that uses the method of reverse differentiation for solving stiff systems of equations, was chosen for solving the direct kinetic problem namely for solving a system of differential equations. The determining of the pre-exponential factor k0 and the activation energy Ea of the
chemical reaction - was carried out in stages: for a range of temperatures Ti (i = 1,2,3, ..) the genetic
[image:3.595.232.361.404.605.2]and the values of k0 and Ea was determined.
The objective function is the minimum value of the standard deviation of the calculated curves from experimental data.
N M 2
calc exp ij ij i 1 j 1
F x x min,
(3)where xijcalc – the calculated values of the observed concentrations of the substances, mass fraction;
xijexp – the experimental values of the observed concentrations of the substances, mole fraction;
N – the number of points of the experiment; M – amount of reactants (M = 2).
3.
Calculations Details and the Results of Kinetic Studies
The solution to optimization problem of minimizing relative error (3) was obtained by using the heuristic Genetic and simulated annealing algorithms.
3.1. Genetic Algorithm
The genetic algorithm (GA) is a method for solving optimization problems that is based on natural selection, the process that drives biological evolution. The genetic algorithm repeatedly modifies a population of individual solutions and at each step the genetic algorithm selects individuals in random from the current population to be parents and uses them produce children for the next generation. Here, we selected some options like crossover and mutation and these options are customized in order to get optimal values and remaining option has taken as default. The Genetic Algorithm performance is largely influenced by two operators called crossover and mutation [11]. These two operators are the most important for GA.
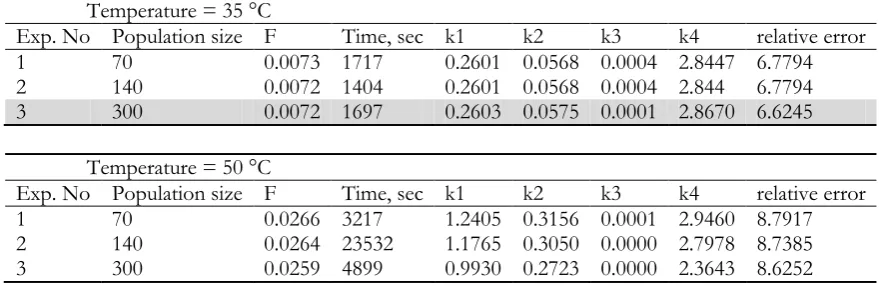
The data we obtained for genetic algorithm are shown in Table 2.
δ – relative error deviation, %
exp calc N M
ij ij calc i=1 j=1 ij
x -x
δ= ×100%
x
Table 2. Calculated data for genetic algorithm at temperatures 35, 50 and 75 °C.
Temperature = 35 °C
Exp. No Population size F Time, sec k1 k2 k3 k4 relative error
1 70 0.0073 1717 0.2601 0.0568 0.0004 2.8447 6.7794
2 140 0.0072 1404 0.2601 0.0568 0.0004 2.844 6.7794
3 300 0.0072 1697 0.2603 0.0575 0.0001 2.8670 6.6245
Temperature = 50 °C
Exp. No Population size F Time, sec k1 k2 k3 k4 relative error
1 70 0.0266 3217 1.2405 0.3156 0.0001 2.9460 8.7917
2 140 0.0264 23532 1.1765 0.3050 0.0000 2.7978 8.7385
[image:4.595.77.517.558.701.2]Temperature = 75 °C
Exp. No Population size F Time, sec k1 k2 k3 k4 relative error
1 70 0.0223 11074 1.3323 0.3643 0.0001 2.8604 9.9523
2 140 0.0223 4300 1.3372 0.3660 0.0005 2.8689 9.9681
3 300 0.0215 2843 0.9893 0.3009 0.0001 2.1288 9.6945
3.2. Simulated Annealing Algorithm
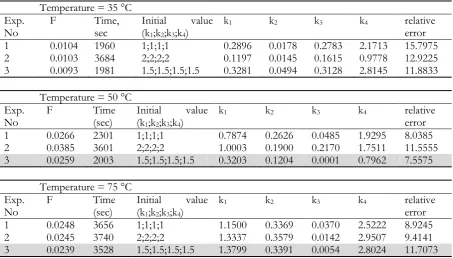
Simulated annealing [12] is a method for solving unconstrained and bound-constrained optimization problems. The method models the physical process of heating a material and then slowly lowering the temperature to decrease defects, thus minimizing the system energy. For running we have the default algorithm in Octave and some of the results obtained are shown in Table 3.
Table 3. Calculated data for simulated annealing algorithm for temperatures 35, 50 and 75 °C.
Temperature = 35 °C Exp.
No F Time, sec Initial (k1;k2;k3;k4) value
k1 k2 k3 k4 relative
error
1 0.0104 1960 1;1;1;1 0.2896 0.0178 0.2783 2.1713 15.7975
2 0.0103 3684 2;2;2;2 0.1197 0.0145 0.1615 0.9778 12.9225
3 0.0093 1981 1.5;1.5;1.5;1.5 0.3281 0.0494 0.3128 2.8145 11.8833
Temperature = 50 °C Exp.
No F Time (sec) Initial (k1;k2;k3;k4) value
k1 k2 k3 k4 relative
error
1 0.0266 2301 1;1;1;1 0.7874 0.2626 0.0485 1.9295 8.0385
2 0.0385 3601 2;2;2;2 1.0003 0.1900 0.2170 1.7511 11.5555
3 0.0259 2003 1.5;1.5;1.5;1.5 0.3203 0.1204 0.0001 0.7962 7.5575
Temperature = 75 °C Exp.
No F Time (sec) Initial (k1;k2;k3;k4) value
k1 k2 k3 k4 relative
error
1 0.0248 3656 1;1;1;1 1.1500 0.3369 0.0370 2.5222 8.9245
2 0.0245 3740 2;2;2;2 1.3337 0.3579 0.0142 2.9507 9.4141
3 0.0239 3528 1.5;1.5;1.5;1.5 1.3799 0.3391 0.0054 2.8024 11.7073
The grey color in Tables 2 and 3 indicates data that we choose for further calculation as the best values: for temperatures 35°C and 50 °C we have chosen data with minimal value of the relative error and for temperature 75 °C the minimal value of relative error is unphysical, so we choose different data.
For most cases Genetic Algorithm performed better than Simulated Annealing at 350 C shown in the
Tables 2 and 3, however as temperature increases, The Simulated Annealing gives better results than Genetic one.
[image:5.595.72.526.271.529.2](a)
(b)
(c)
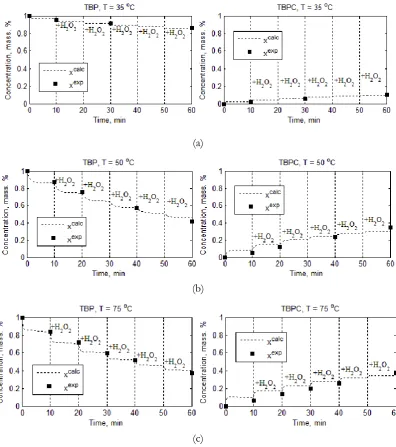
Fig. 2. Comparison of the simulation results (curves) with the experimental data (points) at various temperatures: (a) T = 35 ° C; (b) T = 50°C; (c) T = 75°C. Left kinetic curves are spending TBP, right - the kinetic curves of education TBPC.
The activation energies calculated from the temperature dependence of the rate constants of the stages are shown in Table 4 (the dimension of the constants [min-1]).
Table 4. The kinetic parameters of the reaction.
T, Co k1 k2 k3 k4
35 0.2603 0.0575 0.0001 2.8670
50 0.3203 0.1204 0.0001 0.7962
75 1.3799 0.3391 0.0054 2.8024
Ea, kJ/mole 38.510 39.509 93.498 3.078
ln(k0) 13.502 12.573 26.650 1.755
[image:6.595.99.496.87.535.2]Table 5. The relative error deviation between the calculated and experimental data for the reaction.
Т, °С 35 50 75
δ,% 6.62 7.56 11.71
From the dependence of the concentration of the reactants of time, we concluded that the H2O2
solution feed time can be shortened from 10 minutes to 5-6 minutes depending on the reaction temperature, as significant changes in concentration of the reactants after five minutes at each feeding step occurs (Fig. 4). The dependence of the concentration of the reactants was analyzed and then, it was concluded that the H2O2 solution feed time can be shortened from 10 minutes to 5-6 minutes depending
on the reaction temperature, as significant changes of concentrations of the reactants after the 5th minutes at each feeding step doesn’t occur (Fig. 4).
Fig. 4. Changing of components concentrations over time.
4.
Conclusions
In this paper we have discussed a new computing module “Oxidation of phenols with an aqueous solution of H2O2” of Mathematical Chemistry Web-Laboratory for calculating the kinetic parameters of such
reactions as decomposition of hydrogen peroxide, the oxidation of 4-tert-butylphenol with an aqueous solution of H2O2 in the presence of a titanosilicate catalyst. The kinetics of the oxidation of
4-tert-butylphenol was investigated. A scheme of the mechanism of oxidation of 4-tert-4-tert-butylphenol is offered. Based on the analysis of the kinetic curves we suggest reducing the time between breaks when filling solution of H2O2. The sub module “The inverse problem” for the solving the inverse kinetic problem with
the use of Java-interface for Octave was developed. For solving the optimization problem the simulated annealing method and genetic algorithm were used.
Reference
[1] J.-M. Bregeault, “Transition-metal complexes for liquid-phase catalytic oxidation: Some aspects of industrial reactions and of emerging technologies,” Dalton Transactions, vol. 17, pp. 3289-3302, 2003. [2] S. Hu, R. J. Willey, and B. Notari, “An investigation on the catalytic properties of titania-silica
materials,” Journal of Catalysis, vol. 220, no. 1, pp. 240-248, 2003.
[image:7.595.184.438.270.421.2][5] L. V. Sayfullina, R. R. Talipova, I. M. Gubaydullin, and S. I. Spivak, “Mathematical modeling of metal-silicate materials catalytic activity in the reaction of hydrogen peroxide decomposition,” Zhurnal
Srednevolzhskogo matematicheskogo obshhestva, vol. 15, no. 2, pp. 70-76.
[6] A. V. Balaev, I. M. Gubaidullin, and L. V. Sayfullina, “WEB-modeling of oxidizing catalyst regeneration,” Science and Education, no.12, Dec. 2012. doi: 10.7463/1212.0507309
[7] GNU Octave. (2014). GNU Octave [Online]. Available: http://www.gnu.org/software/octave/ [Accessed: 17 April 2014].
[8] K. Hansen. (2012). JavaOctave [Online]. Available:
https://kenai.com/projects/javaoctave/pages/Home [Accessed: 17 April 2014].
[9] Octave-Forge. (2016). Documentation [Online]. Available: http://octave.sourceforge.net/docs.html [10] M. S. Silberberg, Chemistry, 4th ed. NY: McGraw-Hill, 2006, p. 696.
[11] S. N. Sivanandam and S. N. Deepa, Introduction to Genetic Algorithms, 1st ed. Springer, 2007.