Article
Molecular Dynamics Observation of Iron–Carbon
Precursors of Carbon Nanotube and Development of
Iron–Carbon Potential
Kazuki Nishi
1, Shuhei Inoue
1,*
, and Yukihiko Matsumura
21 Department of Mechanical Science Engineering, Hiroshima University, 1-4-1 Kagamiyama, Higashi-Hiroshima 739-8527, Japan
2 Division of Energy and Environmental Engineering, Hiroshima University, 1-4-1 Kagamiyama,
Higashi-Hiroshima 739-8527, Japan *E-mail: shu18@hiroshima-u.ac.jp
Abstract. We have focused on the growth process of metal and carbon mixed clusters that are precursors for carbon nanotubes. The molecular dynamics method using the Brenner potential was employed for modeling carbon–carbon interactions as well as carbon–iron interactions. As for carbon–iron interactions, the parameters were derived using DFT calculation. The Finnis–Sinclair potential was employed for irons. In order to observe the deposition process of carbon atoms, we adjusted the potential parameters to reproduce the bulk melting points of graphite, iron, and cementite, which was a model material of iron– carbon composite. We observed the initial growth process by preparing iron–carbon mixed clusters (approximately 200 iron atoms and 70 carbon atoms) as precursor clusters. Additional carbon atoms were then gradually supplied to this mixture at 1000 K and 1200 K. Consequently, the graphite structure was formed on the mixture surface, but at some phases, the cap structure was observed at 1200 K.
Keywords: Molecular dynamic simulation, DFT calculation, cluster.
ENGINEERING JOURNAL Volume 17 Issue 5 Received 9 April 2013
1.
Introduction
Since their discovery, carbon nanotubes [1, 2] have been expected to be outstanding materials for many applications, and significant efforts were focused on the development of methods for their mass production and for their chirality-controlled synthesis. High-pressure carbon monoxide (HiPco) [3] and alcohol catalytic chemical vapor deposition (ACCVD) [4] have shown promise for the low-cost production and super growth method [5] appears to be most suitable. On the other hand, chirality control remains difficult to achieve. The chirality of single-walled carbon nanotubes (SWCNT) determines their band structure and diameter. As a result, chirality-controlled synthesis techniques are considered to be extremely important for SWCNT production. The relationship between chirality and the diameter of nanotubes can be expressed as follows.
2 2
0
m
mn
n
a
d
(1)where
d
is the nanotube diameter, a0is the lattice constant, and m and n are the indices of the chiralvector. Because the chiral index (m, n) is an integer, the diameter will roughly determine the chirality. There are many trial reports about chirality control, which indicates that this methodology has succeeded in controlling the chirality distribution to some extent. However, as theoretical studies have predicted, the distortion energy due to the chiral difference is too small to regulate the chirality uniquely [6]. In spite of the difficulty of this situation, recent studies have been reported in which attempts have been made to synthesize SWCNT with control of the chirality. Although the energy differences of chirality are too small to control, (6, 5) chirality nanotubes have been reported to be selectively synthesized in up to 70% yields [7]. However, the conditions under which the synthesis takes place are so severe that the total amount of SWCNT that could be obtained from this method will be low.
considered to be critical. Then, we observed the initial growth process by preparing the iron–carbon mixed clusters (approximately 200 iron atoms and 70 carbon atoms) as precursor clusters. After preparation of the initial clusters, carbon atoms were gradually supplied to the mixture at 1000 K and 1200 K, and at some phases, cap structures were observed at 1200 K.
2.
Simulation Methodology
2.1. Potential Parameters
A classical molecular dynamics method was used in this study. The FS potential was used to describe iron-iron interactions and The Brenner potential was employed to express carbon–carbon as well as carbon–iron-iron interactions. The FS potential can reproduce the fcc-bcc transformation of iron. The parameter sets used for the FS potential are listed in Table 1 and have been given in the original paper. The FS potential is described as follows.
Table 1. Potential parameters of Finnis–Sinclair potential.
Table 2. Potential parameters for CC and FeC.
i i i j ij ij
A
r
V
E
2
1
(2)・
・
)
(
0
)
(
)
(
)
(
)
(
2 2 1 0 2c
r
c
r
r
c
r
c
c
c
r
r
V
ij ij ij ij ij ij ij (3)
i j ij i
(
r
)
(4)
)
(
0
)
(
)
(
)
(
)
(
3 2d
r
d
r
d
d
r
d
r
r
ij ij ij ij ij
(5)where Vij is the two-body interaction at the distance rij, and i expresses the multi-body interactions related to the charge density. It should be noted that this term is purely cohesive. A is the binding energy, and c and d indicate the cut off distance. c0, c1, and c2 have been adopted to fit the experiment, and is
also a kind of fitting parameter.
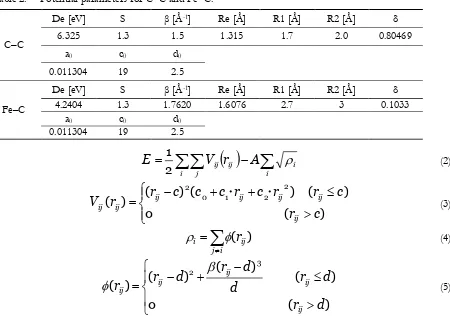
The equations and the parameter sets for the Brenner potential are given in Eqs. (6–12) and Table 2, respectively. The parameters for the carbon–carbon interaction have been adopted from the reference.
Fe–Fe d [Å] A [eV] β [Å-1] c [Å] c0 c1 c2 3.570 1.670 1.8 3.4 1.129 -0.3280 -0.03521
C–C
De [eV] S β [Å-1] Re [Å] R1 [Å] R2 [Å] δ
6.325 1.3 1.5 1.315 1.7 2.0 0.80469 a0 c0 d0
0.011304 19 2.5
Fe–C
De [eV] S β [Å-1] Re [Å] R1 [Å] R2 [Å] δ
4.2404 1.3 1.7620 1.6076 2.7 3 0.1033 a0 c0 d0
[image:3.596.63.500.285.317.2] [image:3.596.76.526.344.660.2]
i j i
ij A ij
R
r
V
r
V
E
) ()
(
)
(
(6)
2
(
)
exp
1
)
(
e ij eR
S
r
R
S
D
r
V
(7)
2
(
)
exp
1
*
)
(
e ij eA
S
r
R
S
S
D
B
r
V
(8))
(
2
1
*
B
ijB
jiB
(9)
{
1
(
)
(
)
}
), ( i j k
ik ijk c
ij
G
f
r
B
(10)
)
(
0
)
(
cos
2
1
2
1
)
(
1
)
(
2 2 1 1 2 1 1r
R
R
r
R
R
R
R
r
R
r
r
f
ij
(11)]
)
cos
1
(
1
[
)
(
2 20 2 0 2 0 2 0 0
d
c
d
c
a
G
C (12)A more detailed discussion of this derivation has been given in original work. VR and VA indicate the repulsive and attractive interactions, respectively. De is the dissociation energy, Re is the equilibrium bond length, Bijis used to describe the multi-body effect, ijk is the binding angle between the i-j binding and the i-k binding, and fijis the same form of Tersoff potential that works to smoothly cut both forces between the two cut off lengths R1 and R2. In this study, the Brenner potential is not only applied for the
carbon–carbon interactions but is also used for iron–carbon interactions. This is reasonable since as can be seen in Fig. 1, the potential map of C4 and TiC3 calculated by using Gaussian03 software is similar with
respect to the angular and normalized bond lengths. Although the metal involved in this DFT calculation was titanium, we would expect the interaction to be similar between the carbon and iron since sp2 carbon metal binding shows little angular dependence with regard to the metal.
(a) C4 cluster (b) TiC3 cluster
The parameter sets for the carbon–iron interaction were obtained from density function theory (DFT) calculations using the Gaussian09 software package with Becke’s three-parameter exchange function and the Lee–Yang–Parr correlation function (B3LYP) [18, 19]. The Los Alamos effective core potential plus DZ (LANL2DZ) [20] was used as a basis set. First, we assumed an FeCX cluster having a symmetrical
structure. We then calculated the total energy of the cluster. The binding energy was derived by subtracting the total isolated atom energies from the total energy and dividing by the number of bonds.
2.2. Scaling Factor
An important motivation for this study was to observe the nucleation process, which is considered to be induced by the super saturation of carbon atoms in the carbon-iron mixed cluster. Because inversion of the melting temperatures of carbon, iron, and the carbon-iron alloy in the simulation might cause unintentional errors, a scaling factor was applied to reproduce the melting point of each material. The scaling factor for each potential was derived by calculating the melting point of the respective cluster. We prepared clusters of various sizes at 0 K in order to account for the size effect. The temperature was gradually increased using the velocity scaling method. The initial structures for each of the clusters consisted of graphite for the carbon–carbon potential, bcc crystal for the iron–iron potential, and cementite for carbon–iron potential. In this simulation, the ratio of carbon to iron is of the same order. Therefore, we used the melting temperature of cementite as determined by the Lindemann index [21]. When the term, as given in Eq. 13, reaches 0.1, it tends to increase suddenly. As a result, this value is used as a threshold between solid (solidus) and liquid (liquidus).
j
i ij
ij ij
r r r N
N
2 2
) 1 (
2
(13)2.3. Nucleation Process
The iron–carbon mixed clusters were annealed at 1000 and 1200 K, which were equivalent to CVD synthesis temperatures. Carbon atoms were then added into the mixed clusters at the velocity equivalent to the translational energy of the metal.
3.
Results and Discussion
3.1. Potential Parameters
Figure 2 shows an example of the binding energy of carbon–iron derived using DFT (Gaussian09) and fitted using the Brenner potential function (Eqs. 6–12). As shown in Fig. 2, the Brenner potential curve was in good agreement with the DFT data from 1.3 Å to 3.0 Å. Because the distance of 1.3 Å is approximately 70% of the van der Waals diameter and the cut off length was set to 3.0 Å, the Brenner potential is considered to be an appropriate function for expressing the carbon–iron interactions.
[image:5.596.223.375.592.736.2]3.2. Scaling Factor
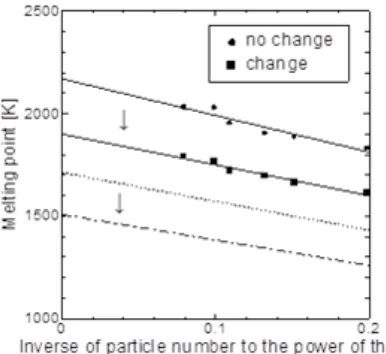
Figures 3 and 4 show the results of the calculation of the melting points of iron crystal and cementite using the parameters given in Table 1. Because the melting point exhibits a size effect, we performed the calculation using several different-sized clusters and estimated the temperature at infinite size (bulk property). The circle dots indicate the results obtained using unmodified parameters taken from the reference (iron) using the DFT calculation (cementite). The squares show the results using modified parameters and applying the scaling factors. Because the heating rate is much faster than that of experimentally practical rate, the melting point values are excessive. In order to address this problem, we adjusted the heating rate and estimated the melting point with enough reduction time shown by a broken line in Fig. 3 & 4. The melting points obtained using these potential parameters are 1811 K for iron crystals and 1507 K for cementite, which are comparable to their bulk properties.
Fig. 3. Melting point of iron nanoparticles.
[image:6.596.195.388.465.642.2]Table 3. Calculation conditions.
Potential function Brenner potential (CC, FeC) Finnis–Sinclair potential (FeFe) Boundary condition Periodic boundary condition Temperature control Brendensen Thermostat Initial structure Cementite Initial particle number 288 (C:72,Fe:216) Temperature 1000, 1200 K
Time step 0.5 fs
3.3. Nucleation Process
Figures 5(a)–(h) show the calculation result for the nucleation process under the conditions shown in table3. The blue ball represents the iron atom, and the remaining colors represent the carbon atoms. The sp2 hybridized carbon atoms, which have three neighbours within the cut off length, are shown in green. Because the initial structure was cementite, the carbon atoms and iron atoms were first arranged. Then, during the annealing process, some iron atoms were dissociated and the cluster deformed to reduce its free energy. After the annealing process, carbon atoms were added one by one. These additional atoms did not diffuse into the cluster but instead stuck to the cluster surface. In the experiment, the added carbon atoms did not show dissolution and deposition owing to super saturation. At present, this is a size problem since a relatively small cluster is employed in the calculation. Alternatively, the problem could be caused by the use of cementite in the initial structure since there are already a sufficient number of carbon atoms in cementite. However, as shown in Fig. 5(g), nuclei of the SWCNT-like structures were sometimes observed.
4.
Conclusion
[image:7.596.170.432.95.201.2](a) C:81 Fe:216 1000 K (e) C:81 Fe:216 1200 K
(b) C:271 Fe:216 1000 K (f) C:271 Fe:216 1200 K
(c) C:471 Fe:216 1000 K (g) C:471 Fe:216 1200 K
[image:8.596.85.512.71.765.2]References
[
1] S. Iijima, “Helical microtubules of graphitic carbon,” Nature, vol. 354, no. 6348, pp. 56-58, Nov. 1991. [2] S. Iijima and T. Ichihashi, “Single-shell carbon nanotubes of 1-nm diameter,” Nature, vol. 363, no.6430, pp. 603-605, Jun. 1993.
[3] M. J. Bronikowski, P. A. Willis, D. T. Colbert, K. A. Smith, and R. E. Smalley, “Gas-phase production of carbon single-walled nanotubes from carbon monoxide via the HiPco process: A parametric study,” J. Vacuum Sci. Technol., vol. 19, no. 4, pp. 1800-1805, Jul.-Aug. 2001.
[4] S. Maruyama, R. Kojima, Y. Miyauchi, S. Chiashi, M. Kohno, “Low-temperature synthesis of high-purity single-walled carbon nanotubes from alcohol,” Chem. Phys. Lett., vol. 360, no. 3-4, pp. 229-234, Jul. 2002.
[5] K. Hata, D. N. Futaba, K. Mizuno, T. Namai, M. Yumura, and S. Iijima, “Water-assisted highly efficient synthesis of impurity-free single-waited carbon nanotubes,” Science, vol. 306, no. 5700, pp. 1362-1364, Nov. 2004.
[6] H. Yorikawa and S. Muramatsu, “Energy gaps of semiconducting nanotubules,” Phys. Rev. B, vol. 52, no. 4, pp. 2723-2727, Jul. 1995.
[7] G. Lolli, L. A. Zhang, L. Balzano, N. Sakulchaicharoen, Y. Q. Tan, and D. E. Resasco, “Tailoring (n,m) structure of single-walled carbon nanotubes by modifying reaction conditions and the nature of the support of CoMo catalysts,” J. Phys. Chem. B, vol. 110, no. 5, pp. 2108-2115, Feb. 2006.
[8] C. Journet, W. K. Maser, P. Bernier, A. Loiseau, M. L. delChapelle, S. Lefrant, P. Deniard, R. Lee, and J. E. Fischer, “Large-scale production of single-walled carbon nanotubes by the electric-arc technique,” Nature, vol. 388, no. 6644, pp. 756-758, Aug. 1997.
[9] H. Kataura, Y. Kumazawa, Y. Maniwa, Y. Ohtsuka, R. Sen, S. Suzuki, and Y. Achiba, “Diameter control of single-walled carbon nanotubes,” Carbon, vol. 38, no. 11-12, pp. 1691-1697, 2000.
[10] M. Yudasaka, R. Yamada, N. Sensui, T. Wilkins, T. Ichihashi, and S. Iijima, “Mechanism of the effect of NiCo, Ni and Co catalysts on the yield of single-wall carbon nanotubes formed by pulsed Nd : YAG laser ablation,” J. Phys. Chem. B, vol. 103, no. 30, pp. 6224-6229, Jul. 1999.
[11] S. Inoue, T. Nakajima, and Y. Kikuchi, “Trial for diameter-selective synthesis of single-walled carbon nanotubes,” Carbon, vol. 44, no. 7, pp. 1287-1291, Jun. 2006.
[12] M. Kohno, T. Orii, M. Hirasawa, T. Seto, Y. Murakami, S. Chiashi, Y. Miyauchi, and S. Maruyama, “Growth of single-walled carbon nanotubes from size-selected catalytic metal particles,” Appl. Phys. A, vol. 79, no. 4-6, pp. 787-790, Sept. 2004.
[13] Y. Shibuta and S. Maruyama, “Molecular dynamics simulation of formation process of single-walled carbon nanotubes by CCVD method,” Chem. Phys. Lett., vol. 382, no. 3-4, pp. 381-386, Dec. 2003. [14] S. Inoue and Y. Matsumura, “Metal coating effect on thermal diffusivity of single-walled carbon
nanotube,” Chem. Phys. Lett., vol. 495, no. 1-3, pp. 80-83, Jul. 2010.
[15] Y. Zhang, N. W. Franklin, R. J. Chen, and H. J. Dai, “Metal coating on suspended carbon nanotubes and its implication to metal-tube interaction,” Chem. Phys. Lett., vol. 331, no. 1, pp. 35-41, Nov. 2000. [16] S. Inoue and Y. Matsumura, “Influence of metal coating on single-walled carbon nanotube: Molecular
dynamics approach to determine tensile strength,” Chem. Phys. Lett., vol. 469, no. 1-3, pp. 125-129, Feb. 2009.
[17] M. W. Finnis and J. E. Sinclair, “A simple empirical n-body potential for transition-metals,” Philos. Mag. A, vol. 50, no. 1, pp. 45-55, 1984.
[18] A. D. Becke, “Density-functional thermochemistry. III. The role of exact exchange,” J. Chem. Phys., vol. 98, p. 5648, 1993.
[19] C. Lee, W. Yang, and R. G. Parr, “Development of the Colle-Salvetti correlation-energy formula into a functional of the electron density,” Physical Review B, vol. 37, no. 2, p. 785, 1988.
[20] P. J. Hay and W. R. Wadt, J. Chem. “Ab initio effective core potentials for molecular calculations. Potentials for the transition metal atoms Sc to Hg,” Phys., vol. 82, p. 270, 1985.