Abstract: Scalability, Mobility, Security and Quality of Service are important factors of Network topology design. Throughput and goodput are two important performance attributes to judge the network. Next generation Network provide a flexibility of communication between heterogenous networks like wired or different wireless technologies. Performance of the network largely depends on the link availability between the nodes and data rate. Link prediction heuristic provides reliable network communication at the network layer routing protocols. In this paper we summarized the different parameters required for measuring the quality of service for network performance and different cross-layer architecture present in the literature. Packet Delivery ratio, throughput, E2E delay, goodput are observed for different routing protocols. Optimized Link Layer protocol presents the stable performance in all kind of network. It is represented in the result as the flow of information between source and destination increases average hop count and delay also increases. Mean delay value is increased by (0.17,0.31,0.54) double value as the size of grid is increased from 4, 5 and 6.
Index Terms: Throughput, E2E delay, Packet delivery ratio, goodput, Link prediction
I. INTRODUCTION
Smart devices like sensors, mobile phones, actuators and vehicles etc. can easily communicate through existing infrastructures, including LTE-advanced, WiFi, Z-wave and MIMO wireless technologies. Transportation management system, mHealth and m-governance applications requires low rate, low power devices and high rate devices like cars and phones can be easily managed in future wireless technology. T2T, T2H and H2H communication is used in IoT environment [1]. Scalable, stable and high-throughput connection is desirable for IoT communication. Throughput of the network decreases mainly due to broadcasting behavior of wireless technology and unicast transmission monopolization behavior. MAC Layer protocols by using the Link quality and Network conditions can enhance the QoS. Quality of service parameters can be easily differentiated by exchange of information with efficient communication abilities, data sharing and ease operating functionalities with end user satisfaction [2]. Hence application, network technologies and communication system resources are backbone of the Smart projects. Now a day’s researchers pay attention towards energy conservation, accuracy, efficiency, lightweight, security and quality of service due to scalability,
Revised Manuscript Received on June 13, 2019.
Anita Sethi, ICFAI University, Dehradun, Uttrakhand, India.
Sandip Vijay, Shivalik Engineering College, Dehradun, Uttrakhand, India.
Anurag Aeron, ICFAI University, Dehradun, Uttrakhand, India.
deployment and wide application area [3]. 5G technology provides high speed internet access and other services at lower cost to the users, which is difficult with hardcore OSI reference model. Sensing elements and actuation capabilities of objects required to connect to Internet [4]. With a common objective smart device interact on collaborative base with valuable data transmitted to end users with privacy, data quality and security at required time. Heterogeneity in the technology challenges large no of IoT devices deployment leads to scalability issue. Service oriented communication technology and service-oriented architecture in NGN fills the gap to adopt heterogeneity of devices [5]. People, data, process and thing are the essential elements of IoT, which communicates with each other through wireless and wired technology. Sensors for collection of data, for action actuators and gateway for communication and automation. Smart city, home automation, health care, industry automation, intelligent transport system and business solution are numerous application areas of IoT which requires distributed data gathering, processing and analytics and aggregation can be done at any location from cloud service.
This arise the requirement of the cross-layer architecture. Wireless sensor network, ad hoc network, underwater acoustic communication and vehicular ad hoc network have different requirements and characteristics. Cross layer design provides easy communication between layers with message passing and database interaction according to our application demand. Communication between adjacent layers are strictly limited in OSI reference layered model and applications are only allowed to use APIs provided by OS. Whereas cross layer architecture provides flexibility of communication within any protocol layers and system component including applications [6]. Cross layer Design enhance the performance of wireless communication by providing the ability to share information across all layers. Based on the wireless network conditions automatic (de) activation at run time makes its ability hard to add, remove and modify cross-layer coordination heuristics. A cross-layer coordination algorithm is hard-wired, realized at compile time and are deeply embedded within the operating system i.e. energy-saving cross-layer coordination algorithm [7].
II. RELATEDWORK
Integration of service discovery with routing using cross layer design reduces service acquisition latency and optimized control overhead. A route to the server node should be known simultaneously to node and service provider. Suitable routing protocol
select the path from source to destination with the help of intermediate nodes
Anita Sethi, Sandip Vijay, Anurag Aeron
working as router in the network to maintain the connectivity [8]. Strict boundaries are followed in TCP/IP protocol stack with independent design of protocol at each layer. Cross-layering provides the flexibility of interaction with any other layer with significant performance benefits. By eliminating the redundant operations at adjacent layers and benefit from protocol stack improve the network performance [9]. Service discovery integration at application where client must discover the server as requirement and at network layer by finding the shortest route to desired service provider. Here two processes are initialized one service discovery and route discovery process with the help of large number of message exchange. Network bandwidth, power and computation in transmitting process of a message plays a vital role [10]. Data availability anywhere requires more security as compared to other communication system at different stages of the IoT device architecture. Encryption of data gathered by IoT devices, Authentication of all IoT devices and key management pushes IoT network towards vulnerable to threats and external attacks. At the data transmission level, security heuristic should be light weight, so for scalability, security, node authentication and key management is supported by public key algorithms [11]. Its essential to reduce complexity, security and power consumption in key management scheme used in IoT devices. At the network layer routing protocols must ensure authenticity and prevents attacks such as black hole, worm hole, DDos and selective forwarding etc.
III. QUALITYOFSERVICEATTRIBUTES Maximum goodput, better throughput, minimum data packet loss, delay and routing overhead specifies the level of quality performance of a network. Maximum bandwidth utilization, errorless and maintainable communication links and loop free paths are important factors which can improve the network performance. Objective of QoS are maximization of utilization of network resources, congestion control, better communication link utilization.
A. Network Layer Queuing and Routing
Intelligent network control heuristic is responsible for resource allocation decision and routing scheduling based on queue backlog information and present topology state. Each node maintains queuing strategy which represents how packets are buffered while waiting to be transmitted. Numerous queuing methods that represents selection of packet for transmission based on bandwidth and based on buffer space which packet should be dropped which affects the latency. FIFO, Priority queue and weighted-fair queue are different types used in resource allocation. Subject to routing constraints, routing decision variables are as follow:
B. Transmission Layer Assumption
No of packets transmitted by UDP window dynamically from source to the network and packet delivery ratio indicate the congestion in network and traffic load handled by network. When there is no loss in packet transmission, the size of UDP window is increased and if packet is lost during
the transmission the UDP window size is reduced. Transmission rate = Window Size/ Round trip time
C. Calculation of Throughput
Data transmitted from source to destination per unit time is throughput of the network and calculated as:
Window Size = 131072 bytes = 1048576 bits
Round trip time = 100ms *4 = 400ms = 0.4s. In this case expected throughput is limited to 1048576/0.4 = 2621440 = 2.6 Mbps.
Higher the value of throughput represents the effective and better performance of the network.
D. Packet Delivery Ratio
In the communication network packet delivery ratio is an important quality of service parameter. Ration between the no of packets received at receiver to the no of packets transmitted. Average time interval when packet generated and effective transfer of these packets at destination is called end to end delay. E2E = (Delay Sum/ Received Packets). Packet Loss is given by the difference between total packet sent by source and total packet received. Ratio of no of routing packets transmitted to overall data packets received is known as Normalized routing load. Larger value of NRL represents efficiency of network in the form of bandwidth consumption.
E. Jitter Calculation
For a pair of packets, mean deviation of the difference in the packet spacing at the receiver as compared to sender is termed as jitter of a packet stream. For time sensitive data jitter is an important quality of service parameter. Increased transmission rate causes the immediate transmission radio and queues setup, results irregular packet inter-spacing, hence increased average jitter. Ri is the arrival time in RTP timestamp and Si is RTP timestamp of packet I, then Delay for two packets i and j is:
D(i,j) = (Rj - Ri) – (Sj - Si) = (Rj - Sj) – (Ri - Si)
IV. SECUREOPTIMIZED LINK STATE ROUTING
A. Hop Count and Hop Limit Attacks
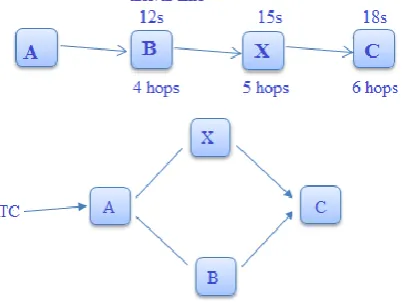
Topology control message contains hop count and hop count limit field, which is not protected by integrity check mechanism which can be modified while transmission. A malicious node can change the value of hop limit in TC which may reduce the scope of forwarding the message and nodes in the network not receiving the TC. Node A receives a TC and forward it to node B and M where M is malicious node so it can transmit it without delay with reduced value. Node C receives the TC from M and when receives from Node B, it will be discarded. Due to reduced value of hop limit TC cannot be forwarded to whole network. Artificially changes in hop count results in validity time variation calculated by received node.
B. Indirect Jamming
In this case malicious node generates immoderate amount of control traffic which results in increased overhead and channel occupation in every node for processing the control traffic. Traffic is generated by authentic node to the network, malicious node will remain undetected. Malicious node participates in the network by generating reliable control traffic and for tuning in receiver node it triggers to generate additional traffic which affect the neighbour discovery and LSA mechanism. Main objective of indirect jamming is control traffic designed for network-wide diffusion. At time t0, malicious node X using HELLO message elects node A as MPR, causes node A sets X in its Neighbor Set and increment the neighbour sequence number. Now node A provides link information between node A and node X in subsequent TCs at time t1. At time t2 malicious node advertise link break between X and A and at t3 node A removes the information of X.
C. Wormholes
Two nodes connected by an out-of-band channel, transmitting the data through a tunnel. Source node can communicate to the destination node through n no of nodes. Due to wormhole attack it appears source and destination can communicate within single hop by using a tunnel which results in loss of data.
V. NETWORKSIMULATION
[image:3.595.49.252.423.577.2]Random way point mobility model with no pause time in 300 X 1500 m network region are the attributes of the scenario. Destination node receives the data packet through its neighbors who are dynamic in nature. Total time for simulation is 50 sec. with different node density, transmit time and speed are considered for different scenarios. Other numerous experimental attributes are shown in the table 1 with their respective values. We study the impact of load on delay parameter in the network. As we increased the flow of information size the delay parameter also got increased. We collect data for throughput, delay, packet delivery ratio, jitter and goodput. Traffic sent to perform the experiment was CBR over UDP. For packet size of 512 bytes/sec, CBR packet rate is 150pps, so data transmission rate 150*512*8=614400 bps = 614.4 kbps. At receiver we computed packet loss, delay and throughput of UDP. According to one hop physical distance with sure coverage radius, transmission power is settled. Retransmission counter, carrier sense, RTS/CTS threshold and contention window size MAC parameters are set default. Grid topology enhance the performance of routing protocols of heterogeneous ad hoc network which is simulated in NS3 and different statistics are obtained in NetAnim and graphs are plotted in Wireshark. Quality of Service parameters for heterogenous ad-hoc network depends on applications used by end user with their conditions are given below. Packet Delivery ratio, Packet loss ratio, mean delay, Mean Jitter, throughput and goodput are well-defined.
Table 1. Standard Network Attributes Network Attributes Values
Topography Area 300*1500
Wireless mode Ad hoc
Simulation Time 50 sec
Traffic Control UDP
Media Access Control MAC802.11b Routing protocol OLSR & SOLSR
Wi-Fi rate 2 Mbps (802.11b)
Transmission range 100 metres
Node mobility model Random Way point
Number of packets 4
Node Speed 20 m/s
Application Type CBR using datagram
Source ID 10.1.1.3
Destination ID 10.1.1.16
Packet Size (Bytes) 64 bytes
Inter Arrival Time -
Source/Sink data pairs 10
Problem of simultaneous transmission and timing changes can be resolved by selecting
packets by nodes with maximum node self-sufficiency as a solution of simultaneous transmission by different nodes is JITTER. In periodic message generation, inducing random amount of time between successive message transmission and in forwarding message Jitter introduce delay. MAC and lower layers decide the value of Jitter. If collision in network is more due to node density occurs in interference range, value of jitter will be high.
In this scenario grid topology is used in simulation for a duration of 200sec with scalability of 3*3, 5*5 and 6*6. Different protocols degrade their performance as the scalability is increased. Numerous statistical parameters are represented in Fig. 8 generated in NetAnim and sequence of signal flow is also presented in Fig. 9. Each flow id of node uses UDP with source IP address and next node IP address. Transmitted and received bit rate, packet loss, mean delay and other parameters are calculated for every flow id.
now=+4624971901.0ns node=7 pos=24.420:388.740:0.000 vel=0.000:0.000:0.000
now=+5774251586.0ns node=40
pos=232.583:785.327:0.000 vel=-3.120:14.632:0.000 now=+5833450180.0ns node=31 pos=172.566:5.703:0.000 vel=0.000:0.000:0.000
now=+5833450180.0ns node=31 pos=172.566:5.703:0.000 vel=-0.214:12.601:0.000 now=+7603674788.0ns node=45 pos=112.277:450.954:0.000 vel=0.000:0.000:0.000 OLS R Tx Packet s Rx Packet s Lost Packet s
Delay Jitter pdf Hop Count
Fl ID 1
536 520 3 0.036
9
0.0173 0.970 1
4.25
Fl ID 2
479 439 16 0.017
3
0.0174 0.916 4
2
Fl ID 3
455 443 4 0.027
7
0.0132 0.973 6
2
Fl ID 4
400 378 4 0.020
2
0.0149 0.945 2
Fl ID 5
395 395 0 0 0 1 1
Fl ID 6
374 312 33 0.076
1
0.0291 0.834 2
4
Fl ID 7
351 332 4 0.059
3
0.0231 0.945 8
4.12
Fl ID 8
347 327 4 0.052
9
0.0248 0.942 3
4
Fl ID 9
344 338 3 0.024
8
0.0141 0.982 5
2
VI. RESULTSANDDISCUSSIONS
Extensive analysis on the attributes of other routing protocols are presented in our previous research work. Results in graph and tabular form is observed from NS3 simulation. Throughput of optimized link state protocol are observed and compared as flow. Communication flow from source to destination ID is 10.0.0.14 10.0.0.3, the throughput has only few oscillations, but its average value is near to DTR value (448 kbps). As shown in the above table 2 of OLSR in Flow ID 6, the packet loss is 33 dues to which delay time is also increased. As the no of hops increase causes mean delay will also increase. We can observe from the table 2 in case Fl ID 2 the packet loss is 16 since the mean delay is lower due to
mean hop count. The analysis of delay for varying size of load is described here. In [3*3, 4*4, 5*5 and 6*6] scenario for optimized link state heuristic is given where the delay values for scalability of the protocols increase constantly when the number of hops increases.
A. DELAY
In flow ID 5 the transmitted and received packets are same so the Packet delivery fraction will be one and hence the delay and jitter value will be negligible, this is the only case when packets are transmitted to the same node otherwise for one hop transmission there will be some delay value.
Delay Hop count Jitter
1.26730
2 4
0.17000 5 1.16689
9 4.153846
0.12945 5
2.40319 4.153846
0.24166 6
As the load size on network is increased the mean delay is also increased. In case 4*4 the
B. JITTER
C. HOP COUNT
Throughput of routing protocol information transferred over a network with simulataneous transmission of intermittent packets should not be affected by interference.
Delay of the different flow IDs in case of OLSR is minimum as comapared to other routing protocols due to link stability mechanism provided in the heuristic.
Author-1 Photo
Author-2 Photo
Author-3 Photo VII. CONCLUSION
Scalability, throughput, goodput, delay and packet delivery ratio are important parameters for performance measurement of the routing protocols for heterogenous ad-hoc network. Proactive routing protocols have lower delay as compared to reactive routing protocols because path information is easily maintained at each router. Depending on scalability and transmission time performance of OLSR, AODV, DSDV and DSR is represented in different diagrams. Variation of pause time from 0-200sec with in a permanent topography of 300x1500 meters and node density is changed from 20 to 100. Throughput, goodput, Packet Delivery Ratio, average E2E Delay and Jitter are critical parameters in evaluating any routing protocol performance. For high mobility scenarios, OLSR is best routing protocol in terms of all parameters. DSDV is very effective and simple for small sized network and for moderate traffic scenario AODV is best choice. From the graph we can observe that when the size of grid and respective no of nodes are increased the resultant mean value of delay, jitter and respective hop count values are also increased. Mean delay is increased by 50% in case of (6*6) as compared to size of (4*4). Similarly, maximum mean value of hop count is observed (6.0, 8.05, 13) for size (4*4, 5*5 and 6*6) respectively. (0.17,0.31,0.54) are maximum jitter value observed for grid size of (4*4, 5*5 and 6*6).
ACKNOWLEDGMENT
It is optional. The preferred spelling of the word “acknowledgment” in American English is without an “e” after the “g.” Use the singular heading even if you have many acknowledgments. Avoid expressions such as “One of us (S.B.A.) would like to thank ... .” Instead, write “F. A. Author thanks ” Sponsor and financial support acknowledgments are placed in the unnumbered footnote on the first page.
REFERENCES
1.F. D. Rango, F Guerriero, April 2012 “Link Stability and Energy Aware Routing Protocol in Distributed Wireless Networks”, IEEE Transactions on Parallel and Distributed systems, vol. 4, pp. 210-216.
2. Miorandi, D., Sicari, S., De Pellegrini, F., Chlamtac, I.: Survey internet of things: vision, applications and research challenges. Ad Hoc Netw. 10(7), 1497–1516 (2012)
3. Sicari, S., Rizzardi, A., Grieco, L.A., Coen-Porisini, A.: Security, privacy and trust in internet of things: the road ahead. Comput. Netw. 76, 146–164 (2015)
4. Sicari, S., Cappiello, C., Pellegrini, D., Miorandi, D., Coen-Porisini, A.: A securityand quality-aware system architecture for internet of things. Inf. Syst. Front. 18(4), 665–677 (2016)
5. G`omez-Goiri, A., Orduna, P., Diego, J., de Ipina, D.L.: Otsopack: lightweight semantic framework for interoperable ambient intelligence applications. Comput. Hum. Behav. 30, 460–467 (2014)
6. Guo, B., Zhang, D., Wang, Z., Yu, Z., Zhou, X.: Opportunistic IoT: exploring the harmonious interaction between human and the internet of things. J. Netw. Comput. Appl. 36(6), 1531–1539 (2013)
7. Metzger, A., Chi, C.-H., Engel, Y., Marconi, A.: Research challenges on online service quality prediction for proactive adaptation. In: 2012Workshop on European Software Services and Systems Research - Results and Challenges (S-Cube), pp. 51–57, June 2012
AUTHORS PROFILE
First Author personal profile which contains their education details, their publications, research work,
membership, achievements, with photo that will be maximum 200-400 words.
Second Author personal profile which contains their education details, their publications, research work, membership, achievements, with photo that will be maximum 200-400 words.