Big Data Benchmarks of High-Performance Storage
Systems on Commercial Bare Metal Clouds
Hyungro Lee and Geoffrey C. Fox
School of Informatics and ComputingIndiana University Bloomington, IN 47408 Email:{lee212, gcf}@indiana.edu
Abstract—Bare metal servers are widely available on public clouds to provide direct access to hardware and the system config-uration with high performance storage and network devices are well suited for big data applications. Highly-optimized server with additional CPU core count and dense storage may lead to better performance in certain workloads and to ensure responsiveness of deployed services. Recent work on Hadoop ecosystems has addressed the performance improvement of scale-up machines configured with SSD storage and increased network bandwidth.
The paper evaluates big data processing on dedicated clusters and provides the performance analysis of NVMe devices and SSD block storage options available on Amazon, Google, Microsoft, and Oracle Clouds. We show the benchmark results along with the system performance tests as we want to demonstrate the compute resource requirements for large-scale applications. The system capacity and limits for the underlying servers are described along with the cost analysis of scaling workloads on these platforms.
Keywords—Benchmark, Performance Evaluation, Bare metal, NVME, SSD, Big Data
A. Categories and Subject Descriptors
H.3.4 [Systems and Software]: Performance evaluation (effi-ciency and effectiveness); H.2.4 [Systems]: Distributed systems;
I. INTRODUCTION
In the Big Data ecosystem, the bare metal server has become a high performance alternative to hypervisor-based virtual machines since it offers advantages of direct access to hardware and isolation from other tenants’ workloads. However, benchmark results or comprehensive data of in-frastructure options are not generally available. This paper reports on the results of a big data benchmark of commercial cloud services that have provided bare metal equivalent server types. This work aims to address data processing performance using Hadoop-based workloads including Terasort, and the results would be useful in designing and building infrastructure along with the cost analysis and performance requirements depending on use cases. We perform big data benchmark on production bare metal environments to demonstrate compute performance with local NVMe and block storage are tested as an alternative storage option.
We started using bare metal servers with Hadoop workloads because the previous work indicated the needs of the exascale-like infrastructure for data-intensive applications [1], and we wanted to see how these new servers perform differently with
additional computing power and large volumes of storage. Oracle Cloud Infrastructure has bare metal server types which offer 104 virtual cores with hyper-threading, 768GB memory and 51.2TB size of local storage per instance which can be better solutions to any existing big data problems in which massive intermediate data are generated rapidly for subsequent analysis with many CPU and memory intensive sub-tasks. Other cloud providers have a different configuration of those resources resulting in a broad range of choices in bare metal environments, for example, Amazon r5.24xlarge instance of-fers similar resources compared to Oracle in compute, memory and network except the local NVMe storage or z1d.metal for high CPU clock speeds. Google and Microsoft do not explicitly have bare metal servers but equivalent options are available to compare such as n1-highmem-96 with local scratch volumes on GCE and L64s v2 on Azure. Furthermore, persistent block storage can mitigate extra storage needs for those who have data-intensive workloads with large volumes. This is particu-larly helpful when terabyte-scale volume is not enough or data separation from compute is necessary. There is also a lack of evaluation data indicating actual performance optimization and designing efficient clusters with scalability.
Hardware performance data is subject to the actual execu-tion time of applicaexecu-tions, high IOPS and low latency storage devices contribute to the performance of I/O intensive jobs and FLOPS is a measure of provisioned computing resources, as well as high network bandwidth for fast communication. In practice, however, the complex workloads have multiple characteristics to detect tuning factors and inspect bottlenecks if exists and therefore performance evaluation with various scenarios is necessary for understanding the environment de-ployed.
Bare metal servers are widely available with various op-tions to add extra CPU cores, memory, and local NVMe as well as high network bandwidth. Big data users with data intensive application may utilize these configurations when vertically scaled clusters generate better performance than constructing many numbers of commodity servers. In addition, improved performance results in increasing cost efficiency as more resources are quickly returned for further use.
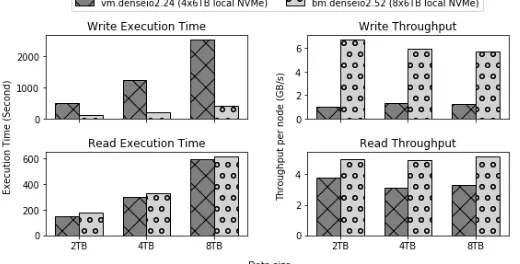
Fig. 1: TestDFSIO between VM and Bare Metal
environments, one with 8 worker nodes, 48 virtual cores each and the other with half number of the worker nodes, four, but increased core count, 104 virtual cores each. For writing task of TestDFSIO between 2TB to 8TB data sizes, about 4 to 6 times reduced execution time and throughput was observed on vertically scaled bare metal servers, i.e. BM.DenseIO2.52. For reading task of TestDFSIO, the throughput is slightly improved as data size increased from 2TB to 8TB for bare metal servers. Note that these two environments have same hardware specifications on local NVMe storage and CPU and memory although the bare metal setup has a few more core counts and memory sizes due to the different CPU/MEM ratio per server type.
With the advent of high performance storage options and reduced hardware costs, public data centers and academic plat-forms are now equipped with either solid state devices (SSDs) with Serial ATA (SATA) or NVMe SSD with PCI Express bus for better I/O performance than magnetic storage, i.e. hard disk drives (HDDs) and bare metal servers are typically offered with SSDs to support increased performance needs. Production cloud services have two storage types, one is temporal local terabyte-scale NVMe dedicated to a server instance and the other one is persistent remote petabyte-scale block storage. We tend to explore these options for I/O intensive workloads so that one can understand the difference between these two storage options for running big data workloads.
We know that bare metal servers are available on most production cloud environments but it is difficult to find the analysis of big data workloads across these environments. This paper is the first evaluation of commercial bare metal environ-ments focusing on various storage options for running big data applications. Amazon EC2, Google Cloud, Oracle Cloud, and Microsoft Azure are considered to run our experiments.
Fast and powerful hardware accelerates large data pro-cessing, and we have observed that real world workloads are a mixture of compute intensive, i/o intensive, and memory intensive, in which bare metal clouds can be a solution for these. We use built-in Hadoop benchmark tools which are useful to measure the performance of Hadoop systems by varying workload volumes and configurations. The workloads tested here include WordCount, PageRank, K-Means, TeraSort, and DFSIO and the performance data would be widely ap-plicable to various applications running on similar compute
environments.
The block storage is a network storage device which provides an individual mount point to access, and therefore multiple devices with various volume sizes can be attached and detached in a few steps. Block storage also ensures scalability as more attached volumes with increased sizes deliver additional capacity and performance. The service limit per server instance, however, prevents to scale vertically and requires to use additional instances for achieving increased performance. For example, Amazon Elastic Block Store (AWS EBS) generates 64,000 IOPS and 1,000 MB/s throughput per volume but extra I/O operations will be throttled if two or more volumes attached to the same instance. It is caused by the service limit, 80,000 IOPS and 1.7 GiB throughput per server and non-optimized server types for block storage may reduce these caps additionally.
We have tested Hadoop cluster using the block storage to demonstrate these problems. Table I is an IOPS comparison between block storage and local NVMe per server instance and the performance difference is ranging from 11 times (GCE) to 41 times (AWS). It is trivial that choosing local NVMe against block storage is good for high IOPS required workloads as long as the limitations do not apply. First, petabyte scale data would not fit into local NVMe as it is currently offered between 3TB to 51.2TB per instance. Amazon’s Block storage EBS offers up to 496TiB by attaching 31 volumes and Oracle allows up to 1PB by aggregating 32 attachments with 32TiB volume size each. Handling intermediate and temporal data would work better on local NVMe otherwise there is a cost moving data from/to other permanent storage. Processing data generated during analysis and simulation is a good use case in this context.
Block storage is convenient to use and applicable to Hadoop data nodes but there are several limitations. IOPS in the table cannot be achievable at a small volume size, and each provider has a different ratio such as IOPS per provisioned volume size. For example, Amazon provides 64k IOPS for the volume of 1280GiB or greater with 50:1 ratio. Google cloud provides 60k IOPS for the volume of 2048 GiB or greater with 30:1 ratio, Oracle cloud provides 25k IOPS for the volume of 417 GB or greater with 60:1 ratio. Note that the numbers in the table only indicate reading performance at a 4096 byte block size. It does not include IOPS for write with different block sizes which will be lower than those.
TABLE I: IOPS
Provider Block Storage IOPS Local NVMe IOPS AWS 80,000 (64,000 per volume) 3,300,000 Azure 80,000 (20,000 per volume) 2,700,000 GCE 60,000 (60,000 per volume) 680,000 OCI 400,000 (25,000 per volume) 5,500,000
In this paper, we emphasize on the performance analysis by evaluating Hadoop benchmark workloads and comparing the results with system metrics e.g. IOPS and FLOPS across the environments. Our results indicate that there is performance benefit of leveraging bare metal servers due to the increased compute resources per node in the Hadoop cluster but system upper limit may prevent fully utilizing provisioned resources when applications become I/O intensive. We also provide cost analysis for those workloads to show the economic benefits of provisioned resources so that one can choose the best option of running their applications with the consideration of the economic value and performance requirements.
The contributions of this work are:
• Comparing the performance of Hadoop workloads on different bare metal platforms
• Understanding the difference between block storage and local NVMe for I/O intensive workloads
• Providing the analysis of cost efficiency potentially reducing storage costs
The rest of the paper is prepared as follows. In Section II, we describe our experimental configuration and explain the results in the next section III. The section IV, we described related work briefly.
II. HARDWARESPECIFICATION ANDAPPLICATION LAYOUT
A. Experimental Setup
We built a Hadoop cluster with a various number of workers ranging from 3 to 8 and two master nodes and one gateway node. The deployment was completed by Cloudera 5.16.1.
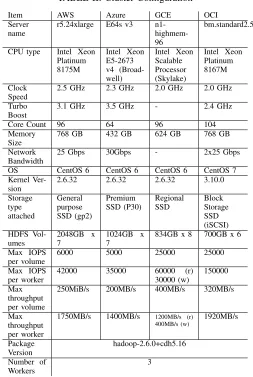
[image:3.612.320.573.69.446.2]Amazon EC2 has a memory optimized server type (r5.24xlarge) with Intel Xeon 8175M processors running at 2.5 GHz, with a total of 48 hyper-threaded cores, 96 logical processors and recently added bare metal server type i.e. r5d.metal is excluded in this experiment [3] which offers 3.6 TB size of local NVMe divided by four mount points. Microsoft Azure also has an E64s v3 server type which provides 64 virtual cores by Xeon E5-2673 processor and 432 GB size of memory. We noticed that the number of vCPUs offered by Azure is increased in powers of two and 96 and 104 vCPUs are not available in the ESv3 series. M128 server types are excluded because of the pricing ($13.338/hour for 2TiB of memory, and $26.688/hour for 4TiB). n1-highmem-96 server from Google Compute Engine offers 96 virtual cores on Intel Xeon Skylake and 624 GB of memory. Local scratch storage allows us to choose between NVMe and SCSI interface with a maximum volume size of 3TB. BM.Standard2.52 is a standard server type from Oracle with Intel Xeon Platinum 8167M
TABLE II: Cluster Configuration
Item AWS Azure GCE OCI Server
name
r5.24xlarge E64s v3 n1- highmem-96
bm.standard2.52 CPU type Intel Xeon
Platinum 8175M Intel Xeon E5-2673 v4 (Broad-well) Intel Xeon Scalable Processor (Skylake) Intel Xeon Platinum 8167M Clock Speed
2.5 GHz 2.3 GHz 2.0 GHz 2.0 GHz Turbo
Boost
3.1 GHz 3.5 GHz - 2.4 GHz Core Count 96 64 96 104 Memory
Size
768 GB 432 GB 624 GB 768 GB Network
Bandwidth
25 Gbps 30Gbps - 2x25 Gbps OS CentOS 6 CentOS 6 CentOS 6 CentOS 7 Kernel
Ver-sion
2.6.32 2.6.32 2.6.32 3.10.0 Storage type attached General purpose SSD (gp2) Premium SSD (P30) Regional SSD Block Storage SSD (iSCSI) HDFS Vol-umes 2048GB x 7 1024GB x 7
834GB x 8 700GB x 6 Max IOPS
per volume
6000 5000 25000 25000 Max IOPS
per worker
42000 35000 60000 (r) 30000 (w)
150000 Max
throughput per volume
250MiB/s 200MB/s 400MB/s 320MB/s Max
throughput per worker
1750MB/s 1400MB/s 1200MB/s (r) 400MB/s (w) 1920MB/s Package Version hadoop-2.6.0+cdh5.16 Number of Workers 3
resulting in a total of 104 logical processors. BM.DenseIO2.52 is a server type with eight of local NVMe in a total size of 51.2 TB from Oracle [4]. Table II provides the details of the server types with a hardware specification and we believe that these server choices are comparable although the numbers are not completely the same across different environments. We are aware that the performance gaps of provisioned resources among each other may reduce the consistency of our experi-ments and we address this limitation when we represent our results in the following sections.
B. I/O Test
TABLE III: Flexible I/O Tester (fio) Results (IOPS x 1000)
Block Size, I/O Pattern
AWS i3.metal 8 x 1.9T
Azure L64s 2 8 x 1.9T
GCE highmem96
8 x 375G
OCI
BM.DenseIO2.52
8 x 6.4T 4K, randread 2048.9 886.3 275.9 1334 4K, randwrite 1457.5 760.5 269.7 1098 4K, rw50 1528.5 840.9 345.2 1180 16K, randread 891 750.9 161.6 1088 16K, randwrite 378.1 534.4 90.7 713 16K, rw50 427.3 529.9 115.8 850 256K, randread 60.1 58.2 11.1 75.4 256K, randwrite 24.6 38.5 6.2 68.7 256K, rw50 27.6 33.8 7.9 82.6
Hadoop which requires high throughput for sequential reading and writing. Also, most high-end SSD devices generate steady performance across different block sizes although we find interesting results from the test. Amazon shows the best storage performance at a small block size, 2 million IOPS at 4k, but Oracle has significant performance at a large block size, 21.6 GB throughput per second. This will affect data intensive workloads of our experiments such as DFSIO, Wordcount, and Terasort. The results also revealed that Google does not offer comparable storage performance per instance in terms of IOPS and volume size and therefore scaling out approach would be appropriate to build a system for data intensive workloads. It is worth to mention that high IOPS for writing is important as frequent writing and deleting are expected. The local NVMe is created as an empty space when a server instance is launched and any data to analyze or permanent data to keep has to be copied from/to other space e.g. block storage. Changing the status of an instance may purge contents in the storage handling like temporal scratch space. With these IOPS, OCI produced the maximum 18 GB/s throughput whereas AWS produced 6.1 GB/s throughput for random write.
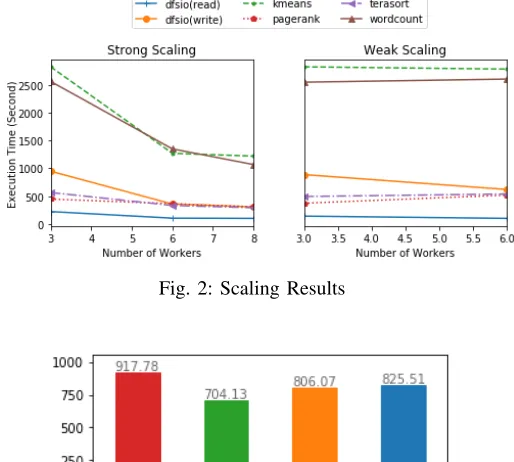
C. Scalability
We wanted to evaluate the scalability of our workloads by using the scaling context of HPC systems. Figure 2 shows Hadoop benchmark results to describe how our cluster handles terabyte scale data with additional worker nodes. The upper plot in the figure shows reduced execution time when the number of workers is increased. Each benchmark ran with the same data size over 3, 6, and 8 worker nodes which indicate good scaling with more resources. This is not always valid for certain workloads due to shuffling costs. Typical workloads go through data reduction from map to reduce phase which decreases the amount of data exchanged between nodes but in some applications e.g. PageRank may not or increase the amount of data transferred over additional worker nodes. I/O intensive workloads which can be partitioned by the number of mappers generally guarantee performance improvements over an increased number of nodes. Wordcount and DFSIO are identified in this context.
[image:4.612.50.302.86.202.2]The bottom plot of the Figure 2 depicts flat lines for processing an increased amount of data by adding more work-ers which are good for weak scaling. K-Means, Wordcount, and DFSIO are relevant to this interpretation. PageRank and Terasort were slightly worsened as more worker nodes were
Fig. 2: Scaling Results
Fig. 3: CPU Performance (GFLOPS)
added and this concludes the same results that we discussed in the strong scaling results, shuffling costs over multiple worker nodes. The tested data size are varied between 1.6TB and 3.2TB for Wordcount, 50 million and 100 million pages for PageRank, 1.2 billion and 2.4 billion samples for K-Means, 600GB and 1.2TB for Terasort and 2TB and 4TB for DFSIO. The worker node consists of 104 hyper-threaded CPU cores, 768 GB memory and a dual port 25GB Ethernet adapter.
III. EXPERIMENTALRESULTS
A. Compute Performance
Fig. 4: TestDFSIO between Block Storage and local NVMe
TABLE IV: Oracle I/O Performance (Per Instance)
Item 12 x 700 GB
Block Storage
8 x 6.4 TB
Local NVMe Difference 4K randwrite IOPS 303,000 1,098,000 3.62x↑
4K randread IOPS 292,000 1,334,000 4.56x↑
256K randwrite Throughput 3.0 GB/s 18.0 GB/s 6x↑
256K randread Throughput 3.0 GB/s 19.8 GB/s 6.6x↑
4k randwrite Latency 7,908µsec 1,455µsec 5.4x↓
4k randread Latency 8,205µsec 1,198µsec 6.8x↓
performance data as a reference, not a direct measure of the evaluation.
B. Storage Performance
We discussed the storage performance in the section I and evaluated by running TestDFSIO with data nodes on block volumes and local NVMe volumes respectively. With the understanding of the performance gaps, i.e. 652K IOPS vs 1334K IOPS, it is expected to see better results with local NVMe volumes but we may find other benefits using block storage. Figure 4 shows the comparison results between these two storage options by TestDFSIO write (upper subplots) and read (bottom subplots). First, the performance difference is significant as data size increased on both write and read tests. For the writing results, We find that 1.3 times reduced exe-cution time on NVMe for 360GB data and 2.4 times reduced execution time for 8TB data size. The write throughput results (subplot on the top right) explains why the gaps were enlarged. The write throughput on block storage was decreased but one on local NVMe was improved over increased data sizes. For the reading results, NVMe is not always better than block storage because Hadoop uses memory to retrieve data until it is overfilled. Only the first two bars show compatible results for reading because the worker nodes had 2.3GB memory in total. As a reference for these results, we also measured storage performance data, IOPS, throughput and latency which is described in the table IV. One observation for the write throughput is that the maximum throughput is reached by block storage according to the DFSIO results but local NVMe. We may find high I/O wait on the server with block storage and lack of CPUs to process I/O operations with local NVMe.
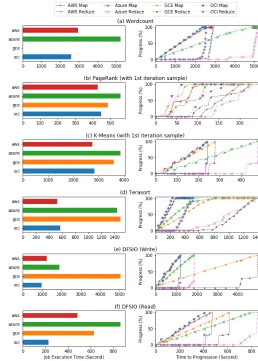
Fig. 5: Hadoop Workloads on AWS, Azure, GCE and OCI
C. Production Comparison
[image:5.612.52.298.267.338.2]stresses both CPU and storage and high IOPS are required. We find a similar result compared to PageRank. Both AWS and OCI completed the task in 10 minutes as GCE and Azure took about 24 minutes to finish. It explains that Azure needs more core count and GCE needs additional volumes to show similar results. We have additional experiments for Terasort, see Section III-D2. TestDFSIO has two tasks, writing and reading. We reduced the number of a replica to 1 which removes a data exchange task for better results but this will result in increased reading time. OCI completed writing in 15 minutes but GCE took 1 hour and 23 minutes. The cap of IOPS for write on GCE is 30,000 per instance and we suspect that this is a major contribution to the long execution time.
D. Workloads
We dedicate this subsection to describe Hadoop workloads. K-Means and Terasort implementation were explained with our experiments.
1) K-Means: The KMeans clustering method is a well known iterative algorithm and is a common example to exam-ine MapReduce functions. The distance computation between data points with centroids runs in parallel at a Map function step by reading the dataset from HDFS, and representing a new centroid to the subsequent iterations completes a cycle. The intermediate data is stored on HDFS, therefore I/O per-formance is critical as well as computing requirements for this workload.
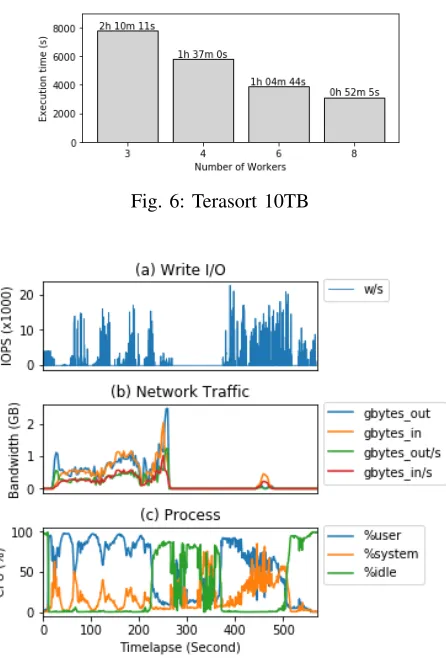
2) Terasort: Terasort is characterized by high I/O band-width between each compute and data node of a Hadoop cluster along with CPU intensive work for sorting 10 bytes key of each 100 bytes message. Running Terasort is a common measure of system performance and Figure 6 shows our results for handling 10TB size over a different number of workers. As we learned that Hadoop may skip data exchange between nodes if there are enough memory spaces, we increased the data size enough to overfill the available amount of memory in the cluster. Scaling efficiency was decreased after 6 worker nodes but we see linear scaling performance in our results. In addition, we also find that measured system performance data is useful to understand the behavior with the workload, especially if it requires a mixture of CPU and I/O resources. Figure 7 is added to show the system behavior for processing 600GB of Terasort data. The plot (a) Write I/O shows that many IOPS were generated during the reducer phase with the maximum of 22,528 IOPS. ’w/s’ legend indicates a number write operations per second in the plot. The second plot shows network activity and most traffic was generated during the mapper phase. The last plot in Figure 8 describes CPU utilization and we find that the system was idling slightly during the transition phase between mapper and reducer. The system monitoring can be applied to other workloads identify-ing bottlenecks occurred by lack of provisioned resources i.e. high iowait with low IOPS storage and poor network speeds with a saturated network adapter so that system performance is ensured without under provisioning.
E. Cost Efficiency
[image:6.612.335.558.52.383.2]The evaluation of the cost efficiency needs two sub metrics, one for evaluating the total CPU cost required for workloads and another one for evaluating the total storage cost.
Fig. 6: Terasort 10TB
Fig. 7: System Metrics for Terasort
Total Execution Cost (TEC) calculates the expense of the entire virtual cores provisioned by aggregating the individual wall time for completed workloads which is:
T EC= T X
n=1
cpun+storagen (1)
where cpun is the total cost of provisioned CPU cores per second, storagen is the total cost of provisioned storage volumes and T is the execution second of workloads.
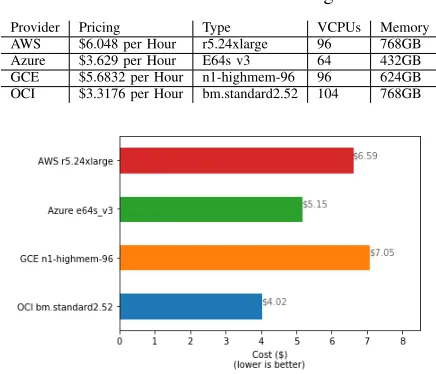
1) CPU: The server pricing consists of CPU cost, memory cost and storage cost and core count is the main factor to yield a final value. Cost analysis for running big data workloads on these infrastructures need to verify actual performance on CPU and storage. We already measured FLOPS in the section III-A and we just need to convert them with pricing so that one can understand how much they actually pay. We are aware that FLOPS is not perfectly accurate as a performance metric, and we seek other methods to compare among different VM server types. We created Figure 8 by applying FLOPS to pricing. BM.Standard2.52 is 45% cheaper than AWS r5.24xlarge according to the pricing in the Table V while the measured FLOPS are similar, 684 and 687 GFLOPS for AWS and OCI respectively.
TABLE V: Instance Pricing
Provider Pricing Type VCPUs Memory AWS $6.048 per Hour r5.24xlarge 96 768GB Azure $3.629 per Hour E64s v3 64 432GB GCE $5.6832 per Hour n1-highmem-96 96 624GB OCI $3.3176 per Hour bm.standard2.52 104 768GB
Fig. 8: Cost for 1TFLOPS
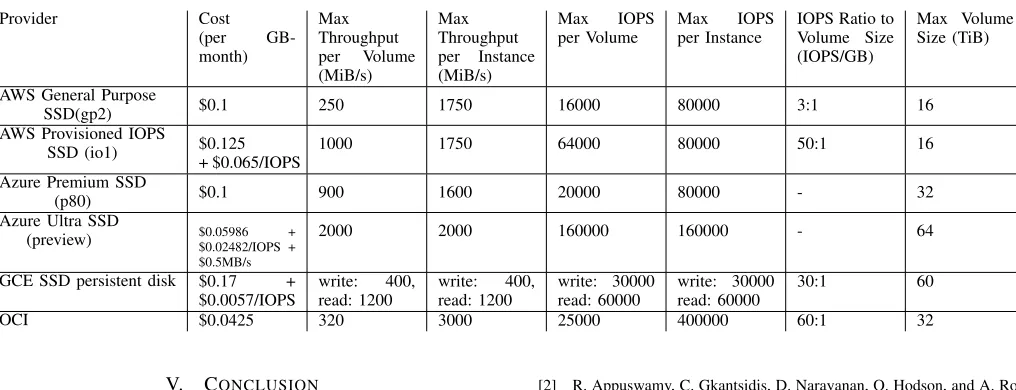
I/O intensive. Multiple options are available to reduce costs of provisioning high performance storage and several limitations exist based on the type of storage and the type of instance attached. Table VI indicates maximum IOPS and throughput for SSD based block storage and Google persistent SSD disk and Azure Blob is included as well to show similar storage choices among others. This will help plan a scalable system with performance and to avoid exceeding performance limits where throttling will occur to reject additional requests.
Maximum IOPS and throughput per instance is also an important metric because multiple volumes per instance can easily reach these limits. This also affects cost on provisioning block storage as they may require additional instances to have volumes with high IOPS or high throughput. In other words, a 64k IOPS EBS volume attached to an instance does not have additional space to ensure a maximum IOPS per volume as throttling occurs by instance IOPS limit. OCI produces great performance in this context, 400,000 aggregated IOPS per instance when multiple volumes attached with the maximum IOPS per volume, 25k. This will affect the cost effectiveness of block storage resulting in more instances, i.e. extra cost for the needs of high IOPS volumes.
With the high performance storage options, storage cost can be expensive with the extra charge on IOPS and throughput. The base pricing, however, is simple, OCI has the most inex-pensive price tag compared to others. For example, OCI block storage is $0.0425 per GB in a month which is 57.5% cheaper than AWS general purpose SSD (gp2), $0.1. In addition, IOPS and throughput may require additional charges to pay. AWS io1, Azure Ultra SSD and Google SSD persistent disk have an extra cost for provisioned IOPS and throughput. We added instance cap data in the table but these are not applicable to all server types. Many CPU server types are usually applicable with these maximum numbers but the numbers in our table were referenced from the following instance types: AWS r5.24xlarge, Azure Standard M128m, OCI bm.standard2.52. IOPS can vary by block sizes and I/O pattern e.g. sequential read or random write, but the numbers in our table were
prepared by 16384 bytes block size for reading in AWS, 8096 bytes block size for reading in GCE, and 4096 bytes block size for reading in OCI. Maximum throughput is for 128kilobytes or greater block size as IOPS affects this rate.
Block storage is offered by network storage solutions e.g. NAS or SAN and we find that throughput is more controlled than IOPS based on TableVI. For example, we see the maximum IOPS per instance is ranging from 60K to 400K but throughput is between 1.2GB/s and 3GB/s. It is mainly by the dedicated network bandwidth. However, we expect to have increased throughput in the near future as big data applications have to process rapidly growing data needs. Oracle, again shows good throughput performance, 3GB/s compared to other providers, although Oracle block storage shares network bandwidth with other traffic and iSCSI block storage. Luckily, Oracle has a dual port 25GB Ethernet adapter for bare metal servers, therefore additional bandwidth can be achieved by adding a new network interface card (NIC). Better throughput will improve the cost effectiveness of block storage, especially for data intensive applications.
High IOPS to volume size ratio is recommended to effec-tively provide storage devices if applications are sensitive to IOPS. A low ratio may have to provision unnecessary volume sizes to achieve high IOPS, especially in distributed data placements e.g. HDFS data nodes. For example, 3:1 ratio from AWS general purpose SSD (gp2) requires 5334GB volume size to achieve 16000 IOPS whereas 60:1 ratio from OCI ensures the same IOPS from 267GB or greater volume sizes. Table VI indicates that the minimum volume size to provision for maximum IOPS.
IV. RELATEDWORK
We use this section to describe the previous work related to the evaluation of bare metal servers, performance analysis of storage and address big data benchmark tools.
While there was a significant overhead created by virtual-ization with a hypervisor, research has been conducted [5], [6], [7] to evaluate cloud environments for seeking perfor-mance improvement. In a recent study, Rad et al [8] showed promising results on scaling HPC and scientific applications by OpenStack Ironic software and Omote et al [9] introduced non-virtualized development for bare-metal servers with a quick startup. These activities are not directly related to our work but their experiments indicated the performance benefits of bare metal servers.
There are several Hadoop benchmark suites available including HiBench and BigDataBench [10], [11] supported by Intel and Institute of Computing Technology, Chinese Academy of Sciences. These tools contain various big data workloads to evaluate the workload performance with low-level system information.
TABLE VI: SSD Based Block Storage
Provider Cost (per GB-month)
Max Throughput per Volume (MiB/s)
Max Throughput per Instance (MiB/s)
Max IOPS per Volume
Max IOPS per Instance
IOPS Ratio to Volume Size (IOPS/GB)
Max Volume Size (TiB)
AWS General Purpose
SSD(gp2) $0.1 250 1750 16000 80000 3:1 16 AWS Provisioned IOPS
SSD (io1) $0.125 + $0.065/IOPS
1000 1750 64000 80000 50:1 16 Azure Premium SSD
(p80) $0.1 900 1600 20000 80000 - 32 Azure Ultra SSD
(preview) $0.05986$0.02482/IOPS ++
$0.5MB/s
2000 2000 160000 160000 - 64 GCE SSD persistent disk $0.17 +
$0.0057/IOPS
write: 400, read: 1200
write: 400, read: 1200
write: 30000 read: 60000
write: 30000 read: 60000
30:1 60 OCI $0.0425 320 3000 25000 400000 60:1 32
V. CONCLUSION
With the advance of bare metal servers for big data work-loads, a significant amount of research have been accomplished with the latest techniques and hardware accelerations. The rapid increasing challenges in big data, however, extend the discussion to the exclusive and consistent compute resource, bare metal clouds which can be embraced by the big data community.
Our experiment results indicate that Hadoop systems provi-sioned by bare metal servers with powerful storage options can be better options to build a high performance virtual clusters for processing various workloads with a cost consideration. The result of our experiments delivers a thorough analysis of production environments with extensive research on storage options, i.e. block storage and local NVMe. Our results for Hadoop workloads on Amazon, Google Oracle, and Microsoft expose underlying hardware requirements e.g. IOPS, along with service limitations e.g. throughput allowance per instance. High storage performance made a significant impact on HDFS based jobs with a large number of virtual cores. JBOD-style (’just a bunch of disks’) non-RAID storage attachment shows 6 times better results with additional volume counts and CPUs per server than large numbers of low-end servers according to our result in Fig 1. Data intensive workloads, for that reason, may gain better scalability and efficiency on high capacity servers and bare metal servers are suitable for seeking performance improvements and cost savings.
In the future, we plan to extend our work to HPC server types evaluating communication intensive applications, and practical experience will be gained to improve actual perfor-mance with high-end network adapters.
ACKNOWLEDGMENT
We thank Oracle team, Lee Gates, Stephen Ferland and Zachary Smith for their technical comments and resource provisioning to run our experiments.
REFERENCES [1] G. C. Fox, “Large scale data analytics on clouds.”
[2] R. Appuswamy, C. Gkantsidis, D. Narayanan, O. Hodson, and A. Row-stron, “Scale-up vs scale-out for hadoop: Time to rethink?” in Proceed-ings of the 4th annual Symposium on Cloud Computing. ACM, 2013, p. 20.
[3] A. Amazon, “Amazon ec2 bare metal instances with direct access to hardware,” 2017.
[4] L. Gates, “Predictable, consistent, high performance computing with oracle bare metal cloud compute service,” 2017.
[5] J. Ekanayake and G. Fox, “High performance parallel computing with clouds and cloud technologies,” inInternational Conference on Cloud Computing. Springer, 2009, pp. 20–38.
[6] P. Rad, R. V. Boppana, P. Lama, G. Berman, and M. Jamshidi, “Low-latency software defined network for high performance clouds,” in2015 10th System of Systems Engineering Conference (SoSE). IEEE, 2015, pp. 486–491.
[7] G. Von Laszewski, H. Lee, J. Diaz, F. Wang, K. Tanaka, S. Kar-avinkoppa, G. C. Fox, and T. Furlani, “Design of a dynamic provi-sioning system for a federated cloud and bare-metal environment.” [8] P. Rad, A. Chronopoulos, P. Lama, P. Madduri, and C. Loader,
“Bench-marking bare metal cloud servers for hpc applications,” in2015 IEEE International Conference on Cloud Computing in Emerging Markets (CCEM). IEEE, 2015, pp. 153–159.
[9] Y. Omote, T. Shinagawa, and K. Kato, “Improving agility and elasticity in bare-metal clouds,” inACM SIGARCH Computer Architecture News, vol. 43, no. 1. ACM, 2015, pp. 145–159.
[10] S. Huang, J. Huang, J. Dai, T. Xie, and B. Huang, “The hibench bench-mark suite: Characterization of the mapreduce-based data analysis,” in
Data Engineering Workshops (ICDEW), 2010 IEEE 26th International Conference on. IEEE, 2010, pp. 41–51.
[11] W. Gao, L. Wang, J. Zhan, C. Luo, D. Zheng, Z. Jia, B. Xie, C. Zheng, Q. Yang, and H. Wang, “Big data dwarfs: Towards fully understanding big data analytics workloads,”arXiv preprint arXiv:1802.00699, 2018. [12] J. Bhimani, J. Yang, Z. Yang, N. Mi, Q. Xu, M. Awasthi, R. Pan-durangan, and V. Balakrishnan, “Understanding performance of i/o intensive containerized applications for nvme ssds,” in2016 IEEE 35th International Performance Computing and Communications Conference (IPCCC). IEEE, 2016, pp. 1–8.
[13] Q. Xu, H. Siyamwala, M. Ghosh, T. Suri, M. Awasthi, Z. Guz, A. Shayesteh, and V. Balakrishnan, “Performance analysis of nvme ssds and their implication on real world databases,” in Proceedings of the 8th ACM International Systems and Storage Conference. ACM, 2015, p. 6.
[14] B. Peng, H. Zhang, J. Yao, Y. Dong, Y. Xu, and H. Guan, “Mdev-nvme: a nvme storage virtualization solution with mediated pass-through,” in
2018{USENIX}Annual Technical Conference ({USENIX}{ATC}18), 2018, pp. 665–676.