1 Diversity in the Labour Market: The Role of Trade Unions, Creativity and Accent
By
Jilu Zhang
A thesis submitted for the degree of
Doctor of Philosophy at
The Australian National University
December 2018
i Declaration
I declare that this thesis is my original work dedicated to the Ph.D. degree of the Australian National University. The trade union chapter in this thesis has the same topic with my coauthored paper with Prof. Alison Booth, Prof. Richard Freeman, and Prof. Xin Meng. However, the chapter presented in this thesis is my independent work. In particular, the chapter in this thesis uses 3 waves instead of 5 waves of the RUMiC data and the chapter was written up by myself so only represenst my understandings. To my knowledge, no material contained in this thesis has ever been published before except those cited as references. The thesis consists of 226 pages and is within the 100,000-word limit.
__________________
Jilu Zhang
v Acknowledgement
I am greatly indebted to Professor Alison Booth, my principal supervisor. It is my fortune and honour to be supervised by such a supportive and encouraging supervisor. Professor Alison Booth not only provides critical comments on my research but also helps me with the implementation of the experiments. I deeply appreciate the freedom yet well-supported research environment she has created for me. Without her advice, guidance, and corrections this thesis would not have been possible.
I would also like to express my sincere appreciation to my panel members Professor Xin Meng and Dr. Juergen Meinecke. I work closely with Professor Xin Meng on two research projects. I have accumulated valuable first-hand experiences in data collection
and data handling from working with her. Her knowledge on the Chinese economy, in particular on rural-to-urban migrants in China, enhanced my understandings of the relevant issues. Dr. Juergen Meinecke guided me through my first independent academic research as part of my Ph.D. coursework. He also gave valuable comments following my presentations.
In addition, I would like to thank the faculty members and Ph.D. candidates at ANU for their intellectual support. Especially to Professor Simon Grant, Mr. Sanghyeok Lee, Dr. Patrick Leslie, Mr. Ieng Ng, and Dr. Sen Xue. Professor Simon Grant’s course on
Behavioural Economics familiarised me with the latest developments in Behavioural Economics and enabled me to understand empirical works systematically. Dr. Patrick Leslie and Mr. Ieng Ng took valuable time to read parts of my thesis and provide me with useful feedbacks. I also benefitted a lot from discussions of my experimental designs with Mr. Sanghyeok Lee and Dr. Sen Xue.
vi
and Dr. Vilas Gobin. The funding for the two experimental studies was provided by the RSE, ANU. Besides the CBE Behavioural Lab also provided additional funding to help me recruiting participants.
The three empirical chapters of this thesis have been edited by Ms. Karin Hosking. I
would like to thank her for her professional work.
Finally, I’d like to thank Jamie Cross, Minhee Chae, Nick Chow, Chenghan Hou,
vii
Abstract
This thesis presents three pieces of empirical evidence, about aspects of the labour market that are likely to be associated with differentials in labour market outcomes for different
sub-groups of workers.
Chapter 2 provides evidence on remuneration differentials associated with trade unions in China. The chapter investigates the union effect on the welfare of a particular group: rural-to-urban migrant workers in China. Using new individual-level panel data from the Rural-to-Urban Migration in China (RUMiC) survey, I find that migrant workers in establishments with a trade union presence receive more favourable remuneration than their counterparts in nonunion establishments. In particular, union-covered workers earn higher monthly income, are entitled to more forms of work-related insurance, and receive more valuable fringe benefits. Moreover, I also find a union-membership welfare premium when comparing union members with union covered non-members, a premium that likely arises due to variations in the activeness of workplace-level unions.
In chapter 3, I report the results of a novel laboratory experiment that investigates the impact of economic scarcity on a crucial but understudied input of labour production: creativity. Scarcity is introduced in the experiment through a randomly-applied negative shock to some subjects’ experimental wealth, after which subjects are required (i) to make
a decision that is potentially important to their wealth, and (ii) to perform a creative task and a ‘mechanical’ task. I find that, while boosting performance in the mechanical task,
economic scarcity harms creative performance. This latter effect arises through a narrowly focused mindset rather than through cognitive depletion. For workers who face
economic scarcity, either caused by their financial circumstances or a stimulation strategy, the results of this chapter suggest an impaired performance in jobs where performance depends on creativity. Thus, the impaired creativity is likely to disadvantage workers who experience scarcity in creativity-demanding occupations.
viii
decisions in the trust game. The audio clips are fictitious such that they are identical in the text but are delivered in two different accents. I include the Australian accent and the Chinese accent as accent variations in this study. Both Australian and Chinese participants rated all personal attributes of the Chinese accented speaker lower than the Australian accented speaker. While Chinese participants also send less to receivers with a Chinese accent, Australian participants show a similar level of trust towards both types of accents. The mistrust towards Chinese accent among Chinese participants is driven by
Chinese participants who do not regard their innate identities as important. Trust is the essential foundation of economic transactions including transactions in the labour market.
ix
Contents
Acknowledgement……….…………..iii
Abstract………..………..iv
List of Figures ... xii
List of Tables ... xiii
Chapter 1 Introduction ... 1
Chapter 2 Trade Unions and the Welfare of Rural-Urban Migrant Workers in China ... 5
2.1 Introduction ... 5
2.2 Background ... 9
2.21 The structure of the ACFTU ... 9
2.22 What do firm-level unions do? ... 10
2.23 How are firm-level unions expected to affect migrant workers’ welfare? ... 11
2.24 Diversified unions... 12
2.25 Covered non-members ... 13
2.26 The free-rider problem in union membership (Western literature)... 14
2.27 The free-rider problem in the Chinese context ... 15
2.3 Data and Summary Statistics ... 16
2.31 The RUMiC project ... 16
2.32 Subset of data used ... 16
2.33 Measures of union status and their summary statistics ... 17
2.34 Measures of diversity in firm-level unions ... 19
2.35 Measures of welfare ... 20
2.36 Complaint channels ... 23
2.37 Individual characteristics ... 24
2.38 Workplace characteristics ... 26
2.39 Additional control variables ... 27
2.310 Determinants of union status ... 28
2.4 Model Specification and Discussion of Estimation Methods ... 30
2.41 Model specification ... 30
2.42 Concerns about OLS estimation ... 31
2.43 Solutions to the problems of unobserved heterogeneity in OLS ... 33
2.5 Results ... 34
2.51 Union status and monthly income: OLS estimation ... 34
x
2.53 Individual FE estimation of monthly income ... 38
2.54 Work-related insurances differences: the impact of union status ... 40
2.55 Meals and accommodation... 43
5.6 Complaint channels and how they differ by union status ... 45
5.7 Diversity of firm-level unions: helpfulness, activeness and democracy ... 47
2.6 Conclusions ... 50
Appendix 1A ... 52
Appendix 1B: Meals and Accommodation questions ... 56
Chapter 3 Does Economic Scarcity Stimulate Creativity? Evidence from a Laboratory Experiment ... 57
3.1. Introduction ... 57
3.2 Background ... 59
3.21 Stimulating Creativity by Financial Incentives ... 59
3.22 Scarcity as a stimulus for creativity ... 61
3.23 Differences between this study and other empirical studies on the same topic ... 63
2.4 The focus on the divergent-thinking dimension of creativity ... 64
3.3 Conjectures ... 65
3.4 The experiment ... 65
3.41 Procedure ... 66
3.42 Scarcity inducement ... 68
3.43 Implementing the decision round and measure for cognitive cost ... 72
3.44 Creative performance and mechanical performance ... 73
3.45 Implementation ... 75
3.5. Descriptive Results ... 75
3.51 Demographic information for participants ... 75
3.52 The effectiveness of wealth shocks in creating wealth scarcity ... 78
3.53 The shocked do better in the mechanical task ... 79
3.54 Similar quantitative performances in the creative task ... 80
3.55 The shocked perform qualitatively worse in the creative task ... 82
3.6 Regression Results ... 83
3.61 Performance in creative task and mechanical task ... 83
3.62 Conjecture 1: Depletion of Cognitive Capacity ... 89
3.63 Conjecture 2: Narrowed focus ... 92
3.64 Perceived wealth scarcity ... 96
3.7 Robustness Check ... 97
xi
Appendix 2A ... 102
Appendix 2B ... 104
Appendix 2B.1 ... 105
Appendix 2C ... 107
Appendix 2D ... 112
Appendix 2E ... 119
Appendix 2F ... 122
Chapter 4 Trust and Accent: A Lab Study in Australia ... 138
4.1 Introduction ... 138
4.2 Conjectures ... 142
4.21 In-group bias ... 142
4.3 Experiment ... 145
4.31 Participants ... 145
4.32 Design ... 146
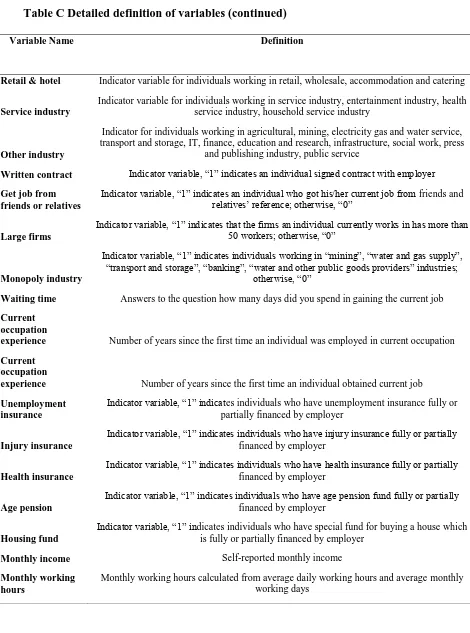
4.33 Accent Stimulations ... 147
4.34 Procedures and implementation ... 149
4.35 Trust and Subjective Personal Attribute Ratings ... 150
4.36 Identities ... 151
4.4 Summary Statistics ... 152
4.41 Demographics and Randomisation ... 152
4.42 In-Group Bias among Australia-Born Participants ... 155
4.43 In-Group Bias among Chinese-Born Participants (Identity) ... 157
4.5 Regression Analysis ... 159
4.51 Australia-Born Participants ... 159
4.52 Chinese-born Participants ... 162
4.5 Conclusions ... 165
Appendix 3A ... 167
Appendix 3B ... 176
Appendix 3C ... 179
Appendix 3D ... 183
Appendix 3E ... 183
Appendix 3F ... 184
Appendix 3G ... 185
Appendix 3H ... 187
xii
Bibliography ... 199
List of Figures
Figure 3. 1. Experimental Procedure... 68Figure 3. 2. Dynamics of the Experimental Wealth ... 78
Figure 3. 3 Number of Tables Correctly Counted in Mechanical Task ... 80
Figure 3. 4. Quantitative Performance in Creative Task ... 81
Figure 3. 5 Qualitative Performance in Creative Task ... 83
Figure 4. 1 Frequency against Time: Standardised Message with Australian Accent .. 148
Figure 4. 2 Frequency against Time: Standardised Message with Chinese Accent... 149
Figure 4. 3 Accent of the Receiver and Personal Attributes Ratings (95% C.I.) ... 155
Figure 4. 4 Trust and Accent of the Receiver (95% C.I.) ... 156
Figure 4. 5 Ethnic Identity and Personal Attributes Ratings (95% C.I.) ... 158
xiii
List of Tables
Table2. 1. Summary Statistics for Union Measures by Year ... 18
Table2. 2. Summary Statistics for diversity of firm-level unions ... 20
Table2. 3. Summary Statistics for welfare measures ... 22
Table2. 4. Summary Statistics for individual characteristics ... 25
Table2. 5. Summary Statistics for firm characteristics ... 27
Table2. 6. Determination of union status (first part) ... 28
Table2. 7. Selected results for OLS estimation of log income... 35
Table2. 8. Number of switchers separated by whether changed job ... 37
Table2. 9. Fixed Effect for income differentials ... 39
Table2. 10. Differences in work- related insurance entitlements... 41
Table2. 11. Fringe benefits: meals and accommodation ... 44
Table2. 12. Complaint Channels (multinomial logit) ... 46
Table2. 13. Additional union measures... 49
Table 3. 1. Summary of the Important Rounds ... 67
Table 3. 2. Example for Six by Six Tables ... 69
Table 3. 3 Information for the Wealth Shock (Shocked Group) ... 70
Table 3. 4. Information for the Wealth Shock (Non-Shocked Group) ... 71
Table 3. 5 Example for Eight by Eight Tables ... 72
Table 3. 6. Summary Statistics ... 77
Table 3. 7 Performance in Mechanical Task and Creative Task ... 86
Table 3. 8 Decision Time and the Detrimental Effects of Scarcity on Creativity ... 91
Table 3. 9 Narrowed Focus and the Detrimental Effects of Scarcity on Creativity... 94
Table 3. 10 Shortage and Creative Performance (IV Estimations) ... 95
Table 3. 11Alternative Measure of the Creative Performance (Replicate Table 3.10) ... 98
Table 4. 1 Statement for voice message recordings ... 147
Table 4. 2 The Question on Ethnic Identity ... 152
Table 4. 4 Demographics by Group ... 154
Table 4. 5 Accent, Personal Attributes, Trust (Australian Participants) ... 161
Table 4. 6 Accent, Personal Attributes, Trust (Chinese Participants) ... 163
1
Chapter 1
Introduction
Labour economics focuses on the interactions of workers with firms to shed light on wages, employment (and unemployment), and incomes. It consists of demand and supply of workers in the context of labour markets. Empirical labour researcher typically test hypotheses using real data to establish important relationships which enhance our understandings of the labour market. Traditionally, labour economists use survey based data to study outcomes such as wages, unemployment, and wage inequalities. Survey data contain rich information about the surveyed individuals and are usually representative on sub-groups of the population. Therefore, survey data are extremely useful in portraying stylized factors and describing patterns in the market. However, due to the broadly focused design, most survey data cannot be easily exploited to identify causal relations. In particular, identifying casual relations in cross-sectional surveys normally rely on suitable instrumental variables, which are difficulty to find and difficulty to verify. Compared to cross-sectional surveys, panel surveys eliminate individual time-invariant traits by observing the same individual multiple times at different time points. But due to confounded time-varying factors, panel data may also be imperfect for identifying casual relations in some circumstances.
2
are measured using economic games form the new parameters of interests in many areas of microeconomics (Croson & Gneezy, 2009; Engel, 2011; Johnson & Mislin 2011).
This thesis compresses three essays in the field of behavioural labour economics. The three chapters exploit data from a rich Chinese panel survey as well as from two lab experiments that I conducted at the Australian National University (ANU). The studies produce a number of new insights onto potential sources of differentials in labour market
outcomes among subgroups of workers with special focus on the labour market inclusion of certainty-disadvantaged workers. The three studies are embedded in relatively
independent contexts and literature, with the self-contained introductions and background information.
The power of survey data is well illustrated in the second chapter, where the richness of the panel survey enables us to present a detailed portrait of the only Trade Union in China-All China Federation of Trade Union (ACFTU). In particular, this chapter explores how ACFTU interacts with a marginalised workforce of rural-to-urban migrants in the Chinese labour market. Existing studies on the topic of ACFTU are all based on firm-level data and provincial level data, which are shown to provide different estimates of the union wage differentials comparing to individual-level data-based studies in the western union studies. I use the Rural to Urban Migration in China (RUMiC) survey which enables me, for the first time in the literature, to control for the detailed individual- and firm-characteristics and estimate an individual-fixed-effect model to address the potential self-selection bias in union differential estimations. I find that migrant workers in unionized workplaces receive more favorable remuneration package comparing to migrant workers in nonunionized workplaces. Furthermore, I also find a union member premium in union differentials which is similar to western literature.
3
there are many definitions of creativity, a widely accepted view is that creativity is the ability to come up with ideas that are novel and appropriate (Hennessey and Amabile, 2010). An active literature examines various measures for creativity, but commonly studied measures such as Torrance Tests of Creative Thinking cannot be found in economic surveys. Rather some economic surveys contain self-reported creativity measure as an element in the Big Five Personality Inventory. However, how useful is the self-reported measure is unclear. Moreover, creativity is a critical component of workers’
ability and thus is likely to be rewarded. Even with self-reported creativity and wealth level observed for the same individual, a positive relation between creativity and wealth
level (thus the opposite of scarcity) can be interpreted as the labour market rewarding more to workers with a high level of creativity. Therefore survey data are not very useful in studying whether scarcity depletes creativity. In contrast, in the specially designed experiment, scarcity in experimental wealth are randomly assigned to participants. Thus the lower creativity observed in the scarcity treatment compared to the control group must be a result of exposure to the scarcity. Using a lab experiment, I find that scarcity causes participants to be less creative through a narrowly focused mindset which prevents those affected from thinking laterally.
The fourth chapter explores another experimental research question that is impossible to be addressed by survey data. The study, for the first time in the economic literature, investigates mistrust solely based on the accent of the speaker. The process of globalisation bring workers from a wide range of language background together in the work place. Conversations are essential for almost every job and a trusted working environment saves businesses high transaction costs among internal cooperation. If accented speakers are trusted less, they may face the risk of being excluded from the labour market mediated by certain language. Chapter 4 examines whether the Chinese accent and Australian accent are treated differently by Chinese-born male students and
4
reject their innate identity drive the mistrust. I discuss why this may be the case in the chapter.
5
Chapter 2
Trade Unions and the Welfare of
Rural-Urban Migrant Workers in China
2.1 Introduction
The remarkable growth of the Chinese economy over the past three decades has resulted in uneven development. Wage differences between developed regions and less developed regions gave birth to huge numbers of internal migrants.1 In 2014 there were 168.2 million inter-provincial migrant workers nationwide.2 Most migrant workers do not have appropriate skills and experiences for urban jobs.3 Consequently, they have weak individual bargaining power in negotiating wages and working conditions with employers. Moreover, due to their abundant supply and the lack of protection by authorities, a large proportion of migrant workers are illegally treated.4,5 For example, only 30% of inter-provincial migrant workers in China are provided with injury insurance, which is one of the five types of work-related insurance granted by the Labour Law.6
A natural way for migrant workers to improve their welfare and protect their legal rights is to combine together and bargain collectively with employers. This is precisely the function of trade unions in Western countries. An effective union can result in higher wages and better employment conditions and benefits. Numerous studies of Western unions show that union workers earn higher wages (see inter alia Lewis, 1986; Stewart, 1994; Booth, 1995; Hirsch, 2004) and receive better non-wage benefits (Freeman 1981;
1 In 2014, average annual income in Guangdong province was 59,481 RMB compared to 42,179 RMB in
Henan province. Data from National Bureau of Statistics (NBS) of China website.
2 National data about migrants comes from the migrant monitoring report accessible from http://www.stats.gov.cn/tjsj/zxfb/201504/t20150429_797821.html
3 In our sample, only 5% of migrant workers have non-agricultural experience in their hometown.
Nationwide, only 63% of migrant workers have completed high school or above high school education.
4 There were still about 380 million workers in rural areas where income is much lower than developed
regions in 2014. Data from NBS.
5 According to its constitution, the ACFTU is an organsation for workers. However, migrant workers were
treated as peasants rather than workers before the enactment of a note issued by the ACFTU headquarters in 2003 (Cooke, 2013).
6 Employers in China are required to provide five types of insurance to every employee they hire. These
6
Budd 2007), when compared to non-unionised workers. Moreover, these effects are larger in industries where product market rents exist (Stewart, 1990).
Compared to Western unions, the institutional framework is very different in China. The All-China Federation of Trade Unions (ACFTU) is the only legal trade union.7 Because of this institutional structure – which we shall describe in more detail shortly – unions in China are commonly held to lack both the motivation and capability to represent workers (Chen, 2009; Metcalf & Li, 2006; Taylor & Li, 2007). In particular, union branches higher
up the ACFTU hierarchy are subordinate to the Chinese Communist Party, while the grassroots firm- and establishment-level branches are normally under complete control of the management team.8 Therefore, unions in China are not an effective institution for collective bargaining because they are not expected to solely maximise workers’ welfare.
Without institutional channels for expressing their demands, workers on occasion take extreme action in response to their poor working conditions; examples are spontaneous strikes and protests expressing conflict between labour and capital.9 Some individual actions also arouse widespread social concerns; for instance, in 2010, fourteen migrant workers in the Foxconn factory committed suicide. Although most of the workers who committed suicide did not express demands for improving working conditions, the tragedy was popularly ascribed to poor working conditions. These extreme actions cause social unrest and political instability. Consequently, there is growing pressure – from both government and society – on the ACFTU to fulfil its role of protecting workers and
institutionalises the resolution of labour conflicts.
Against this background, an important question is whether unions in China can improve employees’ conditions at work. An important group of workers is rural-urban migrant
workers, a group that is not only large but also often illegally treated. To date, all existing
quantitative studies of Chinese unions are based on firm-level or provincial-level data,
7 All grassroots unions in China need to register with the ACFTU and are supposed to follow instructions
from upper levels of the hierarchy system employed by ACFTU.
8 Discussion about the hierarchy system is provided in the background section below.
9 36.5% of all mass incidents in China are due to workers’ collective actions in attempting to protect their
7
and none have been specific to migrant workers. Although these studies produce mixed results with regard to union influence on a number of important outcomes, their results on insurance provision are consistent: they all find that unionised firms provide more legally required insurances to workers (Lu et al., 2010; Ge, 2007; Ge 2014; Yao & Zhong, 2013). For the union-wage effect, while some researchers found a positive relationship between union presence and the average wage paid by the firm (Ge, 2007; Ge, 2014; Yao & Zhong 2013), others find an extremely small or no relation between wages and
unionisation (Lu et al., 2010; Anwar & Sun, 2015). Unionised firms are also found to be associated with higher productivity (Fang & Ge, 2014; Lu et al., 2010), lower productivity
(Anwar & Sun, 2015), lower profitability (Fang & Ge, 2013; Anwar & Sun 2015), and greater fringe-benefit costs (Yao & Zhong, 2013). Of these studies, some attempt to deal with the endogeneity of firms’ unionisation decisions by using an IV estimator (Ge, 2014;
Lu et al., 2010) or the matching method (Anwar & Sun, 2015). Budd et al. (2014) exploit the panel nature of their provincial-level data from 1994 to 2008, finding that an increase in provincial-level union density has no impact on the average provincial wage but is associated with a higher GDP growth rate.10
There are still some unaddressed issues in the existing literature on trade unions in China. Previous studies, all based on firm-level data, are unable to address the issue of self-selection of workers who choose to work in unionised firms. Concern about self-selection bias in the existing literature is magnified by the fact that firm- or workplace-level data usually do not contain detailed information on individual characteristics. The second issue is the lack of variables to explore heterogeneity in firm-level unions. Although most studies address the potentially heterogeneous effects of firm-level unions by reporting results from subsamples where firms are more homogeneous, none so far has directly measured the differences in workplace-level unions. The third issue is that no study so far has distinguished union members from non-members within unionised establishments.
Differences between these two groups have been extensively studied in the Western literature (especially in Europe) to shed light on the ‘free-rider’ problem in union
membership, and we shall review this below. However, whether being a member or covered non-member is also relevant in the Chinese context is to date unknown.
8
This chapter uses the 2012–2014 waves of the Rural-to-Urban Migration in China (RUMiC) survey to address the above three concerns. RUMiC is an individual-level panel with details provided in Section 3. Exploiting the panel nature of the data, this study presents the first individual-fixed-effects estimation in Chinese union studies. Compared to existing studies, the use of the fixed-effect (FE) model in the current study removes the individual-time-invariant fixed effect. Results of the FE estimations suggest that both union members and covered non-members earn significantly higher monthly income and
are entitled to more of the legally required insurances than their non-union counterparts.
Thanks to the detailed questions about workplace unions asked by these three waves of the RUMiC survey, this chapter is also able to address other concerns. I measure differences in firm-level unions by worker-evaluated activeness, helpfulness, and the level of democracy of their workplace unions. The results show that, while workers in inactive and weak firm-unions are entitled to more legally granted insurances, only workers in active and helpful firm-level unions earn significantly higher monthly income. In fact, covered non-members get a positive union income differential only when covered by active or helpful unions. Similar to activeness and helpfulness, differences in the level of democracy do not affect workplace-level unions’ impact on insurance entitlements but do have a positive – though statistically insignificant – impact on income.
Distinguishing members from covered non-members, this study finds non-trivial differences in income, insurance entitlements, and the value of fringe-benefit packages between these two groups. However, these differences are likely to reflect the fact that union members are more likely to be found in workplaces with active unions, rather than unions discriminating against covered non-members.
9
In sum, this chapter illustrates that ACFTU workplace-level branches can benefit migrant workers in current institutional settings. I also find that Chinese unions can be effective in preempting spontaneous collective actions, as unionised workers are less likely to express work-related grievances through personal channels.
The rest of the chapter sets out as follow. Section 2.2 provides background information needed for interpreting our findings, while Section 2.3 describes the data and provides
summary statistics for important variables. Section 2.4 presents the specification used for empirical analysis and discusses the relevant econometric issues, Section 2.5 shows the results, and Section 2.6 concludes.
2.2 Background
2.21 The structure of the ACFTU
Although this study focuses solely on workplace-level unions, this section briefly discusses the institutional structure of unions in China and its implications for the
workplace to facilitate reader understanding.
Labour law stipulates that the ACFTU is the only legal trade union in China (for a useful summary in English, see Baker & McKenzie, 2013).11 All unions in China need to register themselves with and follow the leadership of the ACFTU. The ACFTU employs a hierarchical system to manage its sub-branches. At the top of the hierarchy is the national headquarters, which follow the leadership of the Chinese Communist Party. Below the national headquarters, there are 31 provincial unions and 10 industry unions. The same hierarchical structure also extends from national headquarters to county-level unions.
11 In 1995, to assist in modernising China’s labour system into a labour contract system based on greater
10
At the bottom of the hierarchy are the workplace-level unions. Unlike the other levels of unions – which are like government bureaus – firm- and establishment-level unions are much more diverse. They are not usually backed up by government administrative power, and thus they are commonly controlled by firm management. However, union law does give the ACFTU the right to send a union official to any firm-level union, although this rarely happens in practice. In principle, any group of workers can establish a union by registering it with the ACFTU. However, in practice, there are reported cases where the
ACFTU has rejected workers' attempts to form their own unions.12 Due to the diverse ways of establishing a union – and to the loose connection with the party-state –
firm-level and workplace-firm-level unions are more heterogeneous than unions ranked higher in the hierarchy.13
2.22 What do firm-level unions do?
Based on national data from the first Chinese Economic Census, Ge (2007) provides important information on the activities of firm-level unions. In decreasing order of observed frequency, firm-level unions are engaged in collective contract negotiation, labour dispute mediation/arbitration, supervision and inspection of labour protection, legal supervision and help, skills training and skills competitions, and financial support to employees with difficulties. From a micro perspective, the involvement of firm-level
unions in these activities has been confirmed by various case studies (Zhang, 2009; Liu, 2010; Metcalf and Li, 2006; Lee, 2009). However, the quality of these activities is unclear.
For example, although firm-level unions do represent workers in the negotiation and signing of collective contracts, it is reported that conditions in collective contracts are copied from minimum legal requirements (Liu 2010; Metcalf & Li, 2006). In addition to the above activities, the organisating of entertainment events is often observed, but has been interpreted as evidence for firm-unions’ nonfeasance in worker protection (Feng, 2006).
12 In one case, a group of construction workers in Beijing unsuccessfully attempted to establish their own
union because the ACFTU rejected their requirements. http://www.ilabour.net/html/xsdytd/lgrd/2618.html 13 For a more complete discussion about the structure of the ACFTU see Taylor and Li (2007) and Metcalf
11 2.23 How are firm-level unions expected to affect migrant workers’ welfare?
Firm-level union activities are expected to help migrant workers improve their welfare. The most frequently documented union activities – such as promoting collective contracts, offering legal help, arbitrating labour disputes, and inspecting labour protection – are all useful in law enforcement. They not only provide grievance channels for illegally treated workers but also play a role in raising workers’ self-awareness of their rights. From the
perspective of unionised workplaces engaging in the above activities, the cost of labour exploitation is higher, because both workers’ awareness and the availability of grievance
channels increase the likelihood of punishment for illegal treatment of workers. Therefore, unionised migrant workers should be less likely to be illegally treated than their non-union counterparts.
China’s social insurance scheme consists of five funds (old age pension insurance; basic
medical insurance; occupational accident insurance; unemployment insurance; maternity insurance). Employers, and in some cases employees, are required to make contributions to these funds, in accordance with rates determined by local authorities (Baker & McKenzie, 2013). Given that legally required insurances are poorly implemented among migrant workers, union-covered migrant workers should be entitled to more legally required insurances if unions do functioning as labour law enforcement power.14 In
contrast to insurances, minimum wage requirements are, in general, better implemented: the proportion of migrant workers who are paid less than the legal minimum wage is small.
For example, in our sample, only 41 out of 1567 workers were paid less than the minimum wage in Shanghai. Therefore, activities which only help with law enforcement are not expected to improve migrant workers’ wages.
Other activities may help migrant workers improve their welfare above the ceiling of legal requirements. Training is helpful for migrant workers to accumulate valuable skills. Skills competitions also provide migrant workers with incentives to learn job-related skills and even provide participants with promotion opportunities. Specialised skills and career development opportunities may incentivise migrant workers to stay in the city for
14 Nationwide, the portion of migrant workers who are entitled to the five legally required insurances and
12
a longer period. More stable urban life and long-run orientated plans, in turn, benefit human capital accumulation. Even entertainment activities provide migrant workers with opportunities to expand their narrow social networks in the city. A larger network helps migrants to assimilate better into city life and the work environment. Therefore, these union activities are all expected to benefit migrant workers beyond enforcing the minimum legal requirements.
2.24 Diversified unions
The discussion above on union activities has already shed light on the diversified activities of firm-level unions. In summary, firm-level unions are not monolithic, owing to differences in the ACFTU’s unionisation strategy, the market conditions faced by firms,
and awareness of entrepreneurs (Liu, 2010; Chen, 2009). The next subsection explores reasons why firm-level unions are so diversified and the implications of this diversity.
Liu (2010) discusses in detail the differences between firm-level unions. All firm-level unions can be classified into two categories according to the way they are established. First, the ACFTU’s traditional approach in establishing firm-level unions is to cooperate
with management. Therefore, firm-level unions established in this way are under the control of management, and consequently lack the capacity to represent workers in
collective bargaining.
This category of firm-level unions can be further broken into two subgroups depending on managers’ awareness of labour protection. On one hand, in firms where entrepreneurs
13
firms with ‘paper unions’ are likely to cooperate, as the ACFTU local branch is backed
up by government administrative power.
There is a second broad category of firm-level unions that is fundamentally different from those described above, due to the way these unions are established. A new strategy used by the ACFTU to establish firm-level unions in certain regions is to form union associations that are essentially a combination of firm-level unions across several firms in the same industry and region. Union associations are independent from enterprise
management and are backed by government administrative power; thus, the existence of a union association requires strong support from local government. From a worker’s
perspective, a union association can be regarded as a firm-level union, as it will organise activities and participate in collective bargaining in each firm of the association. Due to their looser connection with management, union associations are better motivated to represent and protect workers. According to Liu (2010), they are involved in ‘real’ collective bargaining where conditions are not limited to minimum legal requirements.
The existence of ‘paper unions’ is a unique feature of Chinese trade unions. The inactive ‘paper unions’ should be less effective in improving workers’ welfare, and thus
interpretation of our empirical results will be made on the basis that inactive unions are less effective in improving workers’ welfare. We also expect that union members are
more likely to be found in active unions. Because active unions organise more activities and are more likely to improve workers’ welfare, they should be more attractive to workers than ‘paper unions’. Therefore, union members should be more likely to be
covered by active unions than inactive unions. The predictions discussed in this section are, it will be shown in a later section, crucial for understanding our empirical results.
2.25 Covered non-members
14
as the sole measurement in empirical studies (see for instance Andrews et al., 1998). Although official ACFTU data claims that 92% of unionised workers are union members, the proportion is 34% in RUMiC sample.15 In other words, two thirds of unionised migrant workers are covered non-members. The proportion of covered non-membership suggests that it might be interesting to explore the impact of firm-level unions on this group of workers. But, first, the next subsection discusses the ‘free-rider’ problem of union membership in the Chinese context. The ‘free-rider’ problem in union membership
is an extensively studied topic in Western union literature.
2.26 The free-rider problem in union membership (Western literature)
The ‘free-rider’ problem in union membership discussed in the Western literature can be
explained as follows. In both the UK and the US, union members have to pay a certain proportion of their wages as union dues. However, unions typically do not set different wages for union members and covered non-members in collective bargaining (Booth &
Bryan, 2004). Therefore, in the absence of closed shops where membership is compulsory, it is possible for workers to enjoy higher wages negotiated by unions without paying
union dues; this is a traditional public goods scenario.
To mitigate free riders, many Western unions have provided excludable goods to union
members such as reputation (Booth, 1985; Naylor & Cripps, 1993), physical working conditions, promotion channels, and grievance channels (Chatterji & Booth, 1995).
Moreover, some empirical studies document a positive wage premium for union members compared to covered non-members (Blakemore et al., 1986; Budd & Na, 2000; Eren, 2009) and more work-related insurance (Buchmueller et al., 2002), thus suggesting that in some institutional contexts and countries unions discriminate against covered non-members in welfare to discourage free riding. However, other studies suggest the membership wage premium may reflect the fact that members are more likely to be observed in strong unions, which raise workers’ wages to a higher level (Booth & Bryan, 2004; Bryson, 2002).
15 Data from NBS of China based on year 2009, accessible via
15 2.27 The free-rider problem in the Chinese context
The funding system for firm- and establishment-level unions in China mitigates the risk of free riding on union membership. There are three sources of funding that ACFTU firm-level branches may receive. These are union dues paid by union members, the 2% payroll tax paid by firms, and government funding. Government funding is rarely provided to firm-level unions. Besides, although the 0.5% union dues are only payable by union members, the amount is small and the collection of dues is imperfectly executed. Hence the major source of funding for firm-level unions is the targeted 2% payroll tax paid by unionised firms.16 As the tax base of 2% payroll tax is for all workers in a unionised firm, it is equivalent to a coerced union charge for all union-covered workers. Operating in this funding system, firm-level unions can exist even without union members.
Therefore, firm-level unions in China are not expected to be concerned about eliminating free riders. Consequently, firm-level unions should have no incentives to make any of their services exclusive to union members. Nor do firm-level unions have incentives to discriminate against covered non-members. From this perspective, we should expect few or no welfare differences between covered non-members and union members.
In practice, we might still observe a union-member welfare premium for two reasons. First, although firm-level unions may have no intention of excluding covered non-members from union activities, such activities can be regarded as semi-exclusive to union members to the extent that members are more likely to be informed about these activities. As already noted, these activities may help migrant workers accumulate skills and thus
improve their welfare. Therefore, we might observe higher welfare for union members because they have participated in such activities. Second, union members might be more likely to be found in active unions because active unions attract workers to join. At the same time, active unions do a better job in improving workers’ welfare. Therefore,
observed welfare differences between covered non-members and union members may reflect a higher likelihood that observed members are covered by active unions.
16 Although Liu (2010) pointed out that union dues are not strictly implemented, my argument still applies
16
2.3 Data and Summary Statistics
2.31 The RUMiC project
As noted, the data source is the 2012 to 2014 waves of the Rural-to-Urban Migration in China (RUMiC) survey. Started in 2008, RUMiC aims to collect data to better understand internal migration in China. The initial wave, which surveyed 5,000 randomly selected migrant households from 15 cities in 9 provinces, was conducted in 2008. The 15 cities are selected such that migrant households in these 15 cities are a good representation of the whole population of rural-to-urban migrant workers in China. The selected cities were Guangdong, Dongguan, Shenzhen, Zhengzhou, Luoyang, Hefei, Bengbu, Chongqing, Shanghai, Nanjing, Wuxi, Hangzhou, Ningbo, Wuhan and Chengdu. These accommodate
38% of all rural-to-urban migrant workers in China using 2005 1% Population Survey data (Sen, 2015).
In each subsequent year from 2008, efforts have been made to track those households who were surveyed in previous years. Households that have been successfully tracked form the longitudinal part of the RUMiC data. RUMiC has added a random sample of new households in each wave to bring the final sample of each wave back to the original number of around 5,000 households. Because migrants are mobile, the attrition rate is high for the RUMiC project.17 The positive side of the high attrition rate is that the new households added in each wave effectively form a representative sample of Chinese migrant households in that year. Thus, in addition to the longitudinal part of the data, RUMiC also has a repeated cross-sectional component.18
2.32 Subset of data used
The 2012 to 2014 waves of the RUMiC data are particularly useful for union studies since they include for the first time a number of questions about participants’ workplace unions. These questions enable researchers to study trade unions from the perspective of migrant
17 According to Meng & Xue (2017), the attrition rate for first two waves is about 65%.
17
workers. I pool together both the representative part and longitudinal part of RUMiC data from 2012 to 2014. To capture any possible differences between the representative sample and longitudinal sample, regression specifications presented in this chapter always include a dummy variable to indicate longitudinal observations. To focus on the most comparable population of unionised workers, the sample is limited to working-age labour-income earners. In particular, the final sample excludes individuals younger than 16 or older than 60 at the survey date. In addition, self-employed individuals and unpaid
workers are also excluded. Lastly, observations with missing union status are also excluded.
One of the challenges facing union studies that use panel data is measurement errors in union status (Freeman, 1984; Koevoets, 2007; Hirsch, 2004). To mitigate this problem, I carefully checked the consistency of panel observations by gender and age. This eliminated mismatches caused by mistakes in participant identification numbers. In addition, I exclude observations where workers did not change jobs but were observed to become non-unionised from a unionised status in the previous period. This group of observations are likely to be workers who misreported their union status.19 Sentence 12 of the Union Law stipulates ‘No entity has the right to dismiss or merge established unions at will’.
The resulting subsample contains 14,193 pooled individual-year observations. Among them, 5,836 individuals are only observed once, 1,999 individuals are observed twice, and 1,430 individuals are observed three times.20
2.33 Measures of union status and their summary statistics
There are two separate questions asking about an individual’s union status in the RUMiC
survey. Participants were asked whether their workplace had a trade union. A further question – ‘Are you a union member?’ – was asked of those whose workplace had a union.
19 I dropped 134 observations for this reason, which is relatively large among observed union status
switchers. It suggests that the misreporting of union status is considerable in our data and we will provide detailed discussion about how misreporting is likely to affect our results later.
20 All of the cross-sectional results are robust to weighting each observation in pooled sample by 1/ (number
18
These two questions naturally divide all observations into three subgroups: workers in non-unionised workplaces, workers in unionised workplaces but not union members, and union members in a unionised workplace. Three dummy variables were created to identify the three subgroups of workers.
Table2. 1. Summary Statistics for Union Measures by Year
Table2.1 summarises the composition of the three groups of workers by year. 5.86% of the observations are union members and 11.28% are covered non-members. The member density and covered non-member density are relatively stable across the three years. Combining both covered non-members and union members, 16.98% of workers are covered by a workplace union. Compared to documented union coverage of 35.1% (Ge, 2007), 69% (Yao & Zhong, 2013) and 38.7% (China Union Statistical Yearbook, 2013), the union coverage rate in the current sample is lower. The lower coverage rate can be
explained by several factors related to the fact that RUMiC surveys the individual rural-to-urban migrant workers. First, migrant workers concentrated on the private sector and small workplaces, where the unionisation rate are low.21 Moreover, case studies suggest that workers may not know their workplace is unionised in firms or workplaces covered by inactive unions (Liu, 2008; Metcalf & Li, 2005). Existing union coverage rates are all based on firm-reported data and thus should have a higher unionisation rate compared to the individual-level data used in this chapter.
21 76.6% of our migrant workers are in private-sector workplaces and 50.28% of our migrant workers are
in workplaces with fewer than 50 employees. Although overall union coverage is reported to be 35.1%, only 8% of private firms were union-covered in 2004 (Ge, 2007). Yao and Zhong (2013) use data on large firms that are more likely to be the target of the ACFTU for establishing firm-level unions.
VARIABLES 2012 2013 2014 Total
Non-unionised 4,273 3,663 3,847 11,783
(proportion) (84.63%) (80.05%) (84.22%) (83.02%)
Covered non-member
501 565 512 1,578
(proportion) (9.92%) (12.35%) (11.21%) (11.12%)
Union members 275 348 209 832
(proportion) (5.45%) (7.60%) (4.58%) (5.86%)
19
Unlike the union coverage rate, little information is available about the union membership rate in China. Ge (2014), using 2004 data, reports an average membership density of 32.6%. Although Ge (2014) is limited to the manufacturing industry and the data was collected a decade ago, the sample used in the chapter has a similar union membership rate of 34.5%.
2.34 Measures of diversity in firm-level unions
To address the diversity of firm-level unions discussed in Section 2.24, I measure the workplace-level union characteristics on three dimensions: activeness, helpfulness, and level of democracy. The activeness of a workplace union is measured by workers’ responses to the question: ‘Have you taken part in any activities in your work union?’.
Answers to the above question naturally generate a dummy variable indicating whether or not a workplace union is actively organising events for the workers. Note that the same dummy can also be interpreted as measuring whether the union-covered worker is active in participating in organised activities. However, a worker can participate in union-organised activities only if they are covered by an active union. Considering the existence and the relative ubiquitous of ‘paper unions’ among Chinese firm-level unions, I argue the measure is, at least, an indicator for ‘non-paper-unions’.
Similar to the discussion on activeness, the other two measures on helpfulness and democracy are worker-reported and thus may capture the subjective perception of the workers rather than the objective characteristics of their workplace unions. However, it is difficult to imagine that workers would have a helpful and democratic perception of a ‘paper union’. Therefore, they are also valid measures for the heterogeneity in workplace
unions.
Based on the question ‘Did the labour union offer help to workers in your firm?’, I
generate a dummy variable to indicate whether workers think their workplace unions are helpful. The democratic measure is constructed from answers to the questions ‘Who
appoints the leader of the labour union in your work unit?’. In principle, the measure
20
data. Instead, I also consider unions with union leader appointed by someone in the workplace but with consideration of workers’ opinions as democratic unions.
Table2. 2. Summary Statistics for diversity of firm-level unions
Table 2.2 presents summary statistics of the three union diversity measures. Impressively, more than half of union covered workers find the union helpful: 62.4% of covered non-members and 84.01% of union non-members report that their workplace unions are helpful to workers. In contrast, only about 16% of the workplace unions are deemed to be democratic.
The major differences between union members and covered non-members are in participation in union-organised activity. While only 16.11% of covered non-members
take part in union-organised activities, 81.85% of union members do so. The differences can be interpreted in two ways. First, it might be that union members are more likely to be found in active unions. Second, it is also possible that union activities are effectively private goods provided to union members, to the extent that union members are better informed.
2.35 Measures of welfare
Earnings and work-related insurances are the most commonly studied outcome variables in Chinese union studies. This study also use earning and work-related insurances to make findings comparable. In addition, a pressing issue facing migrant workers is the high cost
Union Democracy Union Helpfulness Union Activities
0 1 0 1 0 1
Non-Members(covered) 83.44% (1305) 16.56% (259) 37.60% (588) 62.40% (976) 83.89% (1312) 16.11% (252)
Members 77.52%
21
of living in the city relative to their income.22 In particular, housing and meal costs are two major components of living costs. If unionised workplaces provide affordable meals and housing, migrant workers will benefit. Therefore, the chapter also worked out the net value of meal services and housing services provided as a measure of fringe benefits. The detailed construction of the measures are discussed with the results in Section 2.55.
Worker-reported monthly income is employed as the measure for earnings. The choice of monthly income over hourly wage need some explanations. Hourly wages is the ideal
earning measure in union studies because unions also influence monthly working hours. Booth (1995) summarised US and UK union studies and found union-wage differentials are higher in studies using an hourly wage compared to a monthly wage. This is due to the fact that unions also protect workers from long working hours. However, there are several concerns about using hourly wages that are specific to the data used. One of the most important is that monthly working hours observed in the data are subject to a heaping problem.23 To minimise measurement error I therefore do not utilise the hourly wage. But I do control for monthly worked hours in all of the regression analyses.
Regarding the choice of income over wages, two factors determined this choice. Additional reasons to use income instead of wages are as follows. First, there are more missing observations in wages than in income in our data. If we were to use wages instead of income we would lose about 400 observations. Second, a large proportion of observations in our data reported a low wage but a high bonus. Thus, the wage is unlikely to reflect the true earnings for this group of workers. For all these reasons we use monthly income which includes bonuses, rather than hourly wages, as the earnings measure for workers.
22 In 2014, the average monthly wage in Guangzhou was 4750 RMB (NBS), while the average monthly
income for a migrant worker in Guangzhou was 3160 RMB in our data. For workers earning less than the average wage in a particular region, living costs should be a concern.
23 More discussion about the heaping problem in monthly working hours can be found in the discussion of
22 Table2. 3. Summary Statistics for welfare measures
(1) (2) (3) (4) (5)
Variable obs
Non-unionised
Non-members Members Income (CPI-adjusted) 14077 2732.92 2928.04*** 3201.88*** Fringe benefit
Net value of meal service 13596 233.70 262.68*** 272.67 Net value of accommodation
service 13343 128.45 143.99** 154.71
Insurances
Unemployment insurance 13803 0.25 0.64*** 0.73***
Housing fund 13883 0.10 0.29*** 0.48***
Medical insurance 13971 0.31 0.74*** 0.80***
Injury insurance 13795 0.28 0.70*** 0.79***
Age pension 13947 0.32 0.76*** 0.85***
Total number of social
security 13433 1.22 3.15*** 3.67***
Notes:
1. *** p<0.01, ** p<0.05, * p<0.1
2. Stars in column (4) denote the significance of the differences between (3) and (4) 3. Stars in column (5) are for the difference between (4) and (5)
Table 2.3 presents the summary statistics for welfare measures by union status. The first few rows of Table 2.3 shows differences in income and fringe benefits, while the lower part of the table display variations for social security entitlements. We can observe four of the legally required insurances and the housing fund in our data.24 Table 2.3 reports these five types of social security separately, while the last row of the table reports the
total number of social security entitlements provided to an individual. Three interesting
observations can be drawn from the table. The raw differences between non-unionised
workers and unionised workers are large in all welfare measures except for fringe benefits. Moreover, although the differences between union members and covered non-members are significant in both income and the various kinds of insurances, only income differences are remarkable in magnitude. This provides some evidence supporting the discussion in Section 2.23 and 2.24 about the two-levels effects of firm-level unions, which also suggests that union members are more likely to be found in active unions.
Moreover, the number of social security types (see the last row of Table 2.3) seems to be a good summary measure of insurance entitlement; disaggregating across each insurance
23
type, we find that insurance entitlement differences across union status following the same trend as the parsimonious summary measure given in the last row. In the interests of space, we shall therefore focus on this measure when estimating the association between union status and welfare as measured by social security entitlements.
Lastly, the unconditional differences in meal and accommodation benefits also vary across different types of union status. As with other welfare measures, both union members and covered non-members are provided with significantly more valuable meal
and accommodation services than non-unionised workers. Unlike other welfare measures, meal and accommodation benefits are not significantly different for union members and covered non-members.
2.36 Complaint channels
The union literature has often argued that an important role of trade unions is to facilitate the communication of worker dissatisfaction to management. I test whether or not workplace unions in China make workers more likely to express their work related
grievance to authorities using the following question: ‘Who will you be most likely to ask for help in your unit if you are treated unfair?’ In the RUMiC survey there are twelve
possible options that can be chosen by a respondent to answer this question. The answers can be grouped into three broad categories: no complaint, complain through personal channel, and complain through an official channel.25 I find that 23.6% of workers choose no complaint, 33.4% workers complain through personal channels, and 43% of them complain through official channels. The majority of workers who chose to complain through an official channel chose to complain to the workplace management.
25 Respondents, when asked for their responses to unfair treatment in the workplace, were provided with
24 2.37 Individual characteristics
Individual attributes such as age, gender, education level, experiences, and other basic demographics are likely to influence worker’s welfare directly. Therefore, they constitute the vector of individual control variables in the regression analysis. The full variable list of the individual control vector is presented in Table 4.4 below. Most of the variables need little explanation.
Unlike other individual controls, the measure of experiences needs further clarifications. I use tenure in the current occupation and length of time since migration to measure an individual’s experience. Current job experience is also observed in the data. However, workplace unions are expected to protect workers from illegal layoffs. Therefore, current job experience is expected to be one of the channels for firm-level unions to affect workers’ welfare. Consequently, tenure in current job is not included in the
individual-characteristics control vector. I do use it as an additional control when checking the
sensitivity of estimations.
25 Table2. 4. Summary Statistics for individual characteristics
(1) (2) (3) (4) (5) (6)
Variable obs
Non-unionised
Non-members Members
Diff C3-C5
Age 14149 33.04 33.84*** 33.70 -0.66*
Female 14179 0.45 0.35*** 0.31** -0.13***
Years since migration
(years) 12474 9.58 10.81*** 11.29* -2.29***
Occupational
experience (years) 13553 5.40 6.48*** 7.48*** -2.08***
Education:
Primary school 14032 0.14 0.08*** 0.06* 0.08***
Junior high 14032 0.48 0.45*** 0.42* 0.06***
High school 14032 0.18 0.22*** 0.24* -0.06***
Above high school 14032 0.20 0.24*** 0.28* -0.08***
Monthly working hours 13930 226.90 214.22*** 206.81*** 20.09***
Notes:
1. *** p<0.01, ** p<0.05, * p<0.1
2. Stars in column (4) denote the significance of the differences between (3) and (4) 3. Stars in column (5) are for the difference between (4) and (5)
4. Significance in education indicators come from Kolmogorov–Smirnov test for distribution differences 5. The last column reports the differences between column (3) and column (5)
Note that, comparing column (4) and column (5) of Table 2.4, the human capital differences between members and covered non-members are not as large as the differences between non-unionised workers and covered non-members. This might suggest that selection into union membership is less severe compared to selection into unionisation.
26
compared to covered non-members. Consistent with the discussion in Section 2.35, workplace unions do seems to impact the monthly working hours in addition to the work related welfares. I created six dummy variables around values where observations are heaped together. 26These six dummies have been included in the individual control vector. Compared to using the continuous measure of monthly working hours, the group of dummies allowed for non-linear effects of monthly working hours on workers’ welfare.
2.38 Workplace characteristics
The characteristics of the workplace where an individual works also directly determine individual welfare. In RUMiC, workers reported detailed information about the size, ownership type, and industry of their workplaces. For ease of interpretation, I broadly categorise ownership, industry and size of an establishment and report them in Table 3.5. However, in the estimation analysis, detailed dummy variables are used as controls instead of the broad categorised indicators reported here.
Workers with different union status also differ in the kind of establishment they work in.
The difference between unionised workers and non-unionised workers is remarkable in terms of where they work. Non-unionised workers are more likely to be found in small workplaces and the private sector. They are also more likely to be found in the retail and hotel industry. In contrast, a union-covered worker is likely to be working in a large workplace. Unionised worker is also less likely to be working in the private sector but more likely to be working in manufacturing compared to non-unionised workers.
The magnitude of differences between covered non-members and union members are not comparable to the differences between unionised and non-unionised workers. Union members are slightly less likely to be working in a large firm or the manufacturing industry compared to covered non-members.
26 The six dummies indicates the following six categories of monthly working hours: 1. up to 180; 2.
27 Table2. 5. Summary Statistics for firm characteristics
(1) (2) (3) (4) (5) (6)
Variable obs
Non-unionised
Non-members Members
Diff C3-C5 More than 50
employees 14069 0.42 0.86*** 0.79*** -0.37***
Ownership:
Private Sector 13672 0.86 0.47*** 0.49 0.37***
Foreign Sector 13672 0.05 0.24*** 0.16*** -0.11***
State Sector 13672 0.09 0.29*** 0.34*** -0.25***
Industry:
Manufacturing 13972 0.16 0.47*** 0.39*** -0.23***
Construction 13972 0.09 0.04*** 0.03** 0.06***
Retail & Hotel 13972 0.36 0.14*** 0.17** 0.19***
Service 13972 0.28 0.21*** 0.24** 0.04**
Notes:
1. *** p<0.01, ** p<0.05, * p<0.1
2. Stars in column (4) denote the significance of the differences between (3) and (4) 3. Stars in column (5) are for the difference between (4) and (5)
4. The last column reports the differences between column (3) and column (5)
2.39 Additional control variables
The last set of variables includes those that will be used to test the sensitivity of OLS estimation. These variables measure potentially important personal and workplace characteristics. However, they are not included in the set of individual- and workplace- characteristics control vectors because they are likely to be correlated with other control
variables (for instance, school performance is correlated with education). Moreover, some of the additional control variables are not traditionally welfare determinates (for example,
search time for the current job). Lastly, some of the additional controls are possible channels for unions’ impact on welfare (such as written contracts and job tenure). The
28 2.310 Determinants of union status
This subsection portrays the characteristics of workers with different union status by presenting a multinomial regression. The regression model allows the three types of union status- non-unioised, covered non-member, union member- to be determined by various individual characteristics and work characteristics discussed in the last two subsections. In addition, the regression specification also controls for city, year, and longitudinal observations fixed effects. The results are presented in Table 2.6.
Table2. 6. Determination of union status (first part)
(1) (2)
VARIABLES Non-unionised Members
Individual characteristics
Age 0.01* -0.02***
(0.00) (0.01)
Female 0.12* -0.15
(0.06) (0.10)
Marriage -0.27*** 0.29**
(0.08) (0.13)
Good school performance -0.10 0.29***
(0.08) (0.11)
Years since migration -0.01* -0.00
(0.01) (0.01)
Current job experience -0.03*** 0.06***
(0.01) (0.01)
Education:
Junior -0.32*** 0.24
(0.12) (0.20)
High school -0.58*** 0.37*
(0.13) (0.21)
Above high school -0.66*** 0.37*
(0.14) (0.22)
Data structure indicators
2013 -0.42*** 0.18*
(0.08) (0.11)
2014 -0.36*** -0.29**
(0.08) (0.12)
Tracked household -0.03 0.34***
(0.07) (0.10)
Pseudo R-squared 0.24 0.24