An Event Service to Support
Grid Computational
Environments
Geoffrey Fox
1and Shrideep Pallickara
2 1 [email protected], Dept. of Computer Science, Indiana University2 [email protected], Dept. of Electrical Engineering & Computer Science, Syracuse University
SUMMARY
We believe that it is interesting to study the system and software architecture of environments which integrate the evolving ideas of computational grids, distributed objects, web services, peer-to-peer networks and message oriented middleware. Such peer-to-peer (P2P) Grids should seamlessly integrate users to themselves and to resources which are also linked to each other. We can abstract such environments as a distributed system of “clients” which consist either of “users” or “resources” or proxies thereto. These clients must be linked together in a flexible fault tolerant efficient high performance fashion. In this paper, we study the messaging or event system – termed GES or the Grid Event Service – that is appropriate to link the clients (both users and resources of course) together. For our purposes (registering, transporting and discovering information), events are just messages – typically with time stamps. The messaging system GES must scale over a wide variety of devices – from hand held computers at one end to high performance computers and sensors at the other extreme. We have analyzed the requirements of several Grid services that could be built with this model, including computing and education and incorporated constraints of collaboration with a shared event model. We suggest that generalizing the well-known publish-subscribe model is an attractive approach and here we study some of the issues to be addressed if this model is used in the GES.
key words: distributed messaging, publish subscribe, guaranteed delivery, grid systems, peer-to-peer infrastructures and event distribution systems.
1. Introduction
The web in recent years has experienced an explosion in the number of devices users employ to access services. A single user may access a certain service using multiple devices. Most services allow clients to access the service through a broker. The client is then forced to interact with the service via this broker throughout the duration that it is using the service. If the broker fails, the client is denied servicing till such time that the failed broker recovers. In the event that this service is running on a fixed set of brokers the client, since it knows about this set of brokers, could then connect to one of these brokers and continue using the service. Whether the client missed any servicing and whether the service would notify the client of this missed servicing depends on the implementation of the service. In all these implementations the identity of the broker that the client connects to is just as important as the service itself. Clients do not always maintain an online presence, and when they do they may the access the service using a different device with different computing and content-handling capabilities. The communication channels employed during every such service interaction may have different bandwidth constraints and communication latencies. Besides this a client accesses services from different geographic locations.
A truly distributed service would allow a client to use services by connecting to a broker nearest to the client’s geographical location. By having such local broker, a client does not have to re-connect all the way back to the broker that it was last attached to. If the client is not satisfied with the response times that it experiences or if the broker that it has connected to fails, the client could very well choose to connect to some other local broker. Concentration of clients from a specific location accessing a remote broker, leads to very poor bandwidth utilization and affects latencies associated with other services too. It should not be assumed that a failed broker node would recover within a finite amount of time. Stalling operations for certain sections of the network, and denying service to clients while waiting for failed processes to recover could result in prolonged, probably interminable waits. Such a model potentially forces every broker to be up and running throughout the duration that this service is being provided. Models that require brokers to recover within a finite amount of time generally imply that each broker has some state. Recovery for brokers that maintain state involves state reconstruction, usually involving a calculation of state from the neighboring brokers. This model runs into problems when there are multiple neighboring broker failures. Invariably brokers get overloaded, and act as black holes where messages are received but no processing is performed. By ensuring that the individual brokers are stateless (as far as the servicing is concerned), we can allow these brokers to fail and not recover. A failure model that does not require a failed node to recover within a finite amount of time, allows us to purge such slow processes and still provide the service while eliminating a bottleneck.
be able to reconstruct the service nuggets that a client missed during the time that it was inactive. Clients just specify the type of events that they are interested in, and the content that the event should at least contain. Clients do not need to maintain an active presence during the time these interesting events are taking place. Once it registers an interest it should be able to recover the missed event from any of the broker nodes in the system. Removing the restriction of clients reconnecting back to the same broker that it was last attached to and the departure from the time-bound failure recovery model, leads to a situation where brokers could be dynamically instantiated based on the concentration of clients at certain geographic locations. Clients could then be induced to roam to such dynamically created brokers for optimizing bandwidth utilization. The network can thus undulate with the addition and failure/purging of broker node processes.
The system we are considering needs to support communications for 109devices. The users using these devices would be interested in peer-to-peer (P2P) style of communication, business-to-business (B2B) interactions or a be part of a system comprising of agents where discoveries are initiated for services from any of these devices. Finally, some of these devices could also be used as part of a computation. The devices are thus part of a complex distributed system. Communication in the system is through events, which are encapsulated within messages. Events form the basis of our design and are the most fundamental units that entities need to communicate with each other. Events are anything transmitted including updates, objects themselves (file uploads), database updates and audio/video streams. These events encapsulate expressiveness at various levels of abstractions – content, dependencies and routing. Where, when and how these events reveal their expressive power is what constitutes information flow within the system. Clients provide services to other clients using events. These events are routed by the system based on the service advertisements that are contained in the messages published by the client. Events routed to a broker are queued and routing decisions are made based on the service advertisements contained in these events and also based on the state of the network fabric.
model is an attractive approach and here we study some of the issues to be addressed if this model is used in the GES.
1.1. Messaging Oriented Middleware
Messaging systems based on queuing include products such as Microsoft’s MSMQ [28]and IBM’s MQSeries [29]. The queuing model with their store-and-forward mechanisms come into play where the sender of the message expects someone to handle the message while imposing asynchronous communication and guaranteed delivery constraints. A widely used standard in messaging is the Message Passing Interface Standard (MPI) [21]. MPI is designed for high performance on both massively parallel machines and workstation clusters. Messaging systems based on the classical remote procedure calls include CORBA [35], Java RMI [32] and DCOM [19]. In publish/subscribe systems the routing of messages from the publisher to the subscriber is within the purview of the message oriented middleware (MOM), which is responsible for routing the right content from the producer to the right consumers. Industrial strength products in the publish subscribe domain include solutions like TIB/Rendezvous
[17] from TIBCO and SmartSockets [16] from Talarian. Other related efforts in the research community include Gryphon [4, 1], Elvin [45] andSienna [11]. The push by Java to include publish subscribe features into its messaging middleware include efforts like JMS [26] and JINI [2]. One of the goals of JMS is to offer a unified API across publish subscribe implementations. Various JMS implementations include solutions like SonicMQ [15] from Progress, JMQ [31]
from iPlanet, iBus [30] from Softwired and FioranoMQ [14] from Fiorano. Systems tuned
towards large scale P2P systems include Pastry [43] from Microsoft, which provides an
efficient location and routing substrate for wide-area P2P applications. Pastry provides a self-stabilizing infrastructure that adapts to the arrival, departure and failure of nodes. JXTA [33] from Sun Microsystems is another research effort that seeks to provide such large-scale P2P infrastructures.
1.2. Service provided
We have built a “production” system and an advanced research prototype. The production system uses the commercial Java Message Service (SonicMQ) and has been used very successfully to build a synchronous collaboration environment applied to distance education. The publish/subscribe mechanism is powerful but this comes at some performance cost and so it is important that it satisfies the reasonably stringent constraints of synchronous collaboration. We are not advocating replacing all messaging with such a mechanism – this would be quite inappropriate for linking high performance devices such as nodes of a parallel machine linked today by messaging systems like MPI or PVM. Rather we have recommended using a hybrid approach in such cases. Transport of messages concerning the control of such HPCC resources would be the responsibility of the GES but the data transport would be handled by high performance subsystems like MPI. This approach was successfully used by the Gateway computing portal.
has a single server (although by linking multiple JMS invocations you can build a multi-server environment and you can also implement the function of a JMS server on a cluster). We propose that GES be implemented on a network of brokers where we avoid the use of the term servers for two reasons; the publish/subscribe broker service could be implemented on any computer – including a user’s desktop machine. Secondly we have included the many application servers needed in a P2P Grid as clients in our abstraction for they are the publishers and subscribers to many of the events to be serviced by GES. Brokers can run either on separate machines or on clients whether these are associated with users or resources. This network of brokers will need to be dynamic for we need to service the needs of dynamic clients. For example suppose one started a distance education session with six distributed classrooms each with around 20 students; then the natural network of brokers would have one for each classroom (created dynamically to service these clusters of clients) combined with static or dynamic brokers associated with the virtual university and perhaps the particular teacher in charge.
Here we study the architecture and characteristics of the broker network. We are using a particular internal structure for the events (defined in XML but currently implemented as a Java object). We assume a sophisticated matching of publishers and subscribers defined as general topic objects (defined by an XML Schema that we have designed). However these are not the central issues to be discussed here. Our study should be useful whether events are defined and transported in Java/RMI or XML/SOAP or other mechanisms; it does not depend on the details of matching publishers and subscribers. Rather, we are interested in the capabilities needed in any implementation a GES in order to abstract the broker system in a scalable hierarchical fashion (section 2); the delivery mechanism (section 3); the guarantees of reliable delivery whether brokers crash or disappear or whether clients leave or (re)join the system (section 4). Section 4 also discusses persistent archiving of the event streams. We have emphasized the importance of dynamic creation of brokers but this was not implemented in our initial prototype. However by looking at the performance of our system with different static broker topologies we can study the impact of dynamic creation and termination of broker services.
1.3. Status
There exists a prototype implementation of GES. This implementation, developed using Java, uses TCP as the transport protocol for communication within the system and is JMS compliant. Support for XML is currently being added to the system. Future work would include work on support for dynamic topologies and security frameworks for authentication, authorization and dissemination of content. The results from our prototype implementation are presented in this paper.
2. Clients and the Broker Topology
organization of the broker network, and the nomenclature that we would be referring to in the remainder of this paper.
2.1. Destination lists and the generation of unique identifiers
Clients in the system specify an interest in the type of events that they are interested in. Some examples of interests specified by clients could be sports events or events sent to a certain discussion group. It is the system, which computes the clients that should receive a certain event. A particular event may thus be consumed by zero or more clients registered with the system. Events have explicit or implicit information pertaining to the clients which are interested in the event. In the former case we say that the destination list is internal to the event, while in the latter case the destination list isexternal to the event.
An example of an internal destination list is “Mail” where the recipients are clearly stated. Examples of external destination lists include sports scores, stock quotes etc. where there is no way for the issuing client to be aware of the destination lists. External destination lists are a function of the system and the types of events that the clients, of the system, have registered their interest in.
2.2. Client
Events are continuously generated and consumed by clients within the system. Clients have intermittent connection semantics. Clients can be present in the system for a certain duration and be disconnected later on. Clients reconnect at a later time and receive events, which they were supposed to receive in their past incarnations as well as events that they are supposed to receive during their present incarnation. Clients issue/create events while in disconnected mode, these events would be held in a local queue to be released to the system during a reconnect.
Associated with every client is its profile, which keeps track of information pertinent to the client. This includes the application type, events the client is interested in and the broker node the client was attached to in its previous incarnation.
2.3. The Broker Node Topology
traditional clusters, or along with other such broker nodes form a cluster connected together by geographical proximity but not necessarily high speed links.
Several such clusters grouped together as an entity comprises a level-2 unit of our network and is referred to as a super-cluster. Clusters within a super-cluster have one or more links with at least one of the other clusters within that super-cluster. When we refer to the links between two clusters, we are referring to the links connecting the nodes in those individual clusters. In general there would be multiple links connecting a single cluster to several other clusters. This approach provides us with a greater degree of fault-tolerance, by providing us with multipleroutes to reach nodes within other clusters.
This topology could be extended in a similar fashion to comprise of super-super-clusters
(level-3 units), super-super-super-clusters (level-4 units) and so on. A client thus connects to a broker node, which is part of a cluster, which in turn is part of a super-cluster and so on and so forth. We limit the number of super-clusters within a super-super-cluster, the number of clusters within a super cluster and the number of nodes within a cluster. This limit, the
block-limit, is set at 64. In an N-level system this scheme allows for 26N ×26N−1× · · ·260 i.e 26∗(N+1) broker nodes to be present in the system.
We now delve into thesmall world graphsintroduced in [46] and employed for the analysis of real world peer-to-peer systems in [36, pages 207 – 241]. In a graph comprising several nodes,
pathlength signifies the average number of hops that need to be taken to reach from one node to the other.Clustering coefficient is the ratio of the number of connections that exist between neighbors of node to the number of connections that are actually possible between these nodes. In aregular graphconsisting ofnnodes, each of which is connected to its nearestkneighbors; for cases wherenk1, the pathlength is approximatelyn/2k. As the number of vertices increases to a large value the clustering coefficient in this case approaches a constant value of 0.75.
At the other end of the spectrum of graphs is the random graph, which is the opposite of a regular graph. In the random graph case the pathlength is approximately logn/logk, with a clustering coefficient of k/n. The authors in [46] explore graphs where the clustering coefficient is high, and with long connections (inter-cluster links in our case). These graphs have pathlengths approaching that of the random graph, though the clustering coefficient looks essentially like a regular graph. The authors refer to such graphs assmall world graphs. This result is consistent with our conjecture that for our broker node network, the pathlengths will be logarithmic too. Thus in the topology that we have the cluster controllers provide control to local classrooms etc, while the links provide us withlogarithmic pathlengths and the multiple links, connecting clusters and the nodes within the clusters, provide us with robustness.
2.3.1. GES Contexts
Every unit within the system, has a unique GES context associated with it. In an N-level system, a broker exists within the GES context Ci1 of a cluster, which in turn exists within the GES contextCj2of a super-cluster and so on. In general a GES contextCiat levelexists within the GES context Cj+1 of a level (+ 1) unit. In an N-level system, a unit at level
course, the units at any levelwithin a GES context Ci+1 should be able to reach any other unit within that same level. If this condition is not satisfied we have anetwork partition.
2.3.2. Gatekeepers
Within the GES contextCi2of a super-cluster, clusters have broker nodes at least one of which is connected to at least one of the nodes existing within some other cluster. Some of the nodes in the cluster thus maintain connections to the nodes in other clusters. Similarly, some nodes in a cluster could be connected to nodes in some other super-cluster. We refer to such nodes as gatekeepers.
Depending on the highest level at which there is a difference in the GES contexts of these nodes, the nodes that maintain this active connection are referred to as gatekeepers at the corresponding level. Nodes, which are part of a given cluster, have GES contexts that differ at level-0. Every node in a cluster is connected to at least one other node within that cluster. Thus, every node in a cluster is a gatekeeper at level-0.
Let us consider a connection, which exists between nodes in a different cluster, but within the same super-cluster. In this case the nodes that maintain this connection have different GES cluster contexts i.e. their contexts at level-1 are different. These nodes are thus referred to as gatekeepers at level-1. Similarly, we would have connections existing between different super-clusters within a super-super-cluster GES contextCi3. In anN-level system gatekeepers would exist at every level within a higher GES context. The link connecting two gatekeepers is referred to as thegateway, which the gatekeepers provide, to the unit that the other gatekeeper is a part of.
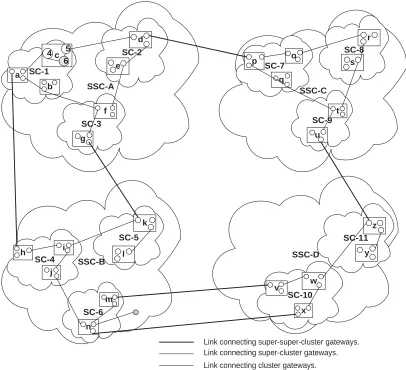
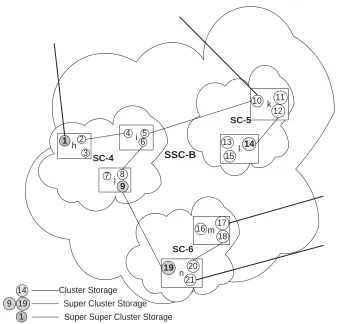
Figure 1 shows a system comprising of 78 nodes organized into a system of 4 super-super-clusters, 11 super-clusters and 26 clusters. In general, if a node connects to another node, and the nodes are such that they share the same GES context Ci+1 but have differing GES contexts, say Cj and Ck; the nodes are designated as gatekeepers at level− i.e. g(C+1). Thus, in figure 1 we have 12 super-super-cluster gatekeepers, 18 super-cluster gatekeepers (6
each in SSC-A and SSC-C, 4 in SSC-B and 2 in SSC-D) and 4 cluster-gatekeepers in
super-clusterSC-1.
3. The problem of event delivery
SSC-A SC-1
SC-2
SC-3 e
g c
4 5
6
b
f
d
a
SSC-B SC-4
SC-5
SC-6 l
n i
j
m
k
h
SSC-C SC-7
SC-8
SC-9 s
u o
q
t r
p
SSC-D
SC-11
y z
SC-10 w
x v
[image:9.612.94.500.161.531.2]Link connecting super-super-cluster gateways. Link connecting super-cluster gateways. Link connecting cluster gateways.
scheme increases the latency associated with the reception of real time events at the client due to the cumulation of queuing delays associated with theuninteresting/flooded events. The system thus needs to be very selective of the kinds of events that it routes to a client.
Prior Art
Different systems address the problem of event delivery to relevant clients in different ways. In
Elvin [23] each subscription is converted into a deterministic finite state automaton which can lead to an explosion in the number of states. Network traffic reduction [45] is accomplished through the use ofquenchexpressions that prevent clients from sending notifications for which there are no consumers. InSienna [11, 12] optimization strategies include assembling patterns of notifications as close as possible to the publishers, while multicasting notifications as close as possible to the subscribers. InGryphon [4] each broker maintains a list of all subscriptions within the system in a parallel search tree (PST). The PST is annotated with a trit vector encoding link routing information. These annotations are then used at matching time by a broker to determine which of its neighbors should receive that event. A related Gryphon effort for exploiting universally available multicast techniques for event delivery can be found in [3]. The approach adopted by the OMG is one of establishing channels and registering suppliers and consumers to those event channels. The channel approach in the event service [34] approach could entail clients (consumers) to be aware of a large number of event channels. The two serious limitations of event channels are the lack of event filtering capability and the inability to configure support for different qualities of service. InTAO[27], a real-time event service that extends the CORBA event service is available. This provides for rate-based event processing, and efficient filtering and correlation. However even in this case the drawback is the number of channels that a client needs to keep track of.
In some commercial JMS implementations, events that conform to a certain topic are routed to the interested clients. Refinement in subtopics is made at the receiving client. For a topic with several subtopics, a client interested in a specific subtopic could continuously discard uninteresting events addressed to a different subtopic. This approach could thus expend network cycles for routing events to clients where it would ultimately be discarded. Under conditions where the number of subtopics is far greater than the number of topics, the situation of client discards could approach the flooding case.
is relatively low. This need for caching and the propagation of content updates constricts the amount of data that can be cached besides requiring cached data to be constantly updated. This approach is not suited for data that is transient with a real-time context associated with it. Furthermore in most services the interaction model tends to be far more complex than the traditional client server model that the EdgeSuite model best services.
GES Solution Highlights
Our solution to the problem of event delivery handles the dissemination problem in a near optimal fashion. An event is routed only to those units that have at least one client that is interested in the event. Furthermore, the links employed during the routing ensures the fastest dissemination since each broker makes routing decisions, which ensure that the path from that broker to the intended recipients is the fastest (usually the shortest path). The routing decisions are made based on the current state of the network. A broker or islands of brokers could fail and the routes computed would avoid these failed sections of the broker network while routing to recipients. Solutions to the delivery problem, involve a matching step being performed at every broker. In our solution for a broker network, organized as an N-level system, the matching step is not performed at every broker as the event is being relayed through the broker network to its intended recipients. In fact this matching step is performed at most (N+1) times prior to delivery at a given recipient. The solution to the event delivery problem handles dense and sparse interests in events equally well. The solution for delivery of events to clients experiencing service interruptions due to single/multiple broker failures is discussed in the next section.
3.1. The gateway propagation protocol - GPP
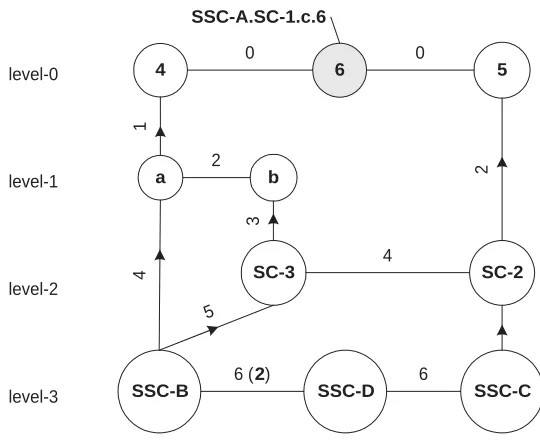
The gateway propagation protocol (GPP) accounts for the process of adding gateways and is responsible for the dissemination of connection information within relevant parts of the sub system to facilitate creation of abbreviated system interconnection graphs. However, GPP should also account for failure suspicions/confirmations of nodes and links, and provide information for alternative routing schemes. The organization of gateways reflects the connectivities, which exist between various units within the system. Using this information, a node should be able to communicate with any other node within the system. This constitutes the connectivity graph of the system. At each node the connectivity graph is different while providing a consistent overall view of the system. The view that is provided by the connectivity graph at a node should be of those connectivities that are relevant to the node in question. Figure 1 depicts the connections that exist between the various units of the system that we would be using as an example in further discussions.
3.1.1. The connection
A connection depicts the interconnection between units of the system, and defines an edge in the connectivity graph. Interconnections between the units snapshot the kind of gatekeepers that exist within that unit. A connection exists between two gatekeepers. If a level-connection is established, the connection information is disseminated only within the higher level GES context Ci+1 of the sub-system that the gatekeepers are a part of. Thus, connections established between broker nodes in a cluster arenot disseminated outside that cluster.
When the connection information is being disseminated throughout the GES contextCi+1, it arrives at gatekeepers at various levels. Depending on the kind of link this information is being sent over, the information contained in theconnection is modified. Details regarding the information encapsulated in a connection, the update of this information during disseminations and the enforcement of dissemination constraints can be found in [40, 38, 39]. Thus, in figure
1 the connection between SC-2 andSC-1 in SSC-A, is disseminated as one between node
5and SC-2. When this information is received at 4, it is sent over as a connection between the cluster c and SC-2. When the connection between cluster c and SC-2 is sent over the cluster gateway to cluster b, the information is not updated. As was previously mentioned, the super cluster connection(SC-1,SC-2)information is disseminated only within the super-super-clusterSSC-Aand is not sent over the super-super-cluster gateway available within the cluster ainSC-1 and clusterginSC-3.
Every edge created due to the dissemination of connection information also has a link count associated with it, which is incremented by one every time a new connection is established between two units that were already connected. This scheme also plays an important role in determining if a connection loss would lead to partitions. Further, associated with every edge is the cost of traversal. In general the cost associated with traversing a level-link from a unit
uxincreases with increasing values of both xand.
This cost scheme is encapsulated in the link cost matrix, which can be dynamically updated to reflect changes in link behavior. Thus, if a certain link is overloaded, we could increase the cost associated with traversal along that link. This check for updating the link cost could be done every few seconds.
3.1.2. Organizing the nodes
6
SC-2
SSC-B
b a
5 4
SSC-C SSC-D
SC-3
6 (2)
4
6
5
4
3
2
1
0 0
2
level-0
level-1
level-2
level-3
[image:13.612.167.437.110.331.2]SSC-A.SC-1.c.6
Figure 2. The connectivity graph at node 6.
3.1.3. Building and updating the routing cache
The best hop to take to reach a certain unit is the last node that was reached prior to reaching the vertex, when traversing the shortest path from the corresponding unit graph node to the vertex. This information is collected within therouting cache, so that events can be disseminated faster throughout the system. The routing cache should be used in tandem with the routing information contained within a routed event to decide on the next best hop to take to ensure efficient dissemination. Certain portions of the cache can be invalidated in response to the addition or failures of certain edges in the connectivity graph.
3.2. Organization of Profiles and the calculation of destinations
Every event conforms to a signature which comprises of an ordered set of attributes {a1, a2,· · · , an}. The values these attributes can take are dictated and constrained by the
3.2.1. Constructing a profile graph
Events encapsulate content identifiers in an ordered set of < attribute, value > tuples. The constraints specified in the profiles should maintain this order contained within the event’s content identifier. Thus to specify a constraint on the second attribute (a2) a constraint should have been specified on the first attribute (a1). What we mean by constraints, is the specification of the value that a particular attribute can take. We however also allow for the weakest constraint, denoted ∗, on any of the attributes. The ∗ signifies that the filtered events can take any of the valid values within the range permitted by the attribute’s type. By successively specifying constraints on the event’s attributes, a client narrows the content type that it is interested in.
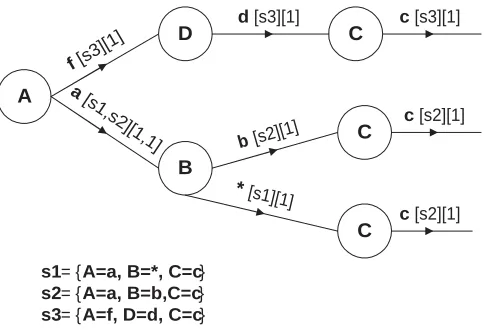
We use the general matching algorithm, presented in [1], of the Gryphon system to organize profiles and match the events. Constraints from multiple profiles are organized in the profile graph. Every attribute on which a constraint is specified constitutes a node in the profile graph. When a constraint is specified on an attributeai, the attributesa1, a2,· · · , ai−1appear in the profile graph. A profile comprises of constraints on successive attributes in an event’s signature. The nodes in the profile graph are linked in the order that the constraints have been specified. Any two successive constraints in a profile result in an edge connecting the nodes in the profile graph. Depending on the kinds of profiles that have been specified by clients, there could be multiple edges,originating from a node.
Figure 3 depicts the profile graph constructed from three different profiles. The example depicts how some of the profiles share partial constraints between them, some of which result in profiles sharing edges in the profile graph. Along every edge we maintain information regarding the units that are interested in its traversal. For each of these units we also maintain the number of predicates δω within that unit that are interested in the traversal of that edge. Figure 3 provides a simple example of the information maintained along the edges.
When an event comes in we first check to see if the profile graph contains the first attribute contained in the event. If that is the case we can proceed with the matching process. When an event is being matched, the traversal is allowed to proceed only if –
(a) There exists a wildcard (∗) edge connecting the two successive attributes in the event. (b) The event satisfies the constraint on the first attribute in the edge, and the attribute
node that this edge leads into is based on the next attribute contained in the event.
As an event traverses the profile graph, for each destination edge that is encountered if the event satisfies the destination edge constraint, that destination is added to the destination list associated with the event.
3.2.2. The profile propagation protocol - Propagation of ±δω changes
A
B
D C
C
C a
[s1,s2][1,1] f [s3][1]
d [s3][1] c [s3][1]
b [s2][1]
c [s2][1]
* [s1][1]
c [s2][1]
[image:15.612.177.419.113.278.2]s1= {A=a, B=*, C=c} s2= {A=a, B=b,C=c} s3= {A=f, D=d, C=c}
Figure 3. The complete profile graph with information along edges.
it is a part of. Profile changes thus need to be propagated to relevant nodes, and should be done such that when an event arrives at a unit gatekeeper –
(a) The events that are routed to sub-units, are those with content such that at least one destination exists within those sub-units.
(b) There are no events, which were not routed to a sub-unit, with content such that there would have been a valid destination within that sub-unit.
Properties (a) and (b) ensure that the events routed to a unit, are those that have at least one client interested in the content contained in the event.
For profile changes within sub-units that result in a profile change of the unit, the changes need to be propagated to relevant nodes, that maintain profiles for different levels. A cluster gateway snapshots the profile of all clients attached to any of the broker nodes that are a part of that cluster. The change in profile of the broker node should in turn be propagated to the cluster gateway(s) within the cluster that the node is a part of. A profile change in broker (as a result of a change in an attached client’s profile) needs to be propagated to the unit (cluster, super-cluster, etc) gatekeeper within the unit that the broker is a part of.
in ensuring that the reference count scheme does not fail due to delivery of the same profile change multiple times within the same unit.
3.3. The event routing protocol - ERP
Event routing is the process of disseminating events to relevant clients. This includes matching the content, computing the destinations and routing the content along to its relevant destinations by determining the next broker node that the event must be relayed to. Events have routing information associated with them, which indicate its dissemination within various parts of the broker network. The dissemination information at each level can be accessed to verify disseminations in various sections of the broker network. Routing decisions and the brokers that an event must be relayed to are made on the basis of this information. This routing information is not added by the client issuing this event but by the system to ensure fastest possible dissemination and recovery from failures. When an event is first issued by the client the broker node that the client is attached to adds the routing information to the event. As the event flows through the system, via gateways, the routing information is modified to snapshot its dissemination within the system.
A cluster gatekeeper, when it receives an event, computes the broker destinations associated with that event. This calculation is based on the profiles available at the gatekeeper as outlined in the profile propagation protocol. At every node the best hops to reach the destinations are computed. Thus, at every node the best decision is taken. Nodes and links that have not been failure suspected are the only entities that can be part of the shortest path. The event routing protocol, along with the profile propagation protocol and the gateway information ensure the optimal routing scheme for the dissemination of events in the existing topology.
4. The Reliable Delivery Of Events
Reliable delivery involves the guaranteed delivery of events to intended recipients. The delivery guarantees need to be satisfied even in the presence of single or multiple broker failures, link failures and any associated network partitions as a result of these failures. In GES clients need not maintain an active online presence and can also roam the network attaching themselves to any of the nodes in the broker network. Events missed by clients in the interim need to be delivered to these clients irrespective of the failures that have already taken place or are currently present in the system.
Prior Art
[24]. Recipients that are slow or temporarily disconnected may be treated as if they had left the group. This model, adopted in Isis [6], works well for problems such as propagating updates to replicated sites. This approach does not work well in situations where the client connectivity is intermittent, and where the clients can roam around the network. Systems such as Horus [41] and Transis [18] manageminority partitions, and can handle concurrent views in different partitions. The overheads to guarantee consistency are however too strong for our case. DACE [10] introduces a failure model, for the strongly decoupled nature of pub/sub systems. This model tolerates crash failures and partitioning, while not relying on consistent views being shared by the members. This is achieved through a self-stabilizing exchange of views through the Topic Membership protocol. In [5], the effect of link failures on the solvability of problems (which are solved with reliable links) in asynchronous systems, has been rigorously studied. [44] describes approaches to building fault-tolerant services using the state machine approach. Systems such asSienna [12, 11] andElvin [23, 45] focus on efficiently disseminating events, and do not sufficiently address the reliable delivery problem in the presence of failures. In
Gryphon the approach to dealing with broker failures is one of reconstructing the broker state from its neighboring brokers. This approach requires a failed broker to recover within a finite amount of time, and recover its state from the brokers that it maintained active connections to prior to its failure. SmartSockets [16] provides high availability/reliability through the use of software redundancies. Mirror processes receiving the same data and performing the same sequence of actions as the primary process, allows for the mirror process to take over in the case of process failures. The mirror process approach runs into scaling problems as the number of processes increase, since each process needs to have a mirror process. Since there is an entire server network that would be mirrored in this approach the network cycles expended for dissemination also increases as the number of server nodes increases. The system state when both the process and its mirror counterpart fail is not addressed. TIB/Rendezvous [17] integrates fault tolerance through delegation to another software TIB/Hawk which provides it with immediate recovery from unexpected failures or application outages. This is achieved through the distributed TIB/Hawk micro-agents, which support autonomous network behavior, while continuing to perform local tasks even in the event of network failures.
Message queuing products such as IBM’s MQSeries [29] and Microsoft’s MSMQ [28] are statically pre-configured to forward messages from one queue to another. This leads to the situation where they generally do not handle changes to the network (node/link failures) very well. They also require these queues to recover within a finite amount of time to resume operations. To achieve guaranteed delivery, JMS provides two modes: persistent for sender and durable for subscriber. When messages are marked persistent, it is the responsibility of the JMS provider [15, 31, 30, 14] to utilize a store-and-forward mechanism to fulfill its contract with the sender (producer).
GES Solution Highlights
for a broker to fail and remain failed forever. The reliable delivery scheme also incorporates a replication scheme that provides for different replication strategies to exist at different parts of the system. The scheme also allows for this replication strategy to change at different parts of the system as time progresses. Changes to the replication scheme at a certain section of the broker network results in updates at the corresponding affected subsystems within the broker network. Roaming, disconnected and connected clients are not affected by these changes in replication schemes within the broker network. Clients reconnecting after a failure or prolonged disconnect make a complete recovery of the events that were published in the interim. The recovery is precise and only those events that were missed by a reconnecting client are routed through the system en route to the recovering client as recovery events. The persistence model in most systems involves the persistent store subscribing to all events that are published in the system. This could lead to exponential rise in storage requirements at different stable storages in the system. With increasing selectivity in the type of events a client is interested in and also in the number of clients that are present in the system, the events stored at storages servicing subsystems would far exceed the number of events that clients in those subsystems are actually interested in. In the GES replication scheme a stable storage servicing a subsystem subscribes to only those events that the brokers (and in turn the clients) it services are interested in. We also have a garbage collection scheme, which ensures that the storage space does not increase exponentially with time. The epochs and reference counting scheme ensures that no client is starved of the events that it was supposed to receive while ensuring that the event is garbage collected once all clients interested in receiving those events have received that event.
In our failure model a unit can fail and remain failed forever. The broker nodes involved in disseminations compute paths based on the active nodes and traversal times within the system. The routing scheme is thus based on the state of the network at any given time. Brokers could be dynamically created, connections established or removed, and the events would still be routed to the relevant clients. Any given node in the system would thus see the broker network undulate, as the brokers are being added and removed. Connections could also be instantiated dynamically based on the average pathlength for communication with any other node within the system. The connectivity graph maintains abbreviated system views; each node in this graph could also maintain information regarding the average pathlengths for communication with any other node within the unit, which the graph node represents. Connections could be dynamically instantiated to vary clustering coefficients and also to reduce average pathlengths for communications. The routing algorithms and the failure model allow support for such dynamic reconfiguration of networks.
In section 4.1 we discuss the replication scheme for our system, and issues pertaining to event stability. Section 4.2 describes the need for epochs, the assigning of epochs and the storage scheme for events. Section 4.2.3 describes the guaranteed delivery of events to all units within the subsystem. Finally in section 4.2.5 we describe the recovery scheme for roaming clients or clients connecting back after a prolonged disconnect.
4.1. Stable Storage Issues
Nodes Granularityr Servicing Storage
10,11,12 r3 1
1,2,3,4,5,6,7,8,9 r2 9
16,17,18,19,20,21 r2 19
[image:19.612.182.418.107.163.2]13,14,15 r1 14
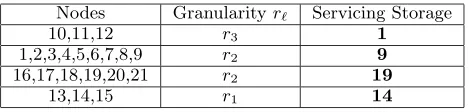
Table I. Replication granularity at different nodes within a sub system
given event. Events can be forwarded to clients only after they have been written to stable storage. The greater the number of stable storage hops en route to delivery to a client, the greater the latency in delivering the event to that client.
4.1.1. Replication Granularity
In our storage scheme, data can be replicated a few times, the exact number being proportional to the number of units within a super unit and also on the replication granularity that exists within a specific unit. If there is a stable storage set up for servicing all the broker nodes within a level- unit, then we denote the replication granularity for nodes within that part of the sub system as r. Stable storages exist within the context of a certain unit, with the possibility of multiple stable storages at different levels within the same unit. We do not impose a homogeneous replication granularity throughout the system. Instead, we impose a constraint on the minimum replication scheme for the system. In anN-level system, comprising of level-N units, we require that every node have a replication granularity of at least rN. Thus, in a system comprising of super-super-clusters we require that every broker node within every super-super-cluster have a replication granularity of at least r3. This is, of course, the coarsest grained replication scheme. There could be units present within the system that have a replication strategy, which is more fine grained. The other constraint, which we impose is that within a level-unitui there can be only one stable storage at level.
Figure 4 depicts the different replication granularities that can exist within different parts of a sub system. As can be seen super-super-clusterSSC-Bhas a replication granularityr3, while super-clusterSC-4withinSSC-Bhas a replication granularityr2. Clusterlhas a replication granularity of r1. Also, in the depicted replication scheme there could be no other node in SSC-B that serves as a stable storage to provide the nodes in SSC-B with a replication granularity ofr3. Similarly, there could be no other stable storages, which try to service units SC-4andSC-6 with a replication granularity ofr2. Table I lists the replication granularities available at different nodes within the sub system depicted in figure 4.
4.1.2. Stability
SSC-B SC-4
SC-5
SC-6
l
13 14
15
n 20 21 i
4 5
6
j
7 8
9
m
16 17
18
k
10 11
12
h
1 2 3
1 19 14 9
Cluster Storage Super Cluster Storage
Super Super Cluster Storage
[image:20.612.129.466.103.427.2]19
Figure 4. The replication scheme
If finer grained stable storages are present within the subsystem with r, the receipt notification is slightly different. As soon as the event is stored to the finer grained stable storage, this stable storage sends a notification to the coarser grained storage indicating the receipt of the event and also the predicate count that can be decremented for the sub-unit that this storage is servicing. Thus, in figure 4, when an event stored at node 1is received at node 19, we can assume that all nodes in unitSC-6 can be serviced and decrement the reference counts at the level-3 stable storage at node1accordingly.
4.2. Epochs
Epochs are used to aid the reconnected clients and also to recover from failures. We use epochs to ensure that the recovery queues constructed for clients would not comprise of events that a client was not originally interested in. Failure to ensure this could lead to starvation of some of the clients. We also need epochs to provide us with a precise indication of the time from which point on a client should receive events. Not having this precise indication (during recoveries) leads to client starvations and also would also cause the system to expend precious network cycles in routing these events. We also have an epoch associated with every profile change and require that the client wait till it receives the epoch notification, before it can disconnect from the system.
4.2.1. Epoch generation
Epochs, denotedξ, are truly determined by the replication granularities that exist in different parts of the system. Some of the details pertaining to epoch generation are listed below –
(a) Epochs should monotonically increase.
(b) Epochs for clients exist within the context of the finest grained stable storage that the broker node (that it is attached to) is a part of. Thus, if the broker node has a replication granularity ofr2, valid epochs for events received by the client, would be those that have been assigned by the corresponding level-2 storage.
(c) For every client with a profileω there is an epochξω associated with it.
Events are routed to a client based on the δω that exist within a profileω. However, every event received at a client needs to have an epoch associated with it to aid in the recovery from failures and also to service events that have not been received by the client. The arrival of such an event results in an update of the corresponding epoch associated with the client’s profile. The replication granularity within the system could be different in different sub systems. Within a subsystem having a replication granularityr, it is possible that there are subsystems with replication granularity r−1, r−2,· · ·, r0. In such cases the epochs assigning process is delegated to the corresponding replicators.
4.2.2. The storage format
associated with the event. For each destination we also store the predicate count associated
with that destination. We also maintain information pertaining to the type of the
event and the length of the serialized representation of the event. Finally we maintain the serialized representation of the event. Thus, the storage format is the tuple – < ξe,(de0, de1,· · ·, den),(pe0, pe1,· · ·, pen), e.type, e.length, e.serialize >.
4.2.3. System storage and guaranteed delivery of events
For a level-N system, the stable storages servicing the individual level-N units are also designated as system storages. For events issued by clients attached to nodes within these
uN units, these system storage nodes have the additional responsibility that they maintain events in stable storage till such time that they are sure that all the other uN units within the system have received that event. When an event is issued within a super unit uNi , the destinations are computed as described in the event routing protocol. However, before the event is allowed to leave unituNi , it must be stored onto the stable storage that provides nodes in uNi with the minimum replication granularity ofrN.
The system storage node maintains the list of all knownuN destinations within the system. This destination list is associated with every event that is stored by the system storage. Associated with these events is asequence number, which is different from the epoch number associated with the events that clients receive. Furthermore, sequence numbers associated with events are used only by the system storages to conjecture the events that they should have received from any other system storage within the system. These sequence numbers are not
used by the clients or the broker nodes within the system to detect missing events. Once the event is stored to such a system storage, it is ready to be sent across to the other uN
destinations within the system. Also, for an event that is issued by a client within uNi , the event is stored to stable storage (to ensure routing to otheruN units within the system) within
uNi and not at any other system storages at the otheruN units within the system. When the events are being sent across gatewaygN for dissemination to other uN units, every event has a sequence number associated with it and also the unit uNi in which this event was issued. This is useful since therN replicators (which serve as system storages) in other units can know which unit to send the acknowledgements (either positive or negative) to.
4.2.4. Stable storage failures
When a stable storage node fails, the events that it stored would not be available to the system. A new client trying to retrieve its events is prevented from doing so. The stable storage also misses any garbage collect notifications that were intended for it. We require this stable storage to recover within a finite amount of time.
4.2.5. Routing events to a reconnected client
When a client is not present in the system, the event is not acknowledged and thus can not be garbage collected by the replicator that this client was being serviced by. The events are thus available for the construction of recovery queues when the client connects back into the system. The recovering client in question could be both a roaming client or a client which has reconnected after a prolonged disconnect. Associated with every client is the epoch number associated with the last event that it received or the last profile change initiated by the client. The routing for the client is based on the node that the client was last attached to. It is this node that serves as a proxy for the client. If this node fails it is the cluster gateway, of the cluster that the node belonged to, which serves as a proxy for the client. As mentioned earlier, in our system a node/unit can fail and remain failed forever.
Stable storages at higher levels are aware of the finer grained replication schemes that exist within its unit. If a coarser grained stable storage is servicing the broker the client was last attached to, the system would use the higher level stable storage to retrieve the client’s interim events. Otherwise the system would delegate this retrieval process to the finer grained stable storage, which now services the client’s lower level GES context.
For a profile ω associated with a client, when a disconnected client joins the system it presents the node the it connects to in its present incarnation the following –
(a) The logical address of the broker node that this client was attached to in its previous incarnation.
(b) The last epochξreceived from the replicator within the replication granularityr of the sub system that it was formerly attached to.
(c) A list of the profile ID’s associated with client’s profileω.
Item (a) provides us with the stable storage that has stored events for the client. Item (b) provides us with the precise instant of time from which point on, event queues of events needs to be constructed and routed to the client’s new location. Item (c) provides for the precise recovery of the disconnected client . Details regarding the precise recovery mechanism can be found in [40, 39].
5. Results
5.1. Experimental Setup
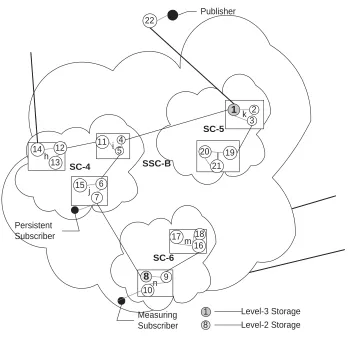
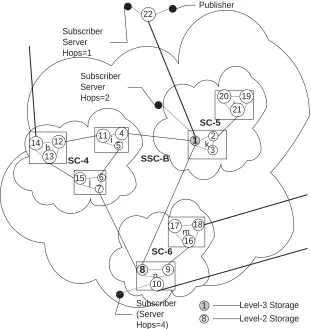
The system comprises of 22 broker node processes organized into the topology shown in the Figure 5. This set up is used so that the effects of queuing delays at higher publish rates, event sizes and matching rates are magnified.
Each broker node process is hosted on 1 physical Sun SPARC Ultra-5 machine (128 MB RAM, 333 MHz), with no SPARC Ultra-5 machine hosting two or more broker node processes. For the purpose of gathering performance numbers we have one publisher in the system and one measuring subscriber (the client where we do our measurements). The publisher and the
measuring subscriber reside on the same SPARC Ultra-5 machine and are attached to nodes 22 and 10 respectively in the topology outlined in figure 5. In addition to this there are 100 subscribing client processes, with 5 client processes attached to every other broker node (nodes22and10do not have any other clients besides the publisher and measuring subscriber respectively) within the system. The 100 client node processes all reside on a SPARC Ultra-60 (512 MB RAM, 3Ultra-60 MHz) machine. The publisher is responsible for issuing events, while the subscribers are responsible for registering their interest in receiving events. The run-time environment for all the broker node and client processes is Solaris JVM (JDK 1.2.1, native threads, JIT).
5.2. Factors to be measured
Once the publisher starts issuing events the factor that we are most interested in is thelatency
in the reception of events. This latency corresponds to the response times experienced at each of the clients. We measure the latencies at the client under varying conditions ofpublish rates, event sizes and matching rates. Publish rate corresponds to the rate at which events are being issued by the publisher. Event size corresponds to the size of the individual events being published by the publisher. Matching rate is the percentage of events that are actually supposed to be receieved at a client. In most publish subscribe systems, at any given time for a certain number of events being present in the system, any given client is generally interested in a very small subset of these events. Varying the matching rates allows us to simulate such a scenario, and perform measurements under conditions of varying selectivity. For a sample of events received at a client we calculate themean latency for the sample of received events and the variance in the sample of these events. Another very important factor that needs to be measured is the change in latencies as the connectivity between the nodes in a broker network is increased. This increase in connectivity has the effect of reducing the number of broker hops that an event has to take prior to being received at a client. The effects of change in latencies with decreasing broker hops is discussed in section 5.3.3.
5.2.1. Measuring the factors
SSC-B SC-4
SC-5
SC-6
l
20 19
21
n 9 10 i
11 4
5
j
15 6
7
m
17 18
16
k
1 2 3
h
14 12
13
8
22
Publisher
Measuring
Subscriber 8
1 Level-3 Storage
Level-2 Storage Persistent
[image:25.612.124.477.118.456.2]Subscriber
Figure 5. Testing Topology - (I)
event for which destinations are being computed there is some amount of processing being done. Clients attached to different broker nodes specify an interest in the type of events that they are interested in. This matching rate is controlled by the publisher, which publishes events with different footprints. Since we are aware of the footprints for the events published by the publisher, we can accordingly specify profiles, which will allow us to control the dissemination within the system. When we vary the matching rate we are varying the percentage of events published by the publisher that are actually being received by clients within the system.
these cases we measure the latencies in the reception of events. To compute latencies we have the publishing client and the measuring subscriber residing on the same machine. Events issued by the publisher aretimestamped and when they are received at the subscribing client the difference between the present time and the timestamp contained in the received event constitutes the latency in the dissemination of the event at the subscriber via the broker network. Having the publisher and one of the subscribers on the same physical machine with access to the same underlying clock, obviates the need for clock synchronization and also accounts for clock drifts.
5.3. Discussion of Results
In this section we discuss the latencies gathered for varying values of publish rates, event sizes and matching rates. We then proceed to include a small discussion on system throughputs at the clients. We also discuss the trends in the variance of the latencies, associated with the sample of events received at a client. The results also discuss the latencies involved in the delivery of events to persistent clients in units with different replication schemes. The delays are in the range of 1-2 mSec for every broker hop. Implementing certain sections of the networking code in C/C++ and then employing JNI to provide access to these native routines could improve upon this delay significantly. The only disadvantage that would result is that we would need to compile programs separately for different platforms. However the brokers written in Java and Java/JNI could still continue to inter-operate with each other. Thus users can decide which parts of the broker network would run the JNI-optimized implementation and which would not.
5.3.1. Latencies for the routing of events to clients
At high publish rates and increasing event sizes, the effects of queuing delays come into the picture. This queuing delay is a result of the events being added to the queue faster than they can be processed. In general, the mean latency associated with the delivery of events to a client is directly proportional to the size of the events and the rate at which these events were published. The latencies are the lowest for smaller events issued at low publish rates. The mean latency is further influenced by the matching rates for events issued by the publisher. The results clearly demonstrate the effects of flooding/queuing that take place at high publish rates and high event sizes and high matching rates at a client. It is clear that as the matching rate reduces the latencies involved also reduce, this effect is more pronounced for cases involving events of a larger size at higher publish rates.
Latencies under different matching rates:22 Servers 102 Clients
Match Rate=100% Match Rate=50% Match Rate=10%
0
100 200
300 400
500 600
700 800
900 1000 Publish Rate
(Events/sec) 0
50100 150200
250300 350400
450500
Event Size (Bytes) 0
[image:27.612.119.475.173.371.2]50 100 150 200 250 300 350 400 450 Latencies (MilliSeconds)
Figure 6. Latencies for match rates of 100%, 50% and 10%
for latencies at different matching rates, system throughput measurements and changes in variance in the latency samples can be found in [40, 37, 39].
5.3.2. Persistent Clients
In figure 5 we have also outlined the replication scheme that exists in the system. When an event arrives at node 1, the event is first stored to the level-3 stable store so that it has an epoch associated with it. The event is then forwarded for dissemination within the unit. Clients attached to any of the nodes in super-clusterSC-6have a replication granularity ofr2. When the events issued by the publisher in the test topology of figure 5 are being disseminated, when clients attached to nodes in SC-6 receive the event, that event would have been replicated twice (once at node1and once at node8). For testing purposes we set up anothermeasuring
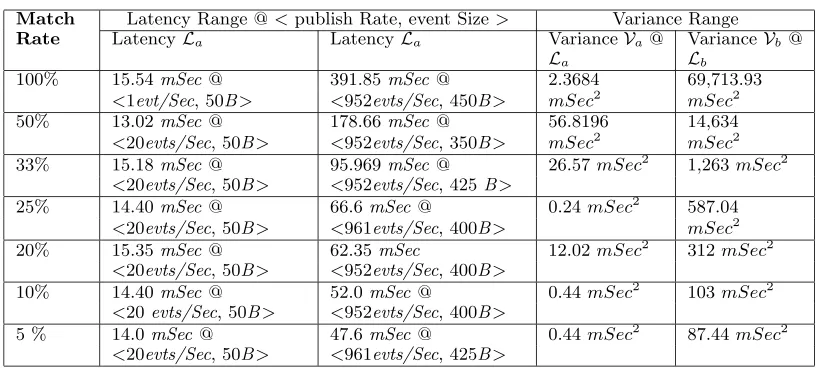
Match Latency Range @<publish Rate, event Size> Variance Range
Rate LatencyLa LatencyLa VarianceVa@
La VarianceLb Vb @
100% 15.54mSec @ 391.85mSec@ 2.3684 69,713.93
<1evt/Sec, 50B> <952evts/Sec, 450B> mSec2 mSec2
50% 13.02mSec @ 178.66mSec@ 56.8196 14,634
<20evts/Sec, 50B> <952evts/Sec, 350B> mSec2 mSec2
33% 15.18mSec @ 95.969mSec@ 26.57mSec2 1,263mSec2
<20evts/Sec, 50B> <952evts/Sec, 425B>
25% 14.40mSec @ 66.6mSec @ 0.24mSec2 587.04
<20evts/Sec, 50B> <961evts/Sec, 400B> mSec2
20% 15.35mSec @ 62.35mSec 12.02mSec2 312mSec2
<20evts/Sec, 50B> <952evts/Sec, 400B>
10% 14.40mSec @ 52.0mSec @ 0.44mSec2 103mSec2
<20evts/Sec, 50B> <952evts/Sec, 400B>
5 % 14.0mSec @ 47.6mSec @ 0.44mSec2 87.44mSec2
[image:28.612.93.502.104.289.2]<20evts/Sec, 50B> <961evts/Sec, 425B>
Table II. Latency and Variance Range Table
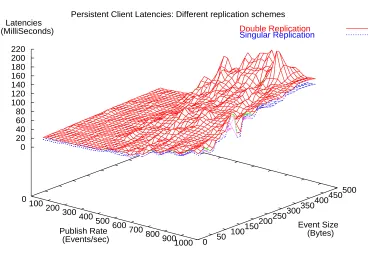
involved for singular and double replications experienced at clients attached to nodes 7and 10 respectively. Every node (with the exception of nodes 7 and 10) in the system has 5 persistent subscribing clients attached to it, for a total of 102 persistent subscribing clients. The publisher and the 2measuring subscribers are all hosted on the same machine for reasons discussed earlier. Figure 7 depicts the latencies in delivery of events at persistent clients, with singular and double replications for a matching rate of 50%.
5.3.3. Pathlengths and Latencies
Persistent Client Latencies: Different replication schemes
Double Replication Singular Replication
0 100200
300 400500
600700 800900
1000 Publish Rate
(Events/sec) 0 50 100
150200 250300
350400 450500
Event Size (Bytes) 0
[image:29.612.114.482.115.371.2]20 40 60 80 100 120 140 160 180 200 220 Latencies (MilliSeconds)
Figure 7. Match Rates of 50% - Persistent Clients (singular and double replication)
the event size and publish rates increase is however similar to our earlier cases. We depict our results, gathered at the three measuring subscribers for a matching rate of 50%. The pattern of decreasing latencies with a decrease in the number of broker hops is clear by looking at figure 9. Additional results at different matching rates can be found in [37].
6. Conclusion
SSC-B SC-4
SC-5
SC-6
n 9
10 i
11 4
5
j
15 6
7
m
17 18
16 h
14 12
13
8
22
Publisher
Subscriber (Server
Hops=4) 8
1 Level-3 Storage
Level-2 Storage k
1 2
3 l
20 19
21 Subscriber
[image:30.612.143.454.126.455.2]Server Hops=2 Subscriber Server Hops=1
Figure 8. Testing Topology - Latencies versus broker hops
with geometric increases in the size of the broker network. The feature of having multiple links between two units/super-units ensures a greater degree of fault tolerance.
Latencies under different server hops:22 Servers 102 Clients (Match Rate 50%)
Server Hop=4 Server Hop=2 Server Hop=1
0
100 200
300 400
500 600
700 800
900 1000 Publish Rate
(Events/sec) 0
50100 150200
250300 350400
450500
Event Size (Bytes) 0
[image:31.612.120.477.143.370.2]20 40 60 80 100 120 140 Latencies (MilliSeconds)
Figure 9. Broker Hops - Match Rate 50%
equally well, lends itself as a very scalable solution under conditions of varying publish rates, matching rates and message sizes.
The paper outlined a scheme for the delivery of events in the presence of broker node failures. In our scheme a unit could fail and remain failed forever. The only requirement that we impose is that if a stable storage fails, it should recover within a finite amount of time. The replication strategy, that we adopted allows us to add stable storages and also to withstand stable storage failures. The replication strategy, epochs associated with received events and profile ID’s associated with client profiles allowed us to account for a very precise recovery of events for clients with prolonged disconnects or those which have roamed the network.