Abstract: E-learning data becomes ‘Big’ data as it describes a huge volume of both structured and unstructured data. And inherent limitations of relational databases maintained in this context makes difficult to apply and to extract outputs meaningful. Data modeling is also recommended to design data views at various levels either conceptual or physical here. Most of the educational organizations are keen in collecting, storing and analyzing the students’ data because it will add more significant value to the decision making process. Data modeling through entity relationship model or query views plays a important role in dealing with big data due to the fact around 85% of big data is semi structured data. Hence data modeling should be carried out as required by any learning institution needs. Making big data component to reside in the data model is challenging. This paper is to establish data modeling techniques applied to a reasonably ‘big’ data in e-learning. Prediction models generated from this data will be accurate if the training sets and testing sets are governed properly in spite of data size complexity. Student Performance by study credits (partitioned in three classes: low, medium, high ) are classified with respect to their engagement attributes (activity types, sum of clicks made, duration in days) and obtained maximum accuracy 90.923%.
Keywords : E-learning, ER diagram, R Programming, SQL, Weka 3.9, Classifiers, J48, Jrip, Random Forest , Random Tree, Bagging. Big data.
I.INTRODUCTION:
T he general guidelines and studies [1, 2] to bring up the quality of learners have been evolving all along . The fields of studies machine learning (methods for predicting) and big data modeling [10] (methods to move with voluminous and dynamic data) E-learning data becomes Big data as it describes a huge volume of both structured and unstructured data. And inherent limitations of relational databases, it can also be efficiently applied to extract outputs meaningful. Data modeling is also recommended to design data views at various levels either conceptual or physical. Most of the educational organizations are keen in collecting, storing and analyzing the students’ data because it will add more significant value to the decision making process. Data modeling through entity relationship model or query views plays a important role in dealing with big data due to the fact around 85% of big data is semi structured data. Hence data modeling should be carried out required by any learning institution needs. Making big data component to
Revised Manuscript Received on September 03, 2019
C.S.Sasikumar, Research Scholar in Bharath Institute of Higher education
and Research, Chennai.
A.Kumaravel, Professor and Dean, School of Computing, Bharath
Institute of Higher education and Research, Chennai.
reside in the data model is challenging. This paper is to establish data modeling techniques applied to a reasonably ‘big’ data in e-learning. Prediction models generated from this data will be accurate if the training sets and testing sets are governed properly in spite of data size complexity. The combined data from various locations for various courses with many different activity types is very huge. The efforts in [5,8] are commendable in this direction. The approaches motivated to go for divide and conquer strategy in order to monitor and predict the patterns in such huge dynamic data set. The authors also tried in [3, 4] same direction for possible prediction models with appropriate data preprocessing techniques. The work in [6] involves measuring students’ engagement using log files. The same author tries to detect students’ disengagement interestingly in [7]. The contribution in [8] exclusively is made for students’ engagement in the e-learning environment. In the current work authors concentrate on the data size issue in a non conventional way and obtain the results. This paper is organized with mainly by the data preprocessing filters in terms SQL queries and the description of intermediate and final data sets. Section 2 contains the details of data set description and data preprocessing applied in this paper. Section 3 is devoted to the brief discussion on tools selected for this e-learning data pre processing and mining. Section 4 deals with the primary experiment set ups and the results obtained from those experiments followed by concluding remarks in section 5.
II.DATASETDESCRIPTIONANDDATA PREPROCESSING:
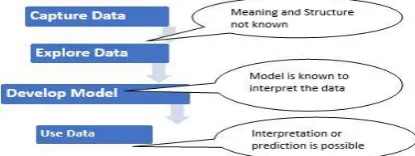
[image:1.595.325.533.643.721.2]In many applications, the data already exist and the attention needed for how to channel the required data items and proper predictions based on set of facts and related dimensions that both accurately describe the future performance given at right level of detail. The data conversions from the raw data to predictable data are shown in Figure 0.
Figure 0. Data Conversions from ‘raw’ data to ‘predictable’ data.
Supervised Models for Measuring Performance
At E-Learning Environment
The learning models for the e-learning predictions are selected as 1) tree based 2) rule based and 3) ensemble based .Since these models require data as a single relation, the transformation of data to required format is done as discussed and shown in Figures 2-12.
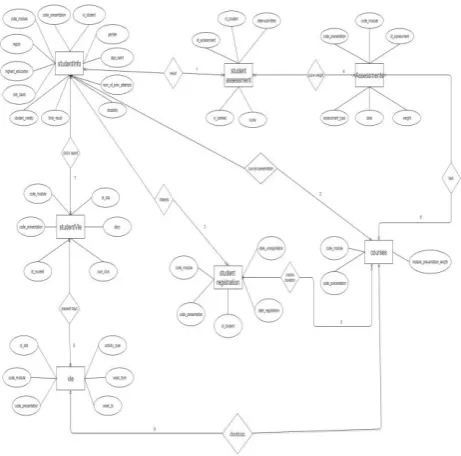
.The dataset used here is downloaded from the Open University [9]. The data model embedded with this e-learning data is shown in Fig 1. It contains seven entities with student, course and the engagement attributes related with relationships. Our main intention is to generate prediction models from this ER model. This normalized data is not feasible for machine learning algorithms and hence we preprocess the data with following steps and then the preprocessed data is used to get training and testing datasets. Data preprocessing is done using query transforms as shown in Figure 2 and rest of the figures up to Figure12. The inputs to the queries are either original data tables from e-learning sites or data sets generated from the previous queries. There are eleven such queries and the description of each query is given either as SQL command (example, query 1) or data extraction and assignment command (example, query 2).
[image:2.595.312.554.290.356.2]2. 1Data Transformations: -
Figure 2. Query-1 for combining a studentVle and vle table for getting id_site,id_student,sum_click and activity_type
Query -1 is to combine given tables studentVle and vle and
the command is given by “Select
studentVle.code_module,studentVle.id_site,
StudentVle.id_student,studentVle.sum_click ,
[image:2.595.48.267.349.423.2]vle.activity_type from vle inner join studentVle on studentVle.id_site=vle.id_site”
Figure 3. Randomly selected record from data2
Query -2 is to generate random subset with hundred thousand instances based on the result generated by query 1
and the command is given by
data2randomdata2[sample(nrow(data2), 100000), ]
Figure 4. Randomly selected record from studentVle
Query -3 is to generate random subset with hundred thousand instances from studentvle and the command is given by studentVle_random studentVle[sample(nrow(studentVle), 100000), ]
Figure 5.Combining a data2 random and studentVle_random table for getting activity type, sum click and days
Query -4 is to combine dataset data2random and studentVle_random and the command is given by “select distinct data2random.id_student,data2random.activity_type, data2random.sum_click,studentvle_random.days
fromdata2random innerjoin studentvle_random
on data2random.id_student=studentvle_random.id_student”
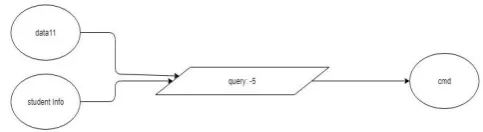
Figure 6.Combining the datasets data11 and student Info table for getting activity type, sum click, days and studied credits
Query-5 is to combine datasets data11(output of query 4) and studentVle_random and the command is given by “select distinct
data11.id_Student,data11.activity_type,data11.sum_click,dat a11.days,studentInfo.studied_credits from datat11 inner
join student info on
data11.id_student=studentInfo.id_student”
Figure 7. Randomly selected record from cmd Query:6 is to generate random subset of cmd ( course management details, output generated by query 5) and the command is given by
“cmd_subset1cmd[sample(nrow(cmd), 100000), ]”
Figure 8. Randomly selected record from cmd Query-7 is to generate random subset 2 from ‘cmd’ dataset and the command is given by “cmd_subset2
cmd[sample(nrow(cmd), 100000), ]”
[image:2.595.58.283.558.621.2]Query-8 is to generate random subset 3 from ‘cmd’ dataset and the command is given by ”cmd_subset3
[image:3.595.50.280.87.127.2]cmd[sample(nrow(cmd), 100000), ]”
Figure 10. Randomly selected record from cmd
Query-9 is to generate random subset 4 from ‘cmd’ dataset and the command is given by ”cmd_subset4
cmd[sample(nrow(cmd), 100000), ]”
Figure 11. Randomly selected record from cmd
Query-10 is to generate random subset 5 from ‘cmd’ dataset and the command is given by ”cmd_subset5
cmd[sample(nrow(cmd), 100000)]”
Figure 12. Randomly selected record from cmd
[image:3.595.59.282.188.222.2]Query-11 is to generate random subset 6 from ‘cmd’ dataset and the command is given by ”cmd_subset6 cmd[sample(nrow(cmd), 100000), ]”
Figure 1. Organization of dataset using seven entities
2. 2Organization of e-learning tables
The description of Figure 1 is given below for showing the connectivity of all the participating entities. There are nine relationships as we see and the purpose of each relationship is also depicted.
Connection 1: student_info table linked to student_assessment table
Purpose: To get the date submitted and score of the assessment.
Connection 2: student_info table linked to courses table
Purpose: To get the module presentation length of the courses.
Connection 3: student _info table linked to student registration table
Purpose:To get the date registration and date unregistration of the student registration.
Connection 4: student _assessment table linked to assessment table
Purpose: To get the assessment type, date and weight of the assessment.
Connection 5: student_registration table linked to courses table
Purpose:to get the module presentation length of the course. Connection 6:the entity assessment linked to course table Purpose: To get the module presentation length of the course. Connection 7:the entity student_info linked to student vle table
Purpose: To get the id site, date and sum click of the student_vle.
Connection 8:the entity student_vle linked to vle table Purpose: To get the activity type, week from and week to of the vle.
Connection 9: course table linked to vle table
Purpose: To get the activity type ,week from and week to of the vle.
2. 3Data description:
Meta data for seven original data tables , query results, six random subsets are tabulated with the number of records as shown in the tables 1 to 17. The final table shows the frequency of activity types in order to prioritize them,
s.no attribute Values
range
# Distinct values
Data type
1. code_module AAA-GG
G
7 nominal
2. code_presentatio n
2013B,20 13J,2014 B,2014J
4 nominal
3. id_assessment 0 – 45000 206 numeric 4. assessment_type Cma,exa
m,tma
3 nominal
5. date 0 - 280 74 numeric
6. weight 0 - 100 24 numeric
Table1: -Assessment table(206 Instances)
[image:3.595.53.284.390.618.2]Table3: -Student Assessment: -(173912 Instances)
Table4: -studentInfo(32593 Instances)
Table5: -Student Registration (32593 Instances)
Table6: -StudentVle(1048575 Instances)
s.no attribute Value
range
# distinct values
Data type
1. Code_module AAA-BBB 2 nominal
2. Code_present ation
2013B,2014 B,2014J
3 nominal
3. Id_student 0 - 2700000 4080 numeric
4. Id_site 520000 -
1060000
1029 numeric
5. Days(number of days either previously taken number of days for future preparation)
-30 to + 270 294 numeric
6. Sum_click 0 - 7000 168 numeric
Table7: -Vle(6364 Instances)
Table8: -data2random (100000 Instances)
s.no Attribute Value range #
distinct values
Data type
1. Code_module AAA-GGG 7 nominal
2. Id_site 520000 –
1060000
540000 Numeric
3. Id_student 0-2700000 2700000 numeric
4. Sum_click 0-7000 7000 numeric
5. Activity_type 20 types of activity
20 nominal
Table9: -StudentVle_random(100000 Instances)
s.no Attribute Value
range # distinct values
Data type
1. Code_module AAA-GG
G
2 nominal
2. Code_presentati on
2013B,2 013J,201 4B,2014J
4 nominal
3. Id_student 0 -
2700000
20311 numeric
4. Id_site 500000 -
1050000
4167 numeric
5. Days(number of days either previously taken to pre or number of days for future preparation)
-40 - 280 295 numeric
6. Sum_click 0 - 500 147 numeric
Table10: -data11(599563 Instances)
s.no Attribute Value range #distinct
values
Data type
1. Id_student 0 - 2700000 17940 numeric 2. activity_type 19 types of
activity
19 nominal
3. Sum_click 0 - 650 155 Numeric
4. Days -30 - 270 295 numeric
Table11: -cmd(657307 Instances)
s.no attribute Value range #distinct
values
Data type
1. Id_student 0 - 2700000 17940 Numeri c 2. Activity_type 19 types of
activity
19 Nomina
l
3. Sum_click 0 - 650 155 Numeri
c
4. Days -30 - 270 295 Numeri
Table12: -cmd_subset1(100000 Instances)
s.no attribute Value
range
#distinct values
Data type
1. Id_student 0 - 2800000 13260 Numeric
2. Activity_type 1-19 19 numeric
3. Sum_click 0 - 650 141 Numeric
4. Days -40 - 280 295 Numeric
5. Studied_credits Low,mediu m and high
3 nominal
Table13: -cmd_subset2(100000 Instances) s.n
o
attribute Value range #distinc
t values Data type
1 Id_student 0 - 2800000 13163 Numeric
2 Activity_type Jan-19 19 Numeric
3 Sum_click 0 - 650 141 Numeric
4 Days -320 295 Numeric
5 Studied_credit s
Low,medium and high
3 nominal
Table14: -cmd_subset3(100000 Instances)
Table15: -cmd_subet4(100000 Instances)
Table16: -cmd_subset5(100000 Instances)
Table17: -cmd_subset6(100000 Instances)
Numerical values are assigned for the ‘activity type’ which has 19 types and the following table enumerates the activity types name and the corresponding frequencies in the six random subsets generated.
Table 18 Associating numerals to the attribute ‘activity type’ based on the frequency of occurrences in the
corresponding datasets involved
In order to prioritize the activity types assigned for e-learners, we assign rank value based on the frequency of occurrences of each type for the courses and the selected learners by the randomizer and it is shown in Table 18. Based on Table 18, the mapping ‘m’ of numerical values from activity types to {1,2,…..,19} is constructed as follows:
If (Sort [frequency(ai)]= [b1,b2,…..,b19]) and (b1≤ b2 ≤ b3….. ≤ b18≤ b19) then m(bi) = i. For example m(b3) =m(html_activity)= 3;
III.TOOLSSELECTED:
IV.EXPERIMENTALSETUPANDRESULTS: The classifiers coded in Java in the Weka tool are selected and the algorithms implemented in Weka, applied over the preprocessed data are Random tree (type: decision trees), J48 (type: decision trees), JRip (type: decision rules), Bagging (type: meta classifiers) and Random forest (type: decision trees). The brief description of each classifier goes as follows: Random Tree works on selecting nodes with random subset of attributes partitioned with respect to the metric like information gain; J48 also works with each attribute in a node branching out in accordance with attribute values and information gain. All the results reside in leaf nodes. JRip generates rules with confidence or support measures for each rule and decision rules are generated using covering algorithm. Bagging and Random Forest models come under ensemble type as they are meta classifiers with members from base classifiers (This work is limited with these meta classifiers without changing the base classifier, i.e default base classifier) . The input data is generated as course management details and it is found to be relatively big.(2.7/2.8 million student records). We construct six random subsets of this input data set with by partitioning as shown in the set of tables from Table 12 to Table 17. This shows each data subset is of size 100,000 instances. The general divide and conquer strategy is applied on our data with 30 iterations as depicted in the figure 13.
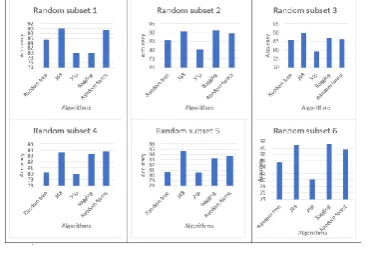
[image:6.595.77.262.477.604.2]Here the results in terms of accuracies are shown for each random subset of course management which contains students’ engagement. The final result is the order of performance given by the supervised learning models based on the implementations as JRip, Random tree, Bagging, Random forest and J48. And the maximum accuracy in this list found to be 90.923% among the random subsets as shown in Figure 13.
Figure 13.Comparing of classifiers’ performance for different random subsets with 30 iterations.
V.CONCLUSION:
The students’ study credits related significantly on sum_clicks, activity types , days in a course, done by set of learners picked randomly. The decision tree algorithm dominates every other algorithm for modeling this relationship using Weka tool. The sizes, silos of data with dynamic characteristics are controlled by appropriate queries in R Studio. These results will support design of assessments and crucial decisions on updating strategies for various regions of e-learners.
ACKNOWLEDGEMENT
The authors would like to thank Bharath Institute of Higher Education and Research for providing facilities and encouragement throughout this research studies.
REFERENCES
1. S. Christenson, A. Reschly, C. Wylie, Handbook of Research on Student Engagement (Springer, New York, 2012)
2. S.Christenson, A.R. Anderson, The centrality of the learning context for students’ academic enabler skills. School Psychological Review 31(3), 378–393 (2002)
3. C.S.Sasikumar, A.Kumaravel, Yet another Approach for Construction of Cost Sensitive Classifiers for E-Learning Datasets, International Journal of Engineering & Technology, 7 (4.39) (2018)1047-1052 4. C.S.Sasikumar, A.Kumaravel, Attribute Selection on Student Academic
and Social Attributes Based on Randomized And Synthetic Dataset, International Journal of Engineering & Technology, 7 (4.39) (2018), 1069-1075
5. Wolff, A., Zdrahal, Z., Herrmannova, D., &Knoth, P. (2013). Predicting Student Performance from Combined Data Sources. Studies in Computational Intelligence, 175–202.
6. M. Cocea, S. Weibelzahl, Log file analysis for disengagement detection in e-learning environment. User Model. User-Adap. Inter. 19, 341–385 (2009)
7. M. Cocea, S. Weibelzahl, Disengagement detection in online learning: Validation studies and perspectives. IEEE Trans. Learn. Technol. 4(2), 114–124 (2011)
8. B.M. Booth, A.M. Ali, S.S. Narayanan, I. Bennett, A.A. Farag, Toward Active and Unobtrusive Engagement Assessment of Distance Learners (International Conference on Affective Computing and Intelligent Interaction, San Antonio, 2017)
9. Data downloaded from: https://analyse.kmi.open.ac.uk/open_dataset. [accessed May 1 2019]
10. “A STUDY ON BIG DATA MODELING TECHNIQUES” Available from:
https://www.researchgate.net/publication/309194567_A_STUDY_ON _BIG_DATA_MODELING_TECHNIQUES [accessed Jul 21 2019].
AUTHORSPROFILE
C.S.Sasikumar, having around 27 years of experience in computer application technology and also He is a Research Scholar in Bharath Institute of Higher education and Research, Chennai. His research interest includes Soft Computing, Cloud Computing, Machine Learning, Pervasive Computing, Mobile application development and Enterprise application development.