Abstract: Clustering is widely used technique for grouping of data objects based on similarity features. The similarity features are derived from the similarity or dissimilarity metrics like Euclidean, cosine etc. Traditional clustering methods such as k-means, and other graph-based techniques are major techniques for discovery of clusters. However, these methods require user interference for determining the number of clusters initially. Determining the number of clusters for given data is known as cluster tendency. There is chance for getting poor clustering results when using either k-means or graph-based clustering methods with intractable value of ‘k’ by user. Thus, it is required to focus on cluster tendency methods for knowing prior knowledge about number of clusters in clustering. This paper presents the various visual access tendency (VAT) methods for good assessment of number of clusters.
Keywords: Clustering, Cluster Tendency, Similarity Measures, VAT
I. INTRODUCTION
T
he process of clustering [1] is majorly depending to key steps, these are as follows 1) assessment of cluster tendency 2) data partitioning. Clustering methods needs to know the prior knowledge about number of clusters (also called as cluster tendency). Effective data partitioning increases the rate of cluster accuracy when they tractable with accurate cluster tendency. Bezdek et. al. [2] proposed various visual approaches for determination of cluster tendency visually and their approaches are VAT [2] [3], spectral VAT (SpecVAT) [4] [15], and improved VAT (iVAT) [13]. The basic model of VAT works on dissimilarity features [12] of data objects and these features are computed using distance metrics like Euclidean [6] and cosine metric [7]. It works on simple datasets and performs the process of assessment of number of clusters. It doesn’t work on typical datasets, in such cases, it is required to compute the spectral features of typical datasets for better assessment of cluster tendency. It is performed by SpecVAT method and it enable for giving the good clarity of clusters when compared to VAT. Path-shaped datasets [6] are follows the specific pattern of clusters and objects are also aligned according to pattern or shape of paths. For path-based datasets, both VAT and SpecVAT are unable to access the number of clusters information. There is another visual approach, improved VAT (iVAT) [7] [13] is especially usedRevised Manuscript Received on September 06, 2019
M Suleman Basha, Research Scholar, Dept. of CSE, Dayananda Sagar University, Bangalore, Karnataka, India. Email: [email protected]
Dr. S K Mouleeswaran, Dept. of CSE, Dayananda Sagar University, Bangalore, Karnataka. Email: [email protected]
Dr. K Rajendra Prasad, Dept. of CSE, Institute of Aeronautical Engineering, Hyderabad, India. Email: [email protected]
for path-shaped datasets for effective determination of number of clusters.
The visual approaches, VAT, SpecVAT, iVAT are used Euclidean distance during the computation of dissimilarity features [12]. Cosine is another alternative distance metric and it considers both the magnitude and direction of the data object unlike only distance in Euclidean distance metric. It is noted that cosine metric is more robust metric than Euclidean in visual approaches. In recent study, it is investigated that VAT and SpecVAT are developed using cosine based dissimilarity features, these extended approaches are cVAT [8], and cSpecVAT[9]. These methods achieve the better assessment of cluster tendency than VAT and SpecVAT [15]. Traditional clustering methods use the prior cluster tendency from visual approaches and improvised the quality of clusters for comprehensive datasets. The primary logic of visual approaches is that they use the Prim’s logic [10] for reordering the indices of data objects and then visualizes the clusters in the image form as a square shaped dark coloured block along the diagonal. Each square shaped dark coloured block represents as cluster and count of these blocks shows the cluster tendency. In a specVAT [15], Eigen vectors are derived for obtaining of spectral features and affinity matrix is derived between corresponding eigen values of data objects. Image of SpecVAT shows the clarity of clusters with square shaped dark coloured blocks. In the observation study of existing approaches, it is concluded that cVAT and cSpecVAT shows the clarity of images than other visual approached and it is preferred that these methods are used for effective assessment of cluster tendency in clustering results. Remainder part of the paper is organized as follows: Section 2 describes the similarity metrics of visual approaches, Section 3 presents the algorithms of visual approaches, Section 4 observation study and Section 5 presents the conclusion.
II. SIMILARITYMETRICSOFVISUAL APPROACHES
Distance metrics are used for measuring dissimilarity features amid pair of data objects and stores all pairs of distinguished features in the matrix called as dissimilarity matrix. Several standard metrics for computing the dissimilarity matrix are Euclidean [4], Cosine [5], Jaccard coefficient [6], extended Jaccard coefficient [7], and Dice [8] and these formulas are shown in following equations from (1) to (4) respectively. The Euclidean is definite as the square root of square difference among the data objects. The equation is as follows.
Cluster Tendency Methods for Visualizing the
Data Partitions
(1)
Cosine similarity is used to measure the angle between any two data objects d1, and d2]
(2)
Use a Jaccard coefficient for the determination of comparing two sample datasets. It is defined in [6]
The extended Jaccard coefficient is another form of Jaccard coefficient which is used for data processing, the particular equation is defined as follows.
(3)
Dice is also alike to extended Jaccard co-efficient, it is defined as follows.
(4)
The cosine metric computes the angle with respect to a single origin or a single view point. It is enhanced and extended cosine metrics measures the similarity features with respect to mutli-view points, hence this extended metric is known as multi view-points based similarity measure, shortly called as MVS-cosine metric, that computes the similarities between data objects w.r.t multiple view-points and it is shown in equation (5) [9] [10] [11]. Present cosine distance metric takes the single view point as origin when measuring the similarity features between data objects. This single viewpoint-based cosine metric cannot capable for assessing more informative of features between data objects in stating either implicitly or explicitly. The extended MVS based cosine metric is more informative than a single view point in cosine distance metric.
We define comparisons among two objects di, and dj w.r.t.
dissimilar view-points as follows:
(5)
In equation (5), the variable Sr defines the all objects except di and dj , and it is noted that MVS based
cosine similarity metric takes the average similarities between di and dj with respect to total ‘(n-2)’ number of
several view-points in MVS cosine space. From the evidence of practical results of MVS cosine space [9]. Finally, in the study of various distance metrics, it is observed that both cosine and MVS based cosine metrics perform well for accessing of robust similarity features and
reference cosine space. It would be useful in assessment of various cluster tendency methods and the respective study of similarity features in visual approaches is presented in following sub-section. These similarity measures are plays vital role in determination of cluster tendency by assessing the data object’s similarity features in the framework of visual approaches and also achieves the efficient clustering results with this good assessment of cluster tendency.
III. ALGORITHAMSOFVISUALAPPROACHES
Visual approaches for assessment of cluster tendency are VAT, SpecVAT, and iVAT [13], however, most of datasets are not path-based datasets. Thus, VAT and SpecVAT are frequently used visual approaches for accessing of cluster tendency value. iVAT works only on path-based datasets. The basic algorithm model of VAT [2] is presented as follows:
VAT algorithm [2]
Input: Dissimilarity Matrix R=[rij], for 1 ≤ i,j ≤ n
Method:
Step 1: Set I = { }; J = {1,2,…,n}; P = (0, 0, …, 0);
Select (i,j)
arg max p
J,q
J {rpq} ;Set P(1) = j;
I = I
{j} and J = J – {j}Step 2: For t = 2,…, n:
Select (i,j)
arg min p
I,q
J {rpq} ;Set P(t) = j;
I = I
{j} and J = J – {j} End forStep 3: RDM= [ri j ]= [rP(i)P(j) ] for 1 ≤ i,j ≤ n
(a) Dissimilarity matrix ‘R’ and its dissimilarity image ‘I’ (before applying the VAT)
[image:3.595.47.275.64.173.2](b) After applying VAT
Fig. 1. VAT Example
The image of RDM illustrate the squared shaped dark coloured blocks along the diagonal and count of these blocks shows the cluster tendency value or the number of clusters for given data objects. The illustrative example of VAT shown in following Fig. 1.
The SpecVAT finds the spectral based features using Eigen computation and it is more effective visual approach that VAT in good assessment of cluster tendency. The algorithm of SpecVAT [15] is presented as follows:
Algorithm: SpecVAT [15]
Step1: Compute a local scale σi for each object oi using σi= d(oi, ok) = dik,
where ok is the k-th nearest neighbour of oi. Step2: Construct the weighting matrix W
Rn×nDefining wij= exp(−dijdij/(σiσj)) for i = j,
and wii= 0.
Step3: LetMto be a diagonal matrix with mii=
n
j
wij
1 L=M-1/2W M-1/2, is a normalized version of the Laplacian matrix.
Step3a: k=2; repeat
Step4: Choose v1, v2, · · · ,vk, the k largest eigenvectors of L to form the matrixV = [v1, · · · , vk]
Rn×k bystacking the eigenvectors in columns.
Step5: Construct dissimilarity matrix Dnew between pair of objects
Step6: Apply VAT to Dnew to obtain I(Dnew),k=k+1 until k=kmax
SpecVAT initially finds the affinity matrix in Step1 and Step 2 by using k- nearest neighbor’s information and determined the normalized Laplacian matrix for obtained affinity matrix in Step 3. This Laplacian matrix shows the spectral features in Eigen vectors form. Top eigen vectors are in dissimilarity matrix and VAT is applied on this spectral based dissimilarity matrix for better assessment of cluster tendency. The techniques of cVAT [8] and cSpecVAT [15] are used cosine metrics in finding dissimilarity metrics for effective assessment of cluster tendency than VAT and SpecVAT and its observation study is presented in following sub-section.
IV. EXPERIMENTALRESULTS
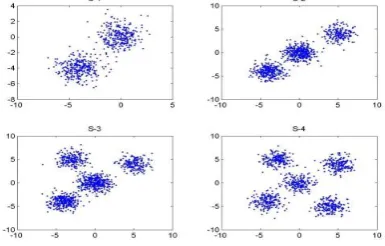
[image:3.595.52.279.220.347.2]The visual approaches are analyzed with observation of experimental results on variety of synthetic datasets and real-life datasets. The details of real-life datasets [14] are described in Table 1 and generated synthetic datasets are shown in Fig. 2.
Table I: Description of the Datasets Real
dataset
Name of the Dataset No. of Clusters (or Classes)
R-1 Iris 3 (No of classes)
R-2 Voting 2 (No of classes)
R-3 User Modelling 4 (No of classes)
R-4 Wine 3
R-5 Seeds 3
R-6 Yale Face Image Data 3 Persons data
R-7 Pin-wheeled 4
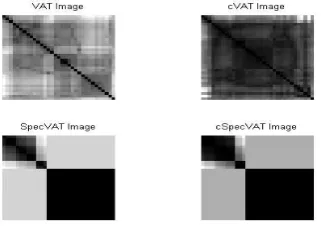
[image:3.595.328.552.298.404.2]Table I shows the Iris, Voting, User modelling, Seeds, Wine, Yale face ND Pin-wheeled datasets with clusters of 3,2,4,3,3,3 and 4 respectively and synthetic datasets S-1, S-2, S-3, S-4 are generated with two, three, four and five clusters respectively. These data sets are used for verification of assessment of cluster tendency using existing visual approaches of VAT, SpecVAT, cVAT, cSpecVAT. Determining the best visual approach among the existing techniques is the key objective of this observation study during experimental study. The resulting images of VAT, SpecVAT, cVAT, and cSpecVAT of S-4 and Iris datasets are shown in Fig. 3 and Fig. 4 respectively. Pin wheeled datasets are shown in Fig. 5 and Yale face datasets are shown in Fig.6.
[image:3.595.329.522.594.717.2]Fig. 3. Results of Visual Approaches for S-4 Dataset
Fig. 4. Results of Visual Approaches for Iris Dataset
Fig.5. Resulting Image for Four Pin-wheeled Dataset
Fig. 6. Resulting Images for Face Dataset
From Fig. 3, Fig. 4, Fig 5 and Fig.6 it is observed that SpecVAT and cSpecVAT show the more clarity of square shaped dark coloured blocks along the diagonal than other
cosine based visual approaches are more suited in assessment of cluster tendency for real life clustering applications.
V. CONCLUSION
Clustering is an unsupervised approach for making data partitions of data based on similarity features. Traditional clustering algorithms performs data partitions without knowing the prior information of number of clusters or cluster tendency. The various visual approaches, namely visual access tendency (VAT), SpecVAT, iVAT, cVAT, and cSpecVAT for assessment of prior cluster tendency in major clustering algorithms. Experimental results are presented of these approaches on several bench-marked datasets for evaluation of cluster tendency and finally stated that spectral based visual approaches are more effective than others in assessment of cluster tendency.
REFERENCES
1. Liang Wang, Christopher Leckie, Kotagiri Ramamohanarao, and James
Bezdek: Automatically Determining the Number of Clusters in Unlabeled Data Sets. Fellow, IEEE, 2009,21(3), pp.335-350.
2. Bezdek JC, Hathaway RJ: VAT: A tool for visual assessment of (cluster)
tendency. In Neural Networks, 2002. IJCNN'02. Proceedings of the 2002 International Joint Conference, 3, pp.2225-2230.
3. Dheeraj kumar, Bezdeck: A Hybrid Approach to Clustering in Big Data.
IEEE Transactions on Cybernetics,2015, pp: 2168-2267.
4. T.W. Schoenharl and G. Madey: Evaluation of measurement techniques
for the validation of agent-based simulations against streaming data. in Proc. ICCS, Krakow , Poland (2008)
5. J.Han and M.Kamber: Data Mining Concepts and Techniques. 2nd ed.
San Franciso, CA, USA. Morgan Kaufmann. Bostan, MA, USA, Elsevier (2006)
6. C.G Gonalez: Density of closed balls in real valued and autometrized Boolean spaces for clustering applications. in Proc. 19th Brazelian Symp. Artif. Intell, Savador, Brezil, 2008, pp.8-22.
7. Strehl and J. Ghosh: Value-based customer grouping from large retail datasets. in Proc. SPIE, vol. 4057.Orlando, FL, USA, 2000, pp. 33-42.
8. P.N Tan, M. Steainback, and V.Kumar: Introduction to Data Mining.
Boston, MA,USA: Addison-Wesley (2006).
9. Duc Thang, Nguyen: Clustering with Multi-Viewpoint based Similarity
Measure. IEEE Trans on Knowledge and Data Engineering. 24(6), 2012, 988-1001.
10. H. Tang, S.M. Chu: Partially supervised speaker clustering. IEEE Trans.
Pattern Anal. Machine Intell. 34(5), 2012, pp. 959-971.
11. Yang Yan, Lihui Chen, Duc Thang nguyen: Semi-supervised clustering
with multi-viewpoint-based similarity measure. WCCI 2012 IEEE world congress on computational intelligence (2012)
12. Bezdek JC, Hathaway RJ, Huband JM: Visual assessment of clustering
tendency for rectangular dissimilarity matrices. Fuzzy Systems, IEEE Transactions, 15(5), 2007, pp. 890-903.
13. Havens TC, Bezdek JC: An efficient formulation of the improved visual
assessment of cluster tendency (iVAT) algorithm. Knowledge and Data Engineering, IEEE Transactions, 2012, Volume: 24 Issue:5, pp. 813-822
14. B Eswara Reddy, K Rajendra Prasad: Improving the performance of
visualized clustering method. International Journal of System Assurance
Engineering and Management (Springer), Volume 7(1), 2016, pp
102–111.
15. L. Wang, G. Xin, J.C. Bezdek, C. Leckie, K. Ramamohanarao:
[image:4.595.87.262.403.520.2] [image:4.595.85.246.569.685.2]AUTHORSPROFILE
M Suleman Basha is currently working as an Assistant Professor in the Department of CSE, RGMCET, Nandyal, India. He has completed his B.Tech in IT at HPCET, Hyderabad and completed M.Tech in CSE at JBREC, Hyderabad. He is active in the research areas of data mining, and speech recognition and has published several conference papers.
Dr S.K Mouleeswaran working as Associate Professor, earned his doctorate from Anna University Chennai, Masters (M.E) from Anna University Chennai and B.E (CSE) from Bharadidasan University Trichy. He has more than 14 years of Teaching, 2 years of Industry and 8 years of Research experience. He has many publications in reputed journals, conferences and guided both UG and PG thesis.